Top 3 Price Prediction Bitcoin, Ethereum, Ripple: Faux strength or resurgence of bullish momentum?
- Bitcoin price will undo the bearish outlook if it can turn the $24,565 resistance level into a support floor.
- Ethereum price attempts to reclaim the $1,730 level but depends massively on BTC’s directional bias.
- XRP price hints at a potential 12% rally but this move has a small time window to complete its objective.

Bitcoin price shows a resurgence of buying pressure as the eastern markets open fresh to a new week. This development, while bullish, could turn sour if BTC fails to overcome a significant hurdle. Assuming this occurs, the recent surge in Ethereum, Ripple and other altcoins could also quickly come undone.
Bitcoin price takes another jab
Bitcoin price fractal explained earlier is still in play, however, the recent surge in bullishness has caused BTC to slice up through the $23,383 to $24,198 supply zone. This move could extend until the one-hour price inefficiency at $24,362 is tagged.
This is the point of no return for bears and hence has to be defended. However, if BTC bulls take control and flip the $24,565 resistance level into a support level, it will invalidate the fractal formation and trigger a rally to $28,000 or $29,000.
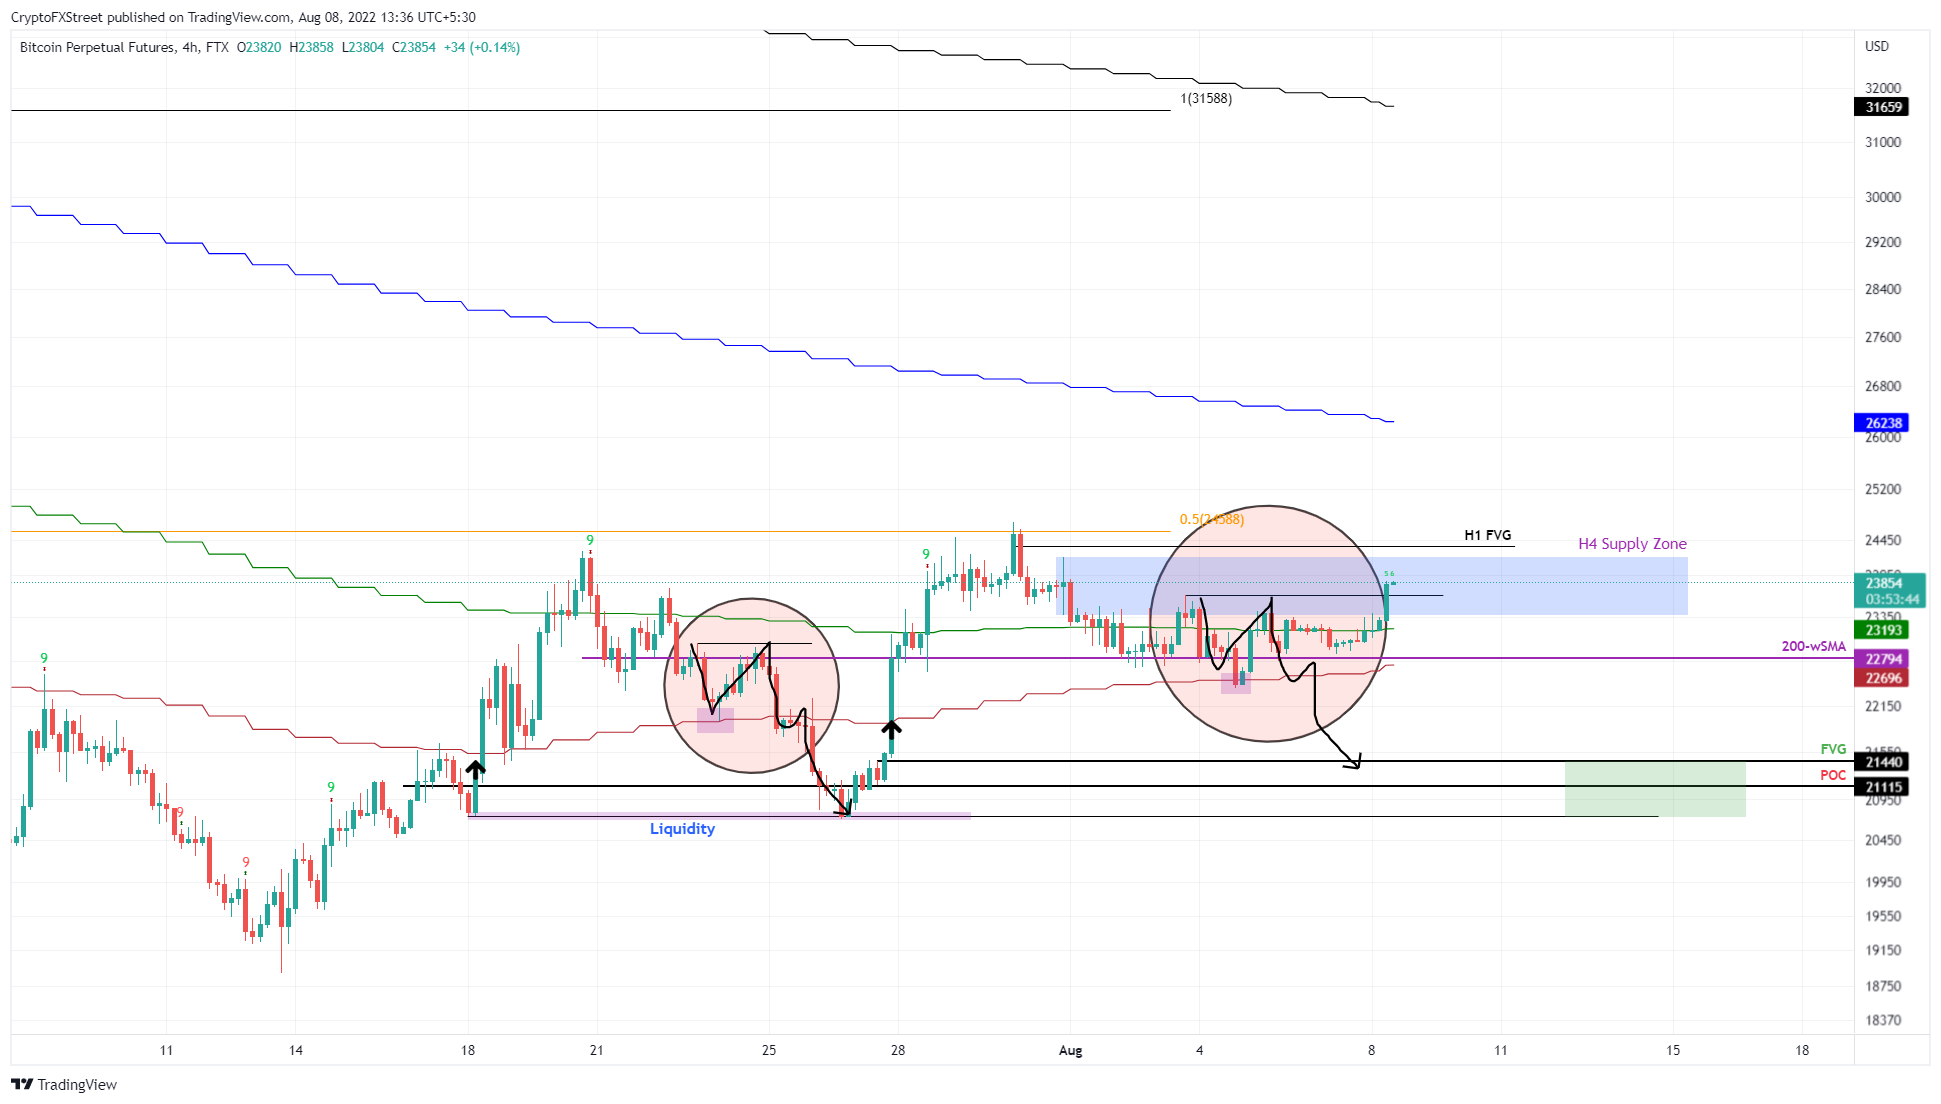
BTC/USDT 4-hour chart
Regardless of the bullishness, if BTC fails to move past the $24,362 level, it will indicate that the bearish outlook remains intact. In such a case, investors can expect Bitcoin price to return to the 200-week Simple Moving Average (SMA) at $22,794.
A breakdown of the 30-day Exponential Moving Average (EMA) at $22,694 will confirm the start of a bearish regime and open the idea of a crash to $21,440 and $21,115.
Ethereum price wants to test its strength
Ethereum price is trying to make a comeback and is currently retesting the $1,730 resistance level, which coincides with the 100-day EMA. This cluster of resistance levels is a make-or-break point for ETH, and a breakout will result in an explosive move to $2,147, aka the 200-day EMA.
This scenario, however, is heavily reliant on the price action of Bitcoin. If BTC bulls fail to push price past the $24,565 resistance level, it could undo this optimistic attempt.
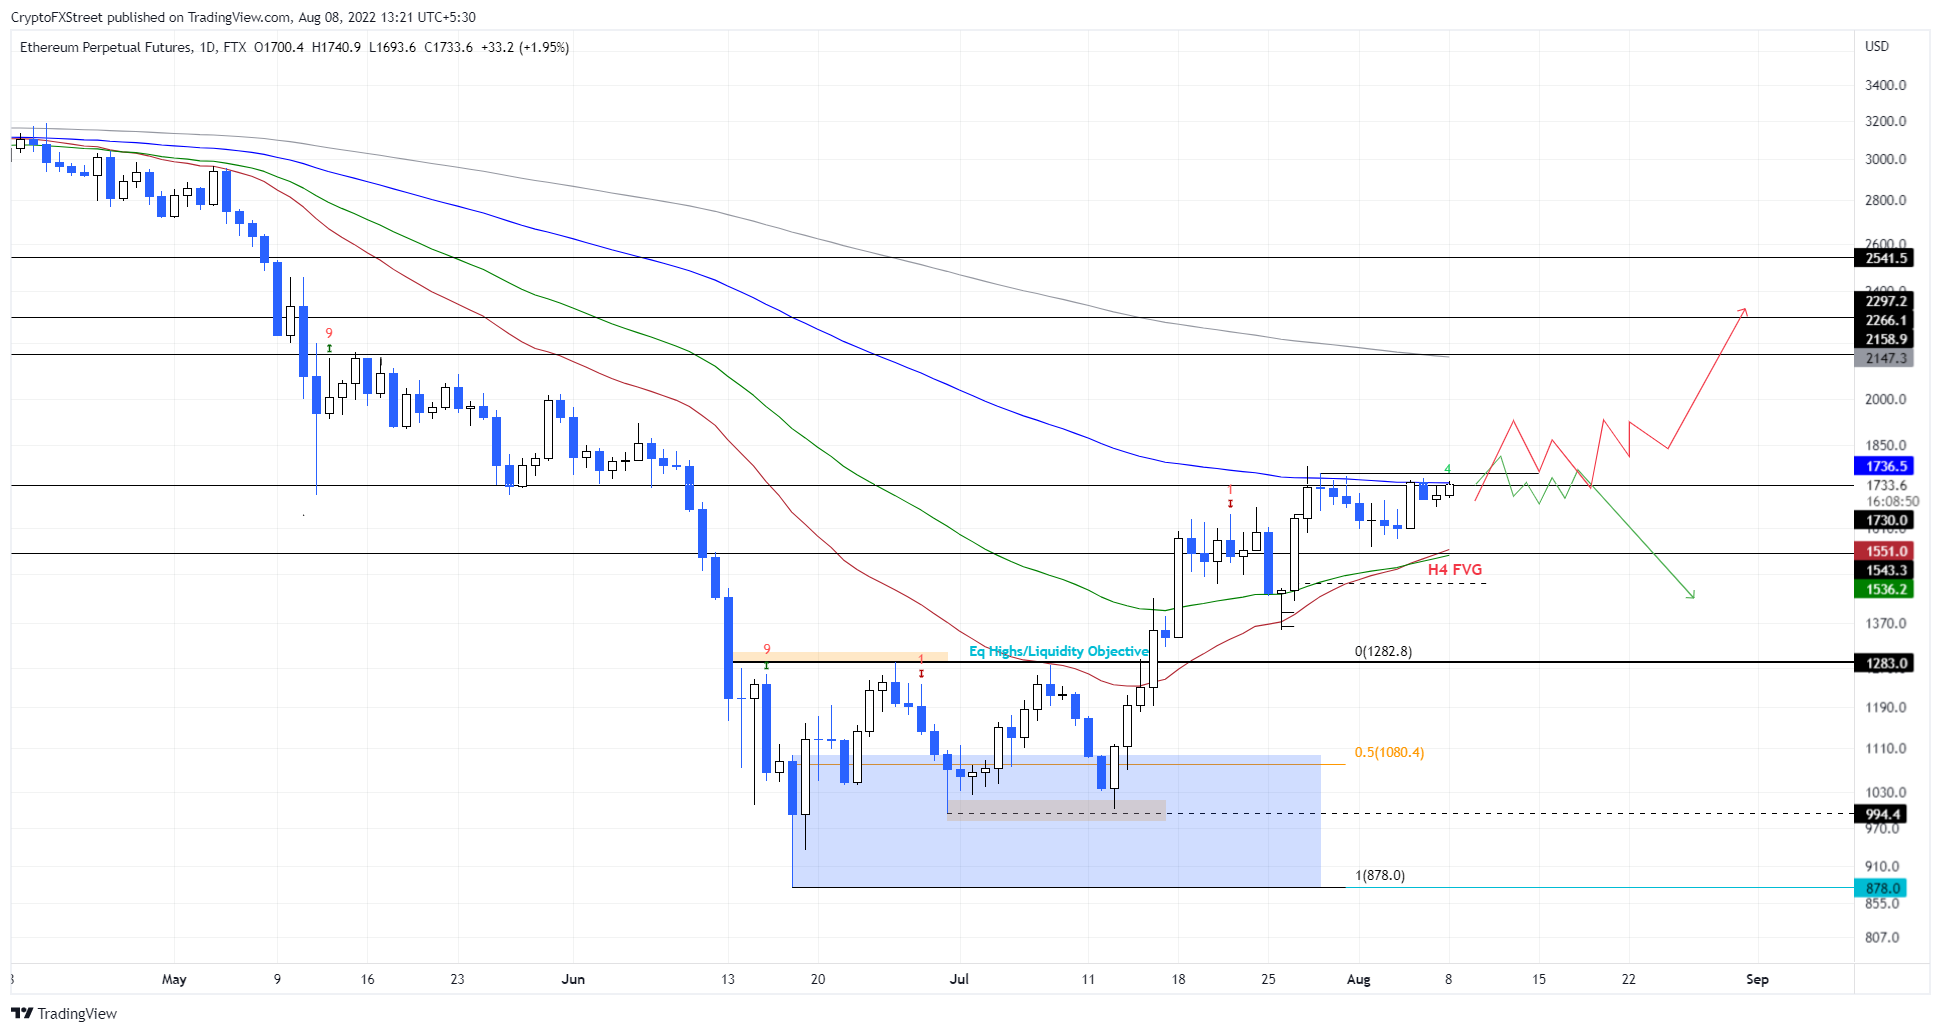
ETH/USDT 1-day chart
On the other hand, if Ethereum price gets rejected at $1,730 of its own accord or due to the influence of Bitcoin price, it will likely confirm the presence of bears. In such a case, ETH could slide lower and fill the four-hour price inefficiency at $1,446.
XRP price cements its next move
XRP price seems to be in a better position than ETH as it is above the 30-day and 50-day EMAs and shows potential to rally toward the 100-day EMA at $0.421. Therefore, investors must be prepared for an explosive 12% move.
This window to rally should be taken with a grain of salt since Bitcoin price could get rejected and reverse its trend, putting an end to the bullishness that is currently in the market.
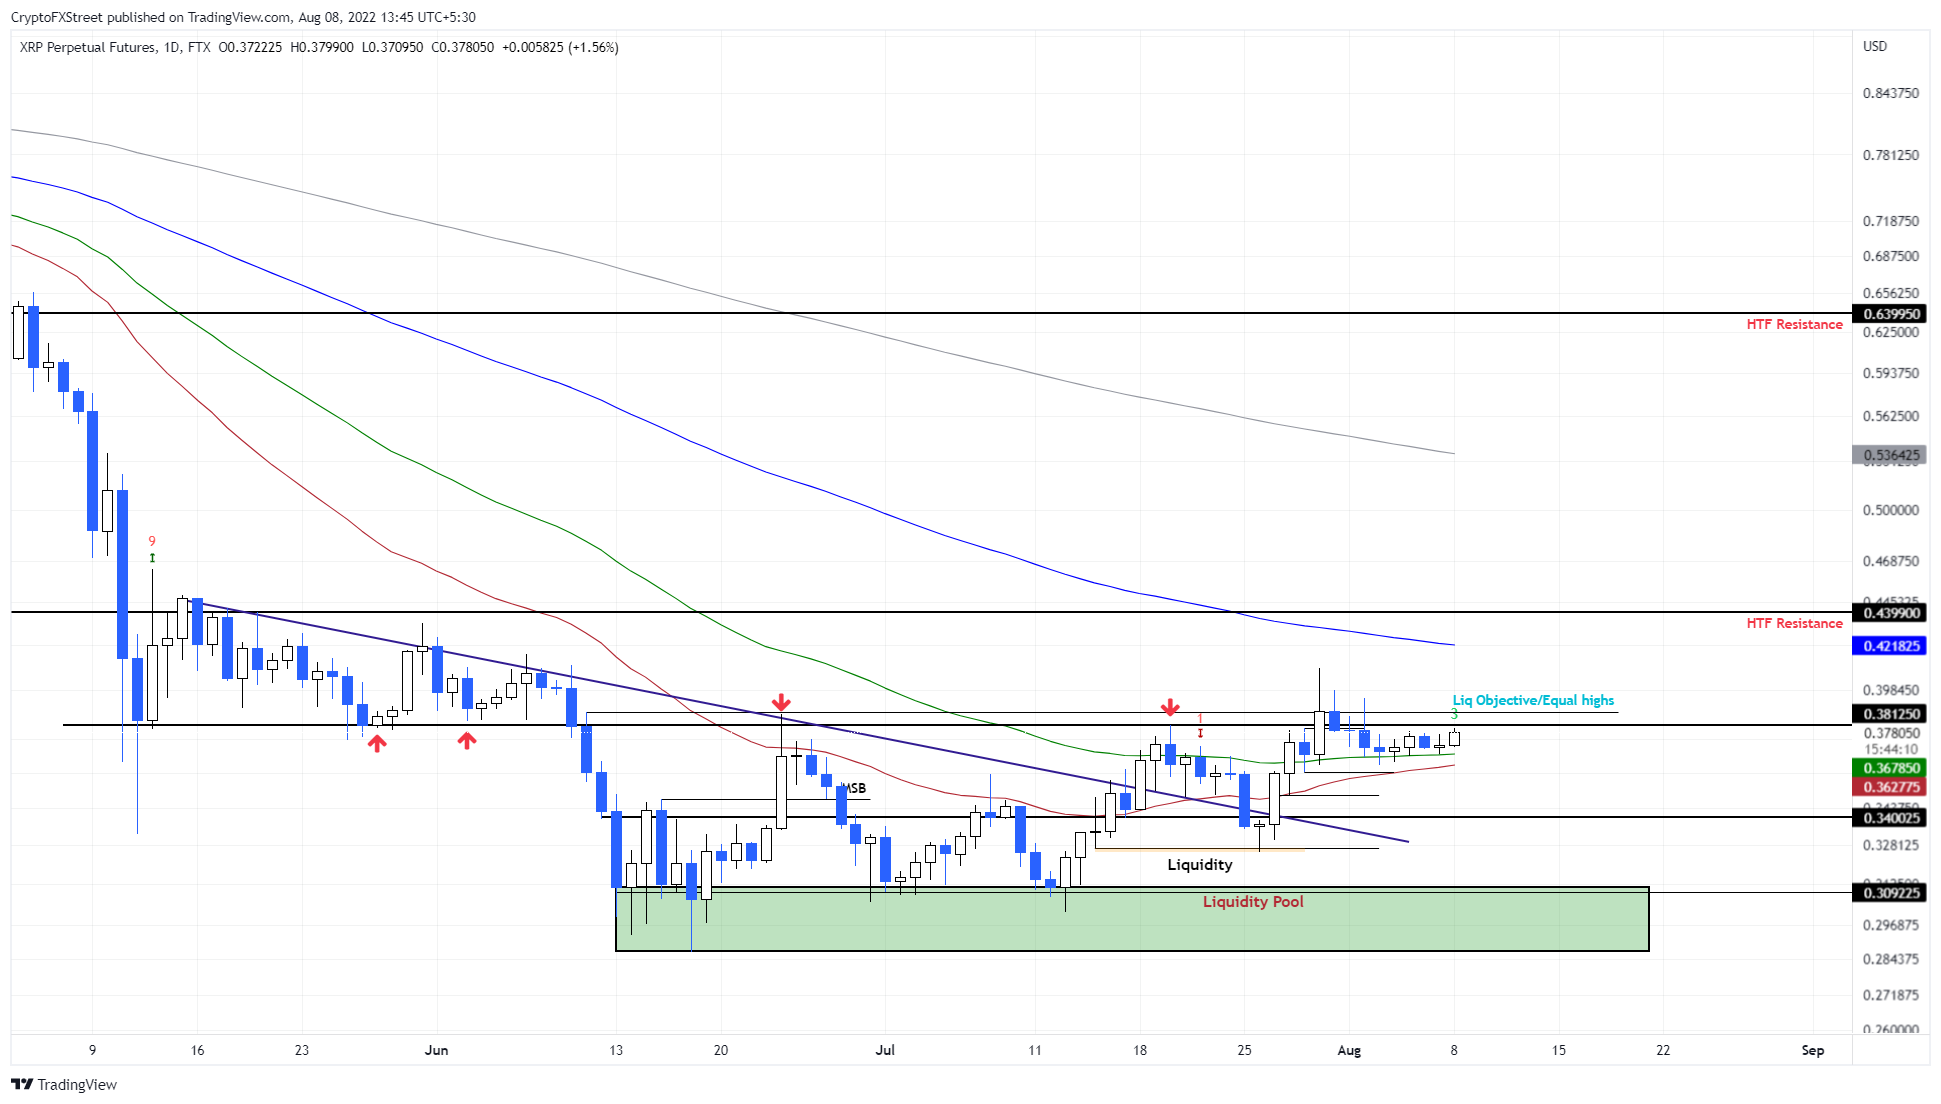
XRP/USDT 1-day chart
While things are looking up for XRP price, a rejection at the $0.381 resistance level will indicate that the bulls are weak and their dreams are likely to be left unfulfilled. A breakdown of the 30-day EMA at $0.362 will invalidate the bullish thesis and trigger a potential crash to $0.340.
Author

Akash Girimath
FXStreet
Akash Girimath is a Mechanical Engineer interested in the chaos of the financial markets. Trying to make sense of this convoluted yet fascinating space, he switched his engineering job to become a crypto reporter and analyst.


