Top 3 Price Prediction Bitcoin, Ethereum, Ripple: Ethereum in the pillory
- Market demands quick solutions to the Ethereum network as Ether lacks usability in its DeFi implementations.
- Cardano on the rise with the imminent implementation of the "Shelley" upgrade.
- Ripple continues on his path to disaster, at the expense of a measured move to pull it out of the hazardous moment.

Ethereum is the buzzword, although not for the positive reasons that prevailed until a few days ago. The drums started playing a tune that doesn’t sound well to the eternal prince of cryptocurrencies a few hours ago.
The high transaction costs in the Ethereum network and its high processing time are putting on the table the urgent need to implement the ETH 2.0 update as soon as possible.
Kevin Beardsley, Head of Business Development at Kraken Futures, makes clear in a tweet the limitations of the system:
My yield farming is off to a great start.
— kevin beardsley (@kevinhbeardsley) June 25, 2020
I have spent $14 on ETH gas fees to transfer/lock my $15 into @CurveFinance and I'm earning a princely $0.079 in weekly $SNX rewards.
I'll break even in just 177 short weeks! (not including gas to close contracts)
Some voices called for other projects with the ability to better respond to the DeFi (decentralized finance) segment to step forward and take over from Ethereum.
The impact of this change in sentiment towards Ethereum has impacted the ETH/BTC chart. As we will see in the analysis section of this pair, Ethereum has lost the upside scenario again, and the future is complicated by moving back below the upper trend line of the long-term triangle figure.
One of the candidates to take over is Cardano (ADA). With a market capitalization of just over two billion dollars, about ten times less than the Ethereum, Cardano expects to launch its "Shelley" update next month.
The upgrade will lead to the migration to the PoS (Proof of Stake) protocol and abandon the PoW (Proof of Work) system that it still shares with Ethereum or Bitcoin. Speed, scalability and network economy are Cardano's cards to try to endanger the hegemony of Ethereum as a platform for DeFi projects.
 (1)-637290185477200910.png)
The interest in Cardano is noticeable since March, then quoting at the price level of $0.022, and started an impressive escalation that has taken the price a 311% up to the current level at $0.08127.
The ADA/USD pair is close to a relative high of $0.09. The Directional Movement System indicator shows the importance of the current moment.
Bears and bulls are above the ADX line, which could help a violent exit in the direction of the winner of the showdown.
If the bears win, we can expect a quick move towards $0.10, while if the bears succeed, the target level would be $0.075.
ETH/BTC Daily Chart
The ETH/BTC pair is currently trading at the price level of 0.0245 after moving back into the long-term contractionary triangle. This move was the worst thing that could happen to Ethereum as it could return to the 0.022 level if not reversed quickly.
Above the current price, the first resistance level is at 0.0248, then the second at 0.025 and the third one at 0.026.
Below the current price, the first support level is at 0.0245, then the second at 0.0235 and the third one at 0.0225.
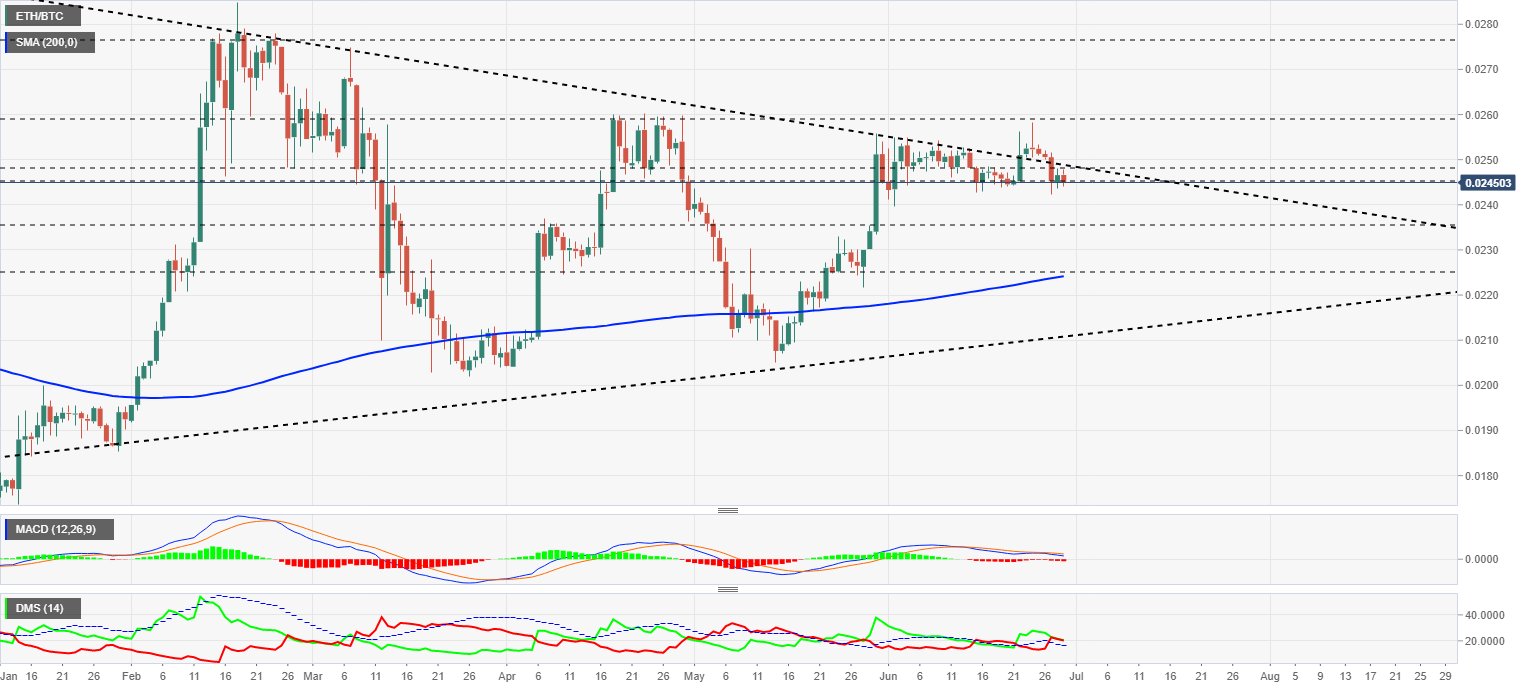
The MACD on the daily chart is sloping slightly downward but maintains a profile that is suitable for another bullish cross in the coming hours.
The DMI on the daily chart shows both sides of the market are in a tight spot to control the pair. Both sides of the market are moving above the ADX line, making it likely that a breakout from this impasse could be violent.
BTC/USD Daily Chart
The BTC/USD pair is currently trading at the price level of $9083 while playing dangerously close to the long-term bearish channel ceiling support. Bitcoin has no room below the current level if you want to avoid the lower bearish scenario, with possible targets in the $4000 area. The presence of the 200-day simple moving average in the $8400 zone would provide support, but we don't know if it would prevent a possible collapse of the price.
Above the current price, the first resistance level is at $9500, then the second at $10125 and the third one at $10400.
Below the current price, the first support level is at $8950, then the second at $8750 and the third one at $8360.
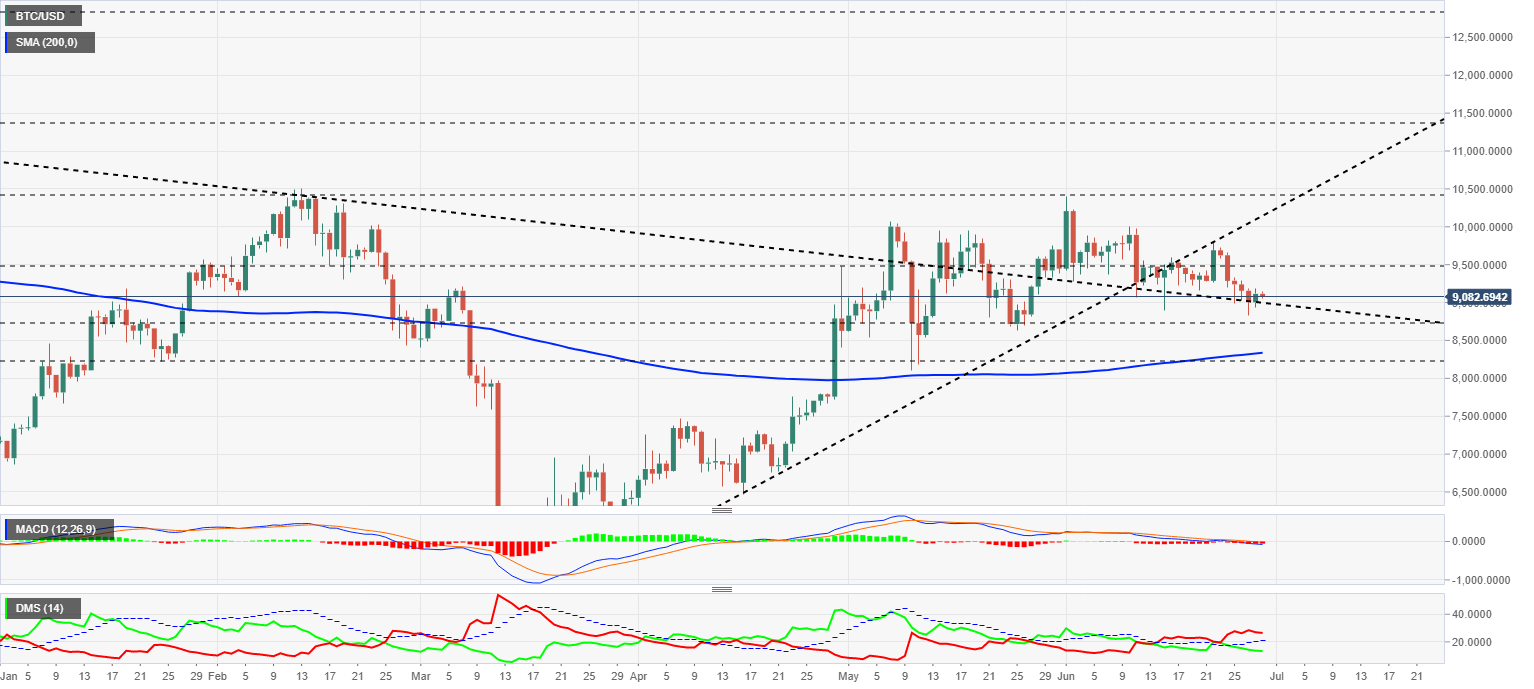
The MACD on the daily chart is piercing the zero level downward and is slightly penetrating the bearish territory. The current structure allows for an upward swing.
The DMI on the daily chart shows bears losing strength even though a bullish uptick does not match this. The buying side does not seem willing to take the lead in this pair.
ETH/USD Daily Chart
The ETH/USD pair is currently trading at $222.39 and is back in the lower half of its range. Below the current levels, the target is at the $200 level.
Above the current price, the first resistance level is at $235, then the second at $248 and the third one at $265.
Below the current price, the first support level is at $220, then the second at $200 and the third one at $190.
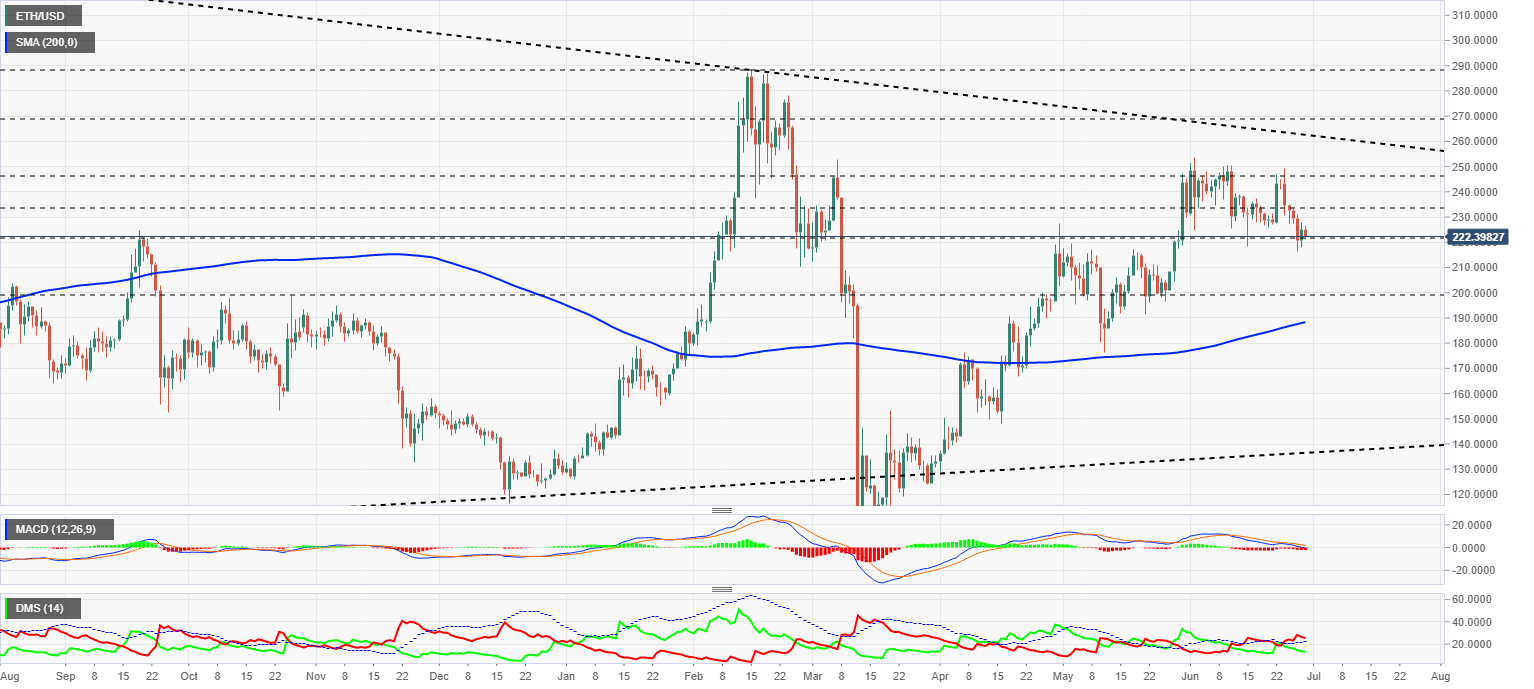
The MACD on the daily chart continues to cross downward as it reaches the zero level of the indicator. The ETH/USD pair now has a good chance of turning higher again, but if it fails to do so, we can expect a visit to the $200 level or lower.
The DMI on the daily chart shows the bearish momentum, although the bulls are not a danger given their high level of disinterest in disputing the ETH/USD pair.
XRP/USD Daily Chart
The XRP/USD pair is currently trading at $0.1759 and consolidates the new bearish scenario it entered early last week. The Ripple is technically in a very fragile situation, lacking support and without any expectations of improvement.
Above the current price, the first resistance level is at $0.185, then the second at $0.192 and the third one at $0.202.
Below the current price, the first support level is at $0.164, then the second at $0.14 and the third one at $0.113.
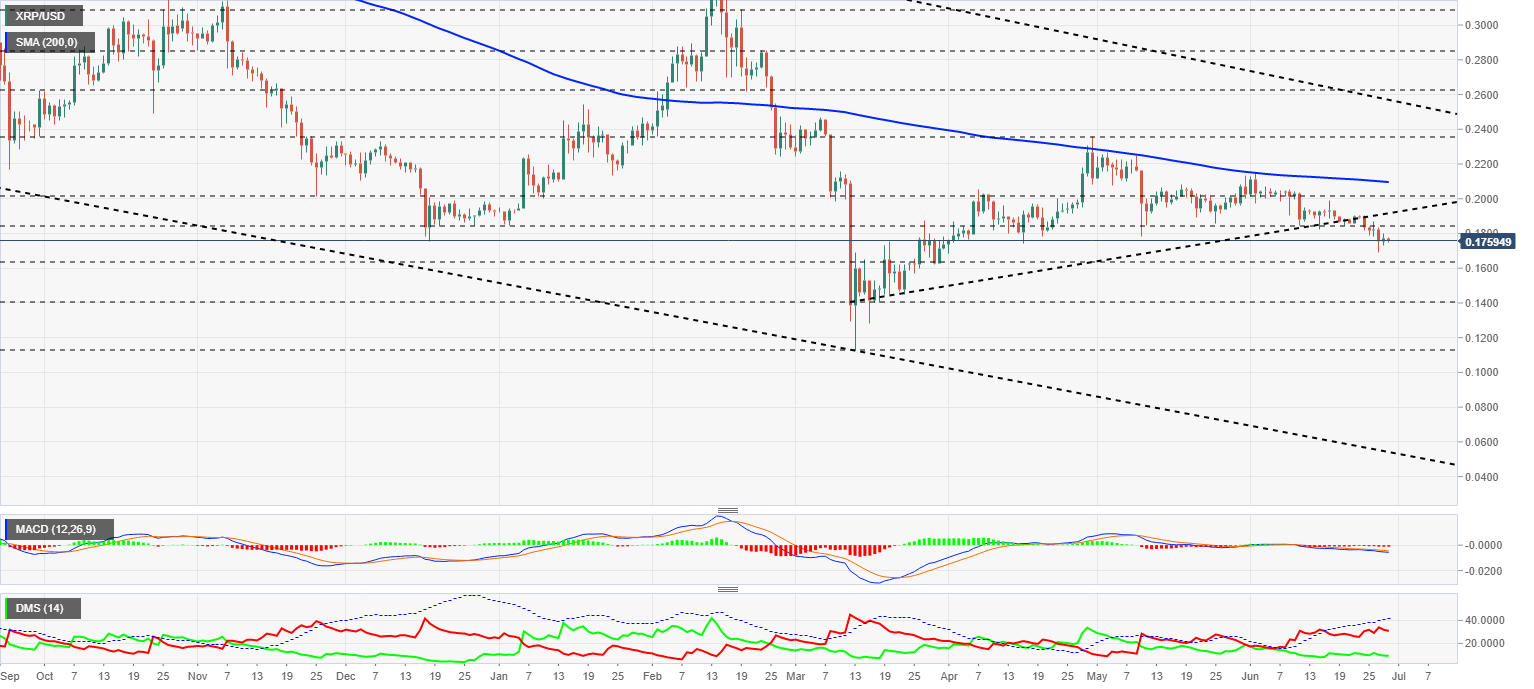
Below the current price, the first support level is at $0.164, then the second at $0.14 and the third at $0.113. The MACD on the daily chart is deepening the bearish zone of the indicator. It is also increasing both the slope and the opening between the lines. The most likely development is bearish.
The DMI on the daily chart shows bears maintaining their upward trend, while bulls remain at low levels and have no apparent intention of changing this scenario.
Author

Tomas Salles
FXStreet
Tomàs Sallés was born in Barcelona in 1972, he is a certified technical analyst after having completing specialized courses in Spain and Switzerland. He expanded his technical training following the guidance of great experts on the financial markets.


