Top 3 Price Prediction Bitcoin, Ethereum, Ripple: Ethereum bids to lead the way to the moon
- Ethereum takes over from Bitcoin and bets on increasing its market share beyond 10%.
- Bitcoin runs out of strength to face a scenario of multiple technical resistances.
- Ripple is still weak but could surprise on the upside in the next few days.

This week we started the crypto market coverage with Ethereum showing a lot of desire to take their part of the business.
Last week, Bitcoin took the lead, but it couldn't get above $10000 or enter a new level of dominance above 68%.
Ethereum sends a bullish signal to the market today and moves in the high range of the consolidation level of the last few days. The daily chart's ETH/USD cross shows a solid bullish pattern and validates the upward movement.
XRP shows once again that it is in other technical phase and barely improves a few cents and remains in the range of $0.20.
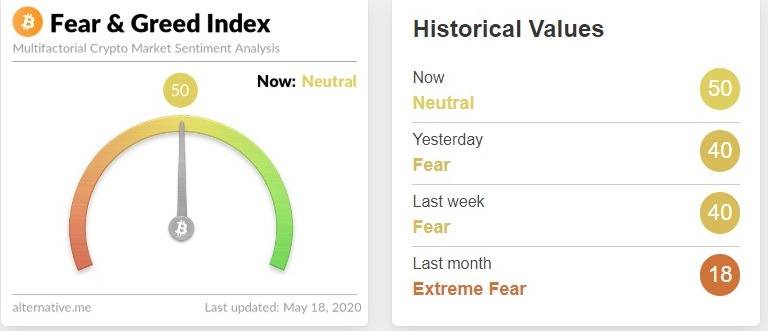
Source: alternative.me
The market sentiment level improves to the 50 levels (Neutral) as Ethereum sets to lead the next uptrend.
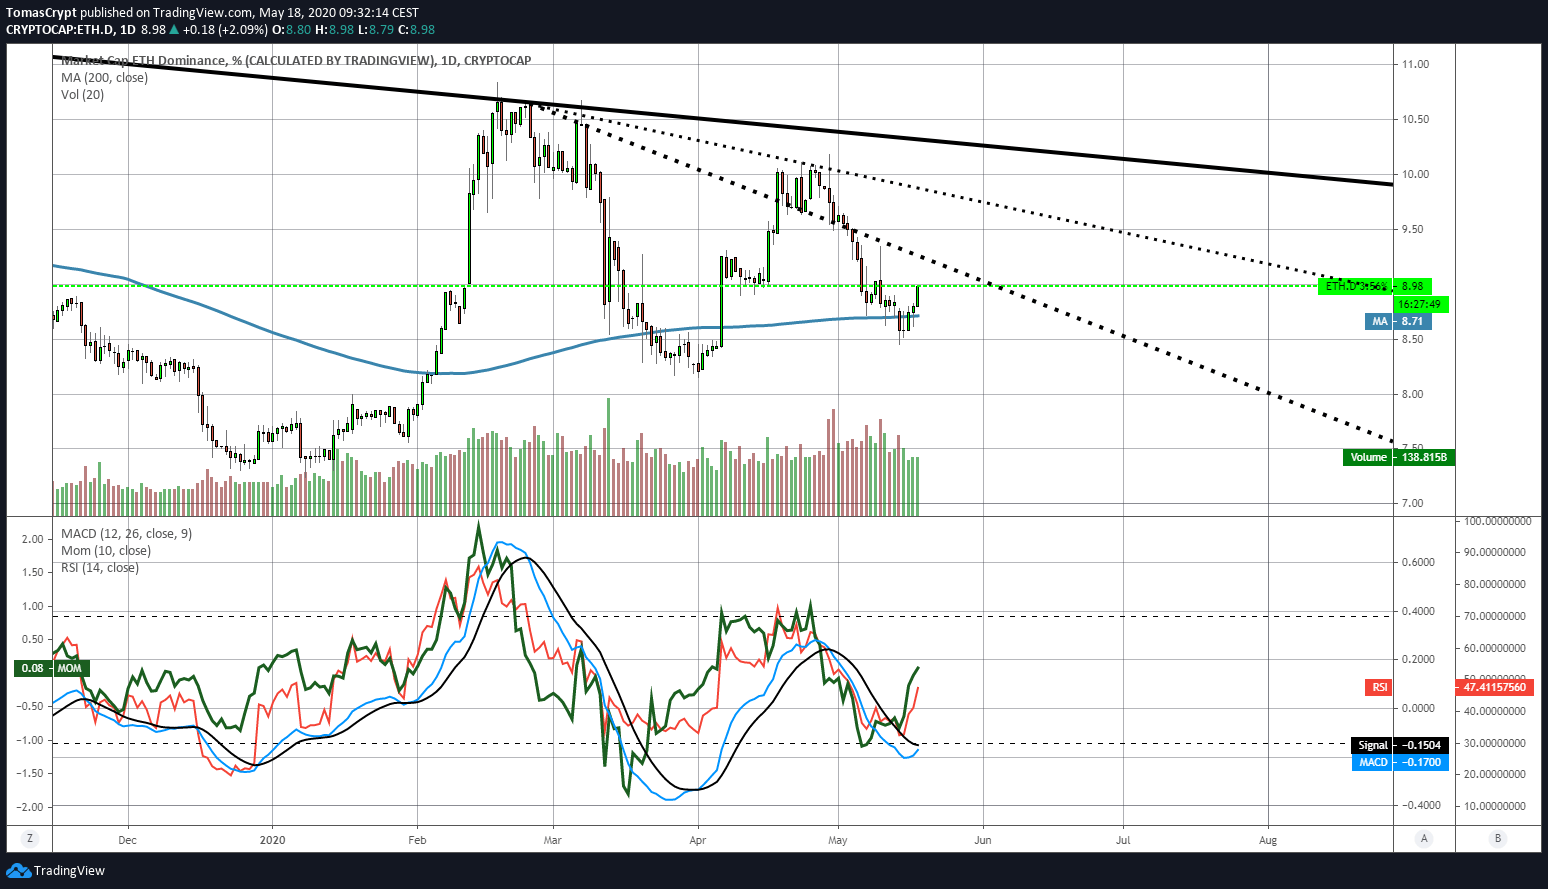
Ethereum's dominance chart reinforces the bullish scenario with a significant upward movement that takes it to the 8.97% market share level. Resistance to the advance is at 9.20%, then the second at 9.80% and the third at 10.3%.
ETH/BTC Daily Chart
The ETH/BTC pair is currently trading at the price level of 0.0219 and is trading above the 200-day simple moving average. The 100-day simple moving average and the 50-day exponential moving average extend their influence to the 0.024 level, so this is the first big hurdle to beat.
Above the current price, the first resistance level is at 0.022, then the second at 0.0228 and the third one at 0.024.
Below the current price, the first support level is at 0.0215, then the second at 0.0203 and the third one at 0.0196.
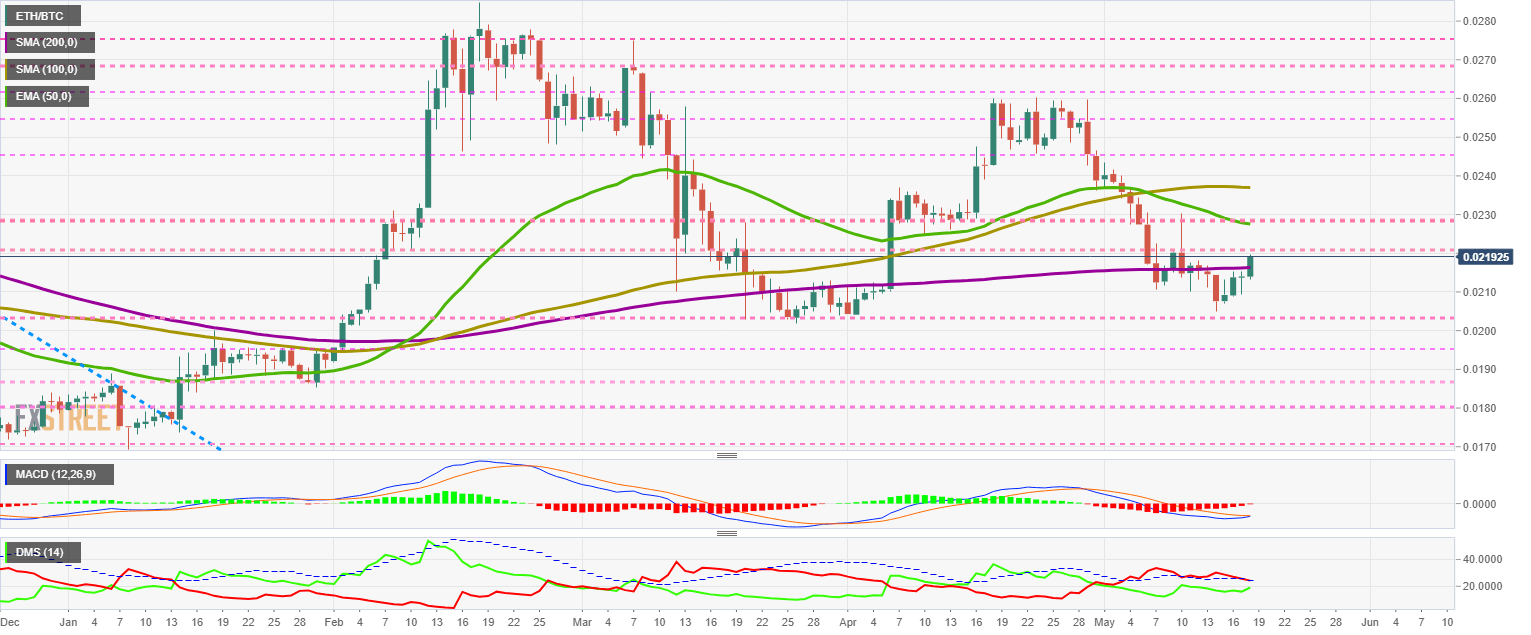
The MACD on the daily chart shows a bullish cross developing that needs an upbeat tone to continues to succeed.
The DMI on the daily chart shows the bulls losing support from the ADX line and disabling the bearish pattern. The bulls are rushing upwards and could take control of the pair in two days.
BTC/USD Daily Chart
The BTC/USD pair is currently trading at the price level of $9781 after failing to break above $10000 over the weekend. Bitcoin has very strong resistance up to the $11250 level and may need a break on the way. BTC/USD has been on a steady uptrend since early March.
Above the current price, the first resistance level is at $10000, then the second at $10300 and the third one at $10700.
Below the current price, the first support level is at $9700, then the second at $9200 and the third one at $8750.
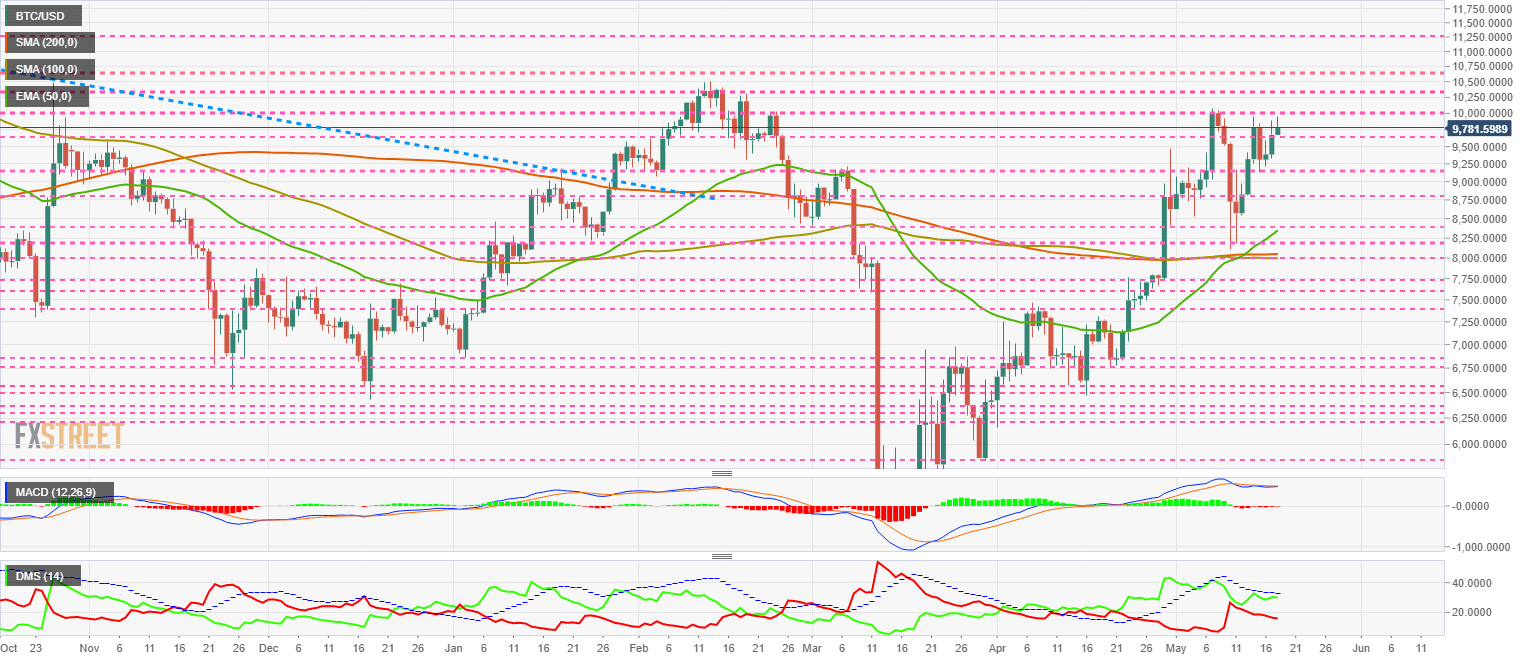
The MACD on the daily chart shows a structure typical of an overbought moment. The moving averages show a flat profile while the momentum remains at very favourable levels.
The DMI on the daily chart shows bulls unable to break the ADX line. Bears continue their slight downward trend for another day.
ETH/USD Daily Chart
The ETH/USD pair is currently trading at $214 and points to be the main attraction of the week. Ether has significant technical resistance beyond the $260 level.
Above the current price, the first resistance level is at $225, then the second at $230 and the third one at $238.
Below the current price, the first support level is at $208, then the second at $200 and the third one at $195.
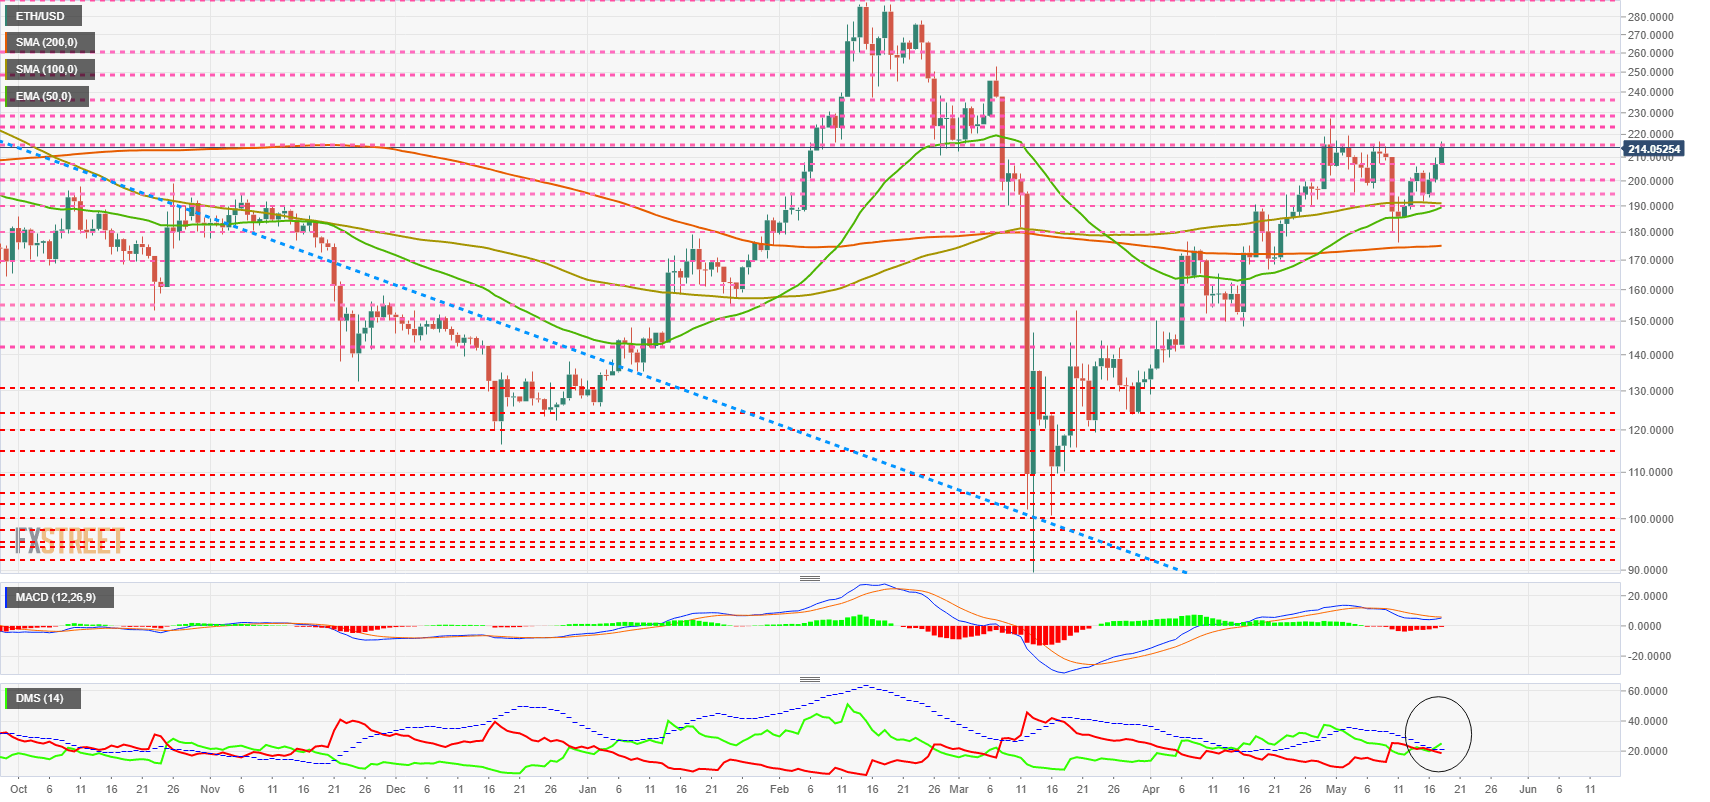
The DMI on the daily chart shows the activation of a bullish pattern, as the bulls are over the ADX line. Bears move down and repeat the mid-April structure.
XRP/USD Daily Chart
The XRP/USD pair is currently trading at $0.205 and is above the 50-day exponential moving average. The 100-day and 200-day simple moving averages continue to be very steep. The XRP needs to be above $0.25 to have a chance of turning around the current situation.
Above the current price, the first resistance level is at $0.214, then the second at $0.218 and the third one at $0.238.
Below the current price, the first support level is at $0.20, then the second at $0.19 and the third one at $0.17.
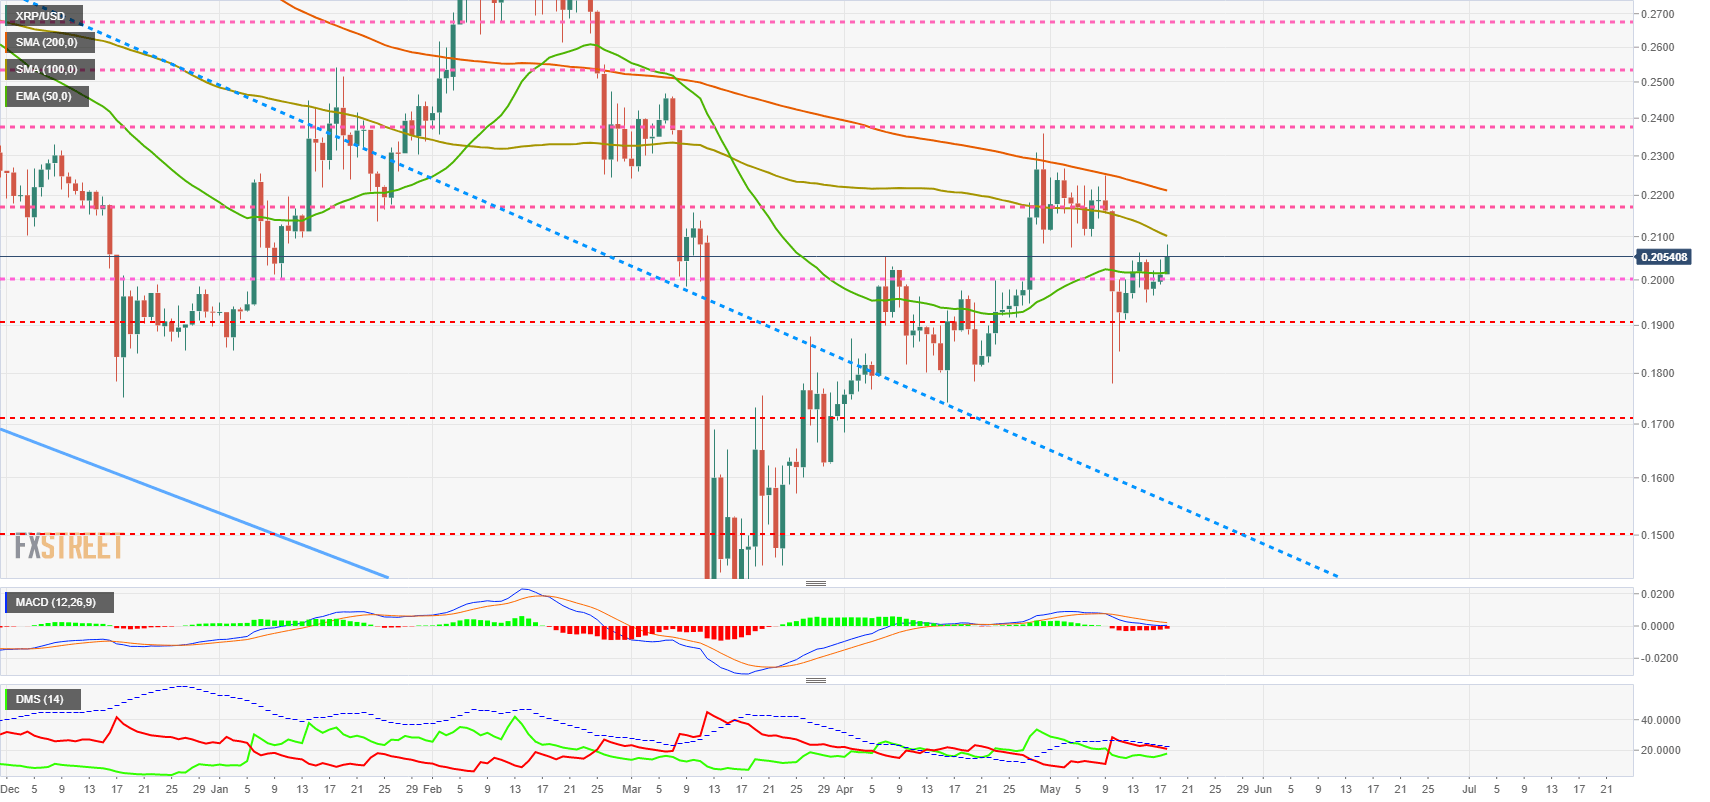
The MACD on the daily chart shows a bearish structure that reaches the neutral level of the indicator today. The MACD on the daily chart shows a bearish structure that reaches today's neutral level.
The DMI on the daily chart shows bears unable to break the ADX line. The bulls are moving fast upwards and could announce a bullish surprise in the coming days.
Author

Tomas Salles
FXStreet
Tomàs Sallés was born in Barcelona in 1972, he is a certified technical analyst after having completing specialized courses in Spain and Switzerland. He expanded his technical training following the guidance of great experts on the financial markets.


