Top 3 Price Prediction Bitcoin, Ethereum, Ripple: “Do or die” moment on the crypto board
- The sideways nature of the last few days has made the tension extreme; the charts have reached their limits.
- Mixed signals keep options open for Bitcoin and Ethereum.
- Sentiment level does not reflect possible risks in the short term.

The crypto board dawns today with the calm of the last few days, at least in appearance. It is apparent because there are signs that a sudden move could be in the making in the next few hours.
Bitcoin and Ethereum are still in the midst of a dominance dispute, while their prices against the US dollar are still in the attack zones of significant resistance. The tension is beginning to show up on the technical level, and scattered signals are appearing that could herald a resolution to the current status quo.
The dominance charts show a future scenario where there could be a change of trend that would favor Bitcoin, after several months where it has been Ethereum that has gained market share to all other cryptocurrencies.
In the case of Bitcoin, we could see an upward movement towards the 66.9% level, the level where the 200-day simple moving average runs.
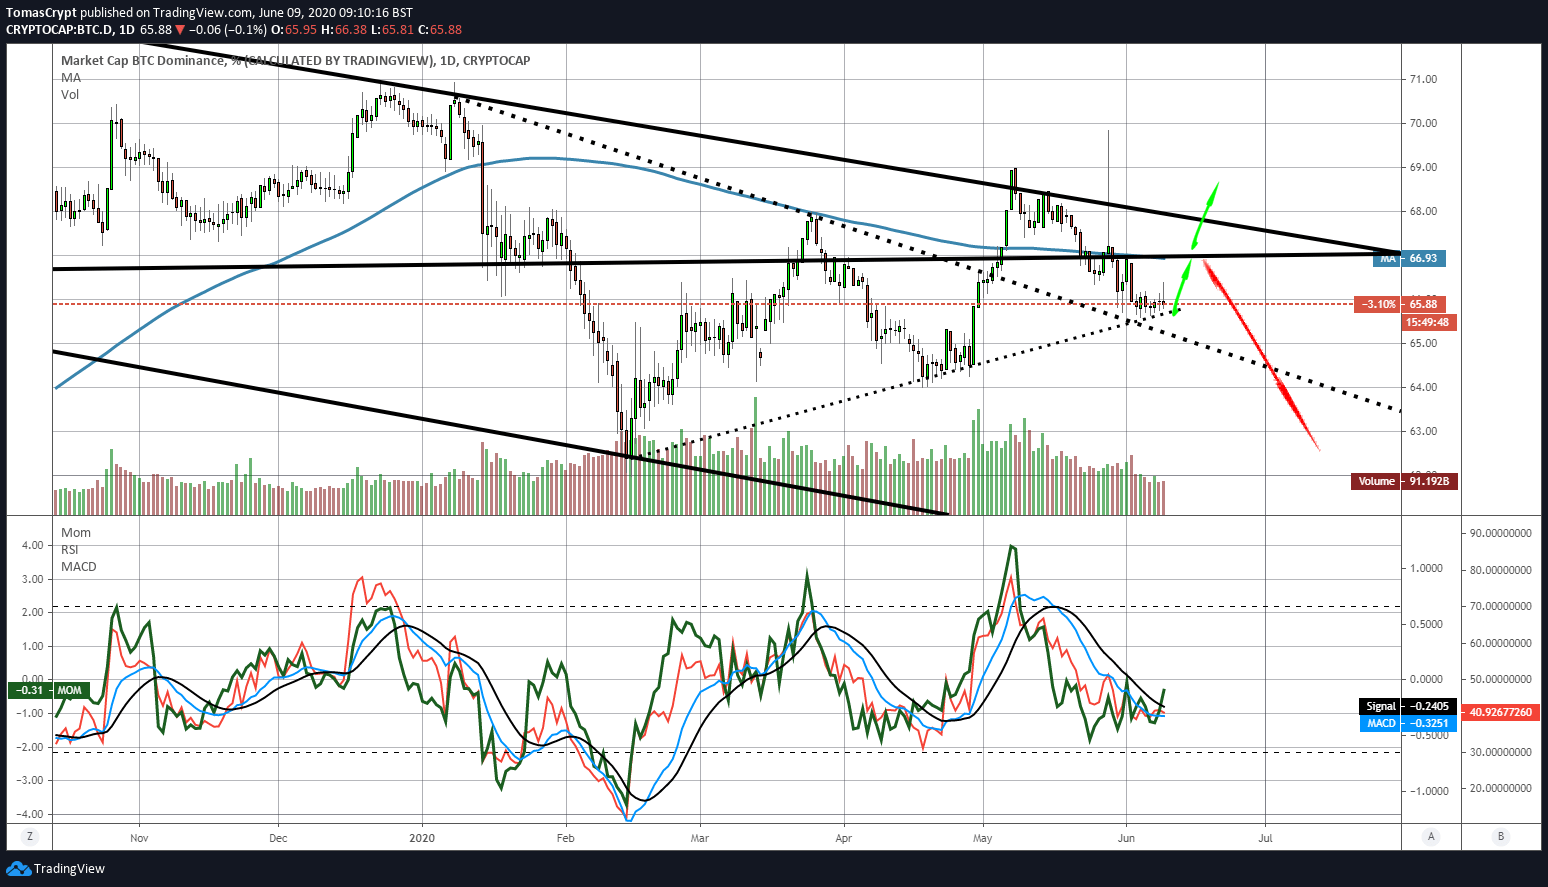
The odds are at 50% on a bullish development from there to the Bitcoin dominance chart or, a new downward trend that would now look for support in the lower sixties.
Ethereum's dominance chart shows the different structure and shows a high probability of falling to look for support at the 9.5 level first and then at the nine levels.
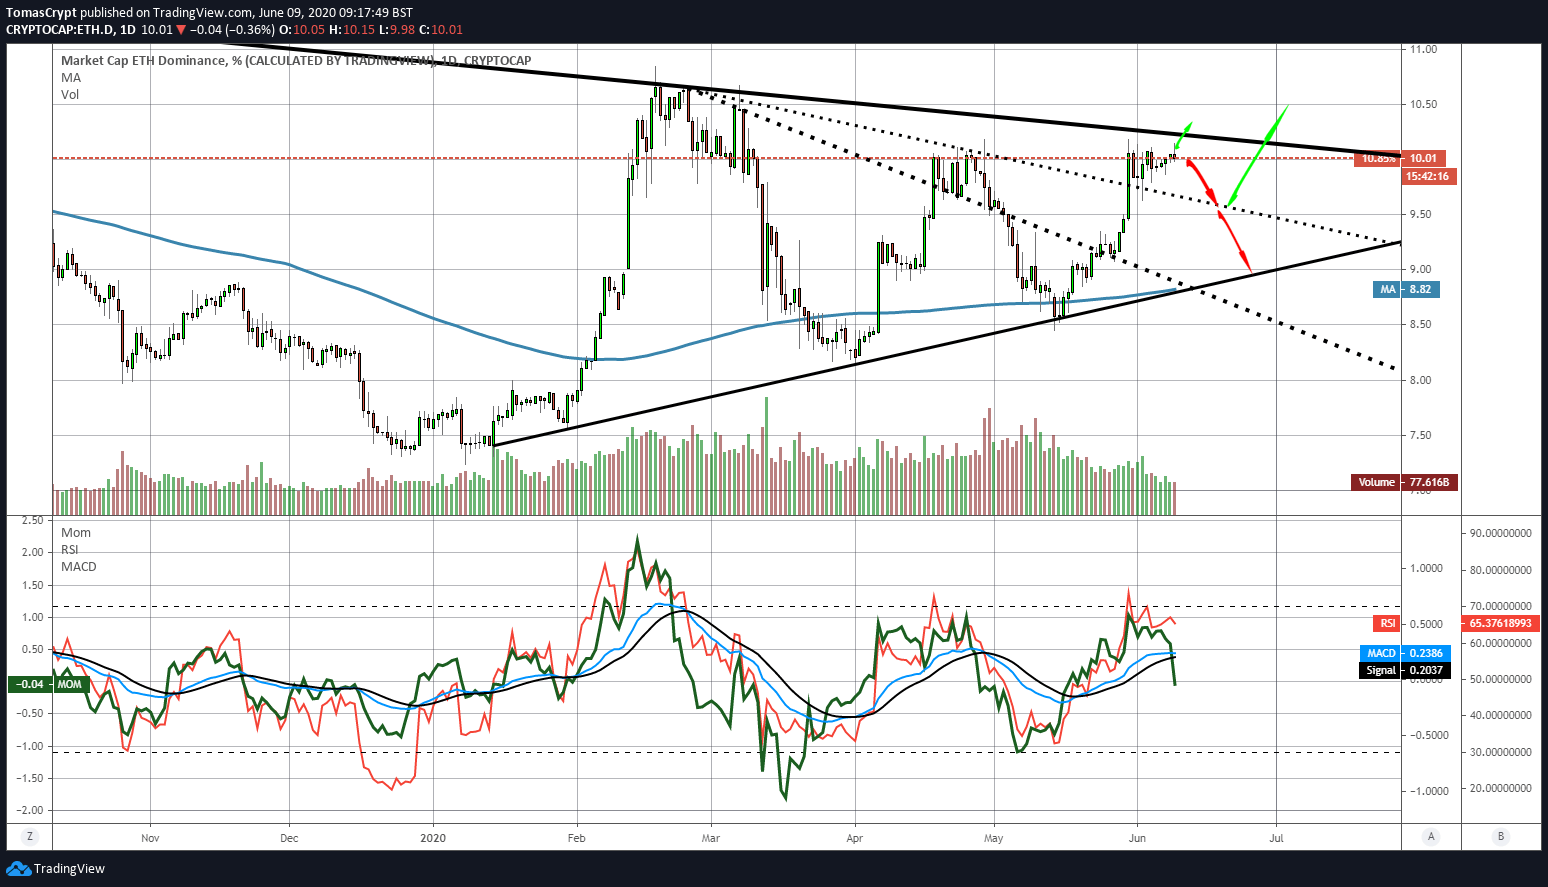
The ETH/BTC pair reflects the situation reliably, as we will see in the analysis below.
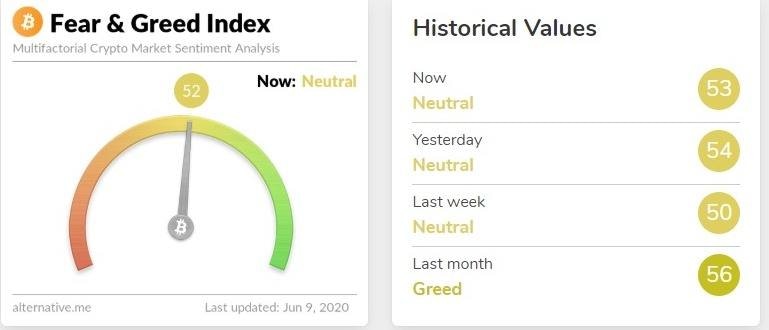
Source: alternative.me
The market sentiment level does not reflect the uncertainty on the technical level and is now trading at the 52 level, a positive zone within the neutral range.
ETH/BTC Daily Chart
The ETH/BTC pair is currently trading at the price level of 0.0251 and is just below the upper trendline of the triangle figure containing the price. An upward breakout could trigger a strong upward movement of the Altcoin segment.
Above the current price, the first resistance level is at 0.0254, then the second at 0.0258 and the third one at 0.0276.
Below the current price, the first support level is at 0.0248, then the second at 0.0235 and the third one at 0.0225.

The MACD on the daily chart shows a very ambiguous profile, which allows for development in any direction. Statistically, the most likely movement is downwards.
The DMI on the daily chart shows bulls surfing the ADX line in an attempt to save the bullish momentum and avoid missing the opportunity to break the triangle shape that compresses the ETH/BTC pair.
BTC/USD Daily Chart
The BTC/USD pair is currently trading at the $9672 price level and is down nearly 1% in the European session. The 200-day simple moving average is still at the $8000 price level, even very low after the significant rise since early March.
Above the current price, the first resistance level is at $10400, then the second at $11450 and the third one at $12820.
Below the current price, the first support level is at $9500, then the second at $9230 and the third one at $8750.

The MACD on the daily chart shows a slight downward profile, which is almost invisible but could indicate a future trend.
The DMI on the daily chart shows bulls trying to regain height and break the ADX line. The bears are approving of this attempt and are once again retreating to the downside after yesterday's climb.
ETH/USD Daily Chart
The ETH/USD pair is currently trading at $242.9 and presents many difficulties in achieving a daily close above the $246.5 price level. The primary bullish target is at the price level of $265, 10% above the current price.
Above the current price, the first resistance level is at $246.5, then the second at $265 and the third one at $270.
Below the current price, the first support level is at $234, then the second at $221 and the third one at $200.

The MACD on the daily chart retains the horizontal profile of the past few days, although a downward movement in the ETH/USD pair is becoming increasingly inevitable. Only a short-term upward reaction could break the current pattern.
The DMI on the daily chart shows bulls losing strength rapidly, while bears are gaining strength.
XRP/USD Daily Chart
The XRP/USD pair is currently trading at the price level of $0.2026 and extends by one day the consolidation of the $0.20 level where it has been since early April.
Above the current price, the first resistance level is at $0.213, then the second at $0.235 and the third one at $0.262.
Below the current price, the first support level is at $0.20, then the second at $0.19 and the third one at $0.18.

The DMI on the daily chart shows a bearish spike which could be due to a strange "ghost" downward movement being drawn today on the XRP/USD pair, but also on BCH/USD and ETC/USD.
Author

Tomas Salles
FXStreet
Tomàs Sallés was born in Barcelona in 1972, he is a certified technical analyst after having completing specialized courses in Spain and Switzerland.


