Top 3 Price Prediction Bitcoin, Ethereum, Ripple: Cryptos take a break to rethink directional bias


  • Bitcoin price rejection at the $42,867-to-$43,755 bearish breaker suggests a continuation of the downtrend.
  • Ethereum price could start its retracement as the MRI shows a sell signal on the daily chart.
  • Ripple price looks ready for a minor retracement as it retests the first hurdle at $0.85.

Bitcoin price is facing blockades, pausing its uptrend and even reversing it. This sudden lack of momentum has allowed bears to take control. As a result, Ethereum, Ripple and other altcoins are also undergoing minor retracement.

Bitcoin price needs a breather

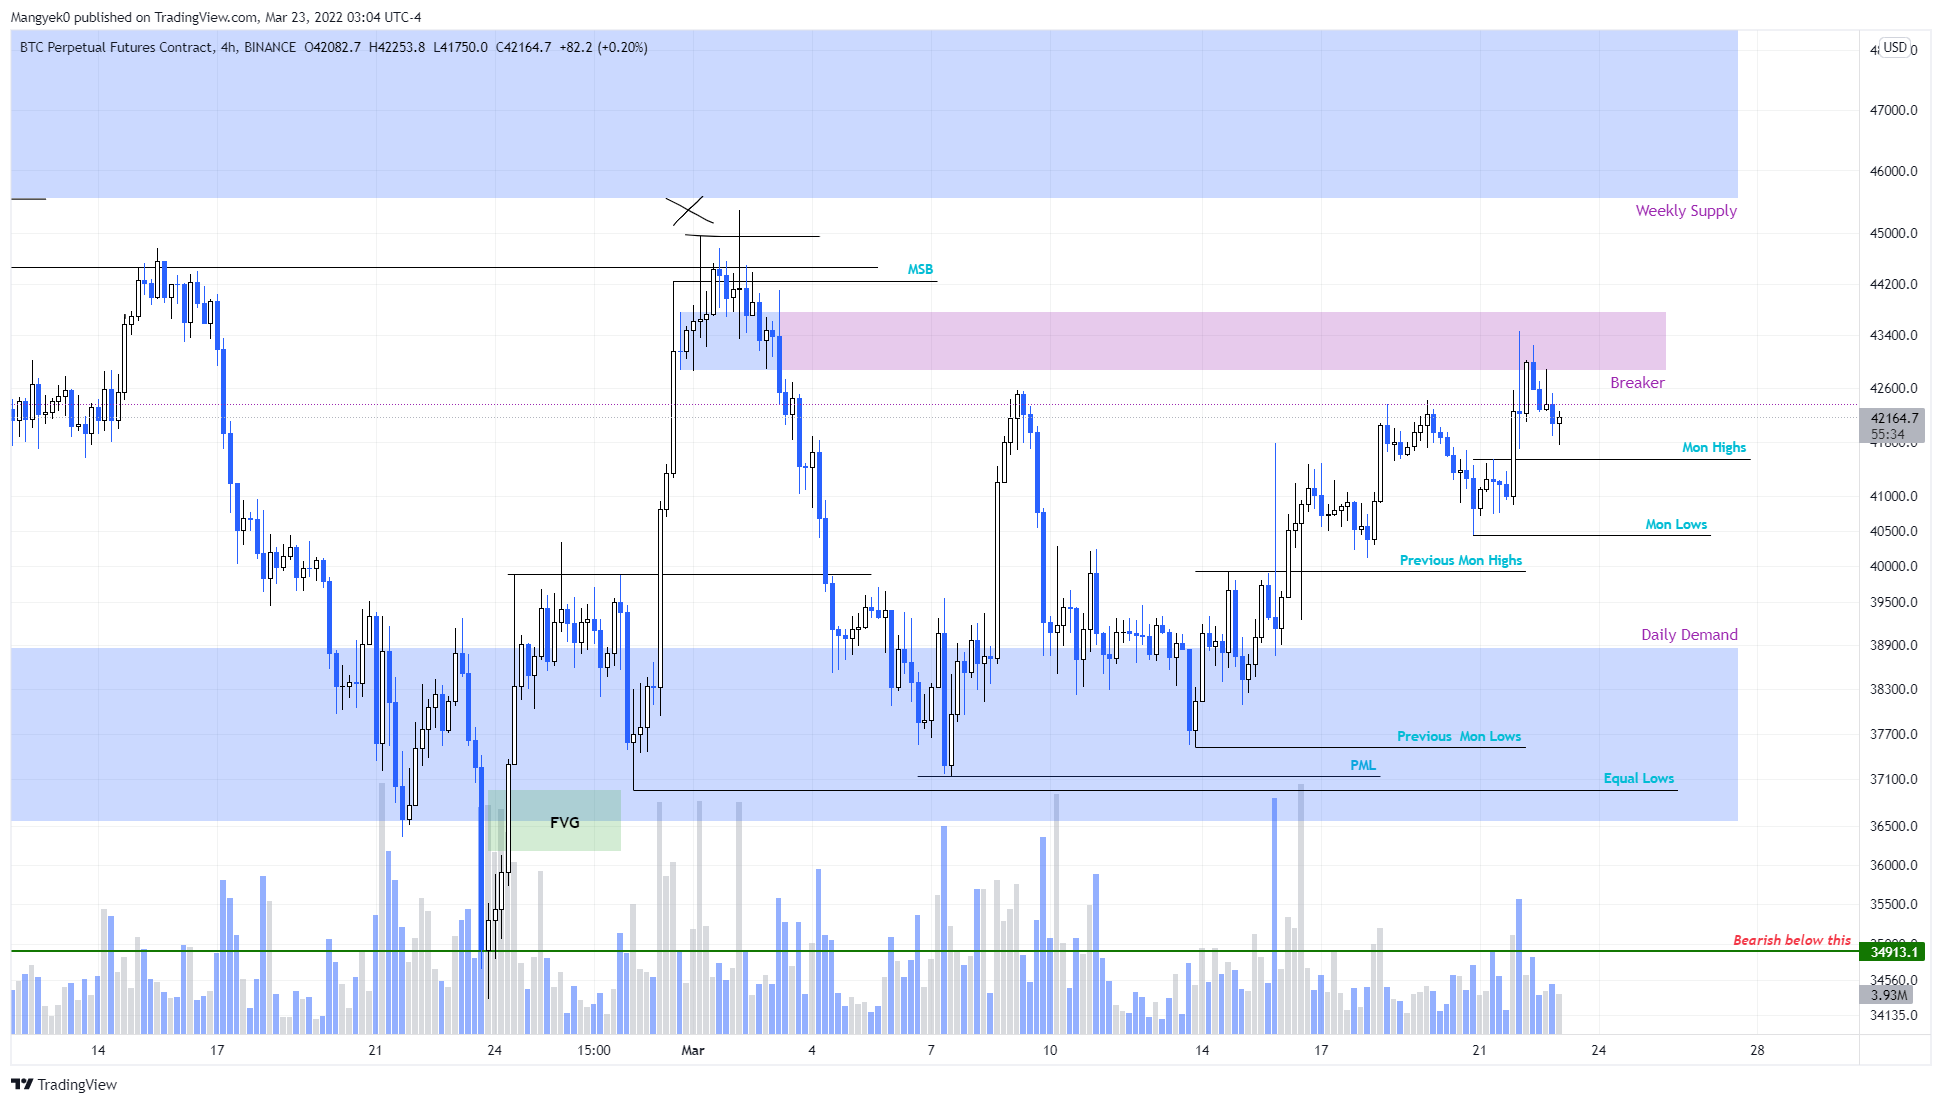
Bitcoin price has been on a slow and steady uptrend since March 13, rallying roughly 15%. This move tagged the four-hour breaker, extending from $42,867 to $43,755, and is already getting rejected.

Investors can expect a continuation of this downswing at least until $40,417, Monday‘s low. In some cases, BTC might even retest the daily demand zone, ranging from $36,562 to $38,859. 

BTC/USD 4-hour chart

BTC/USD 4-hour chart

While things are looking up for Bitcoin price, a four-hour candlestick close above $43,755 will invalidate the bearish breaker and open the path for further gains. 

Ethereum price looks toppy

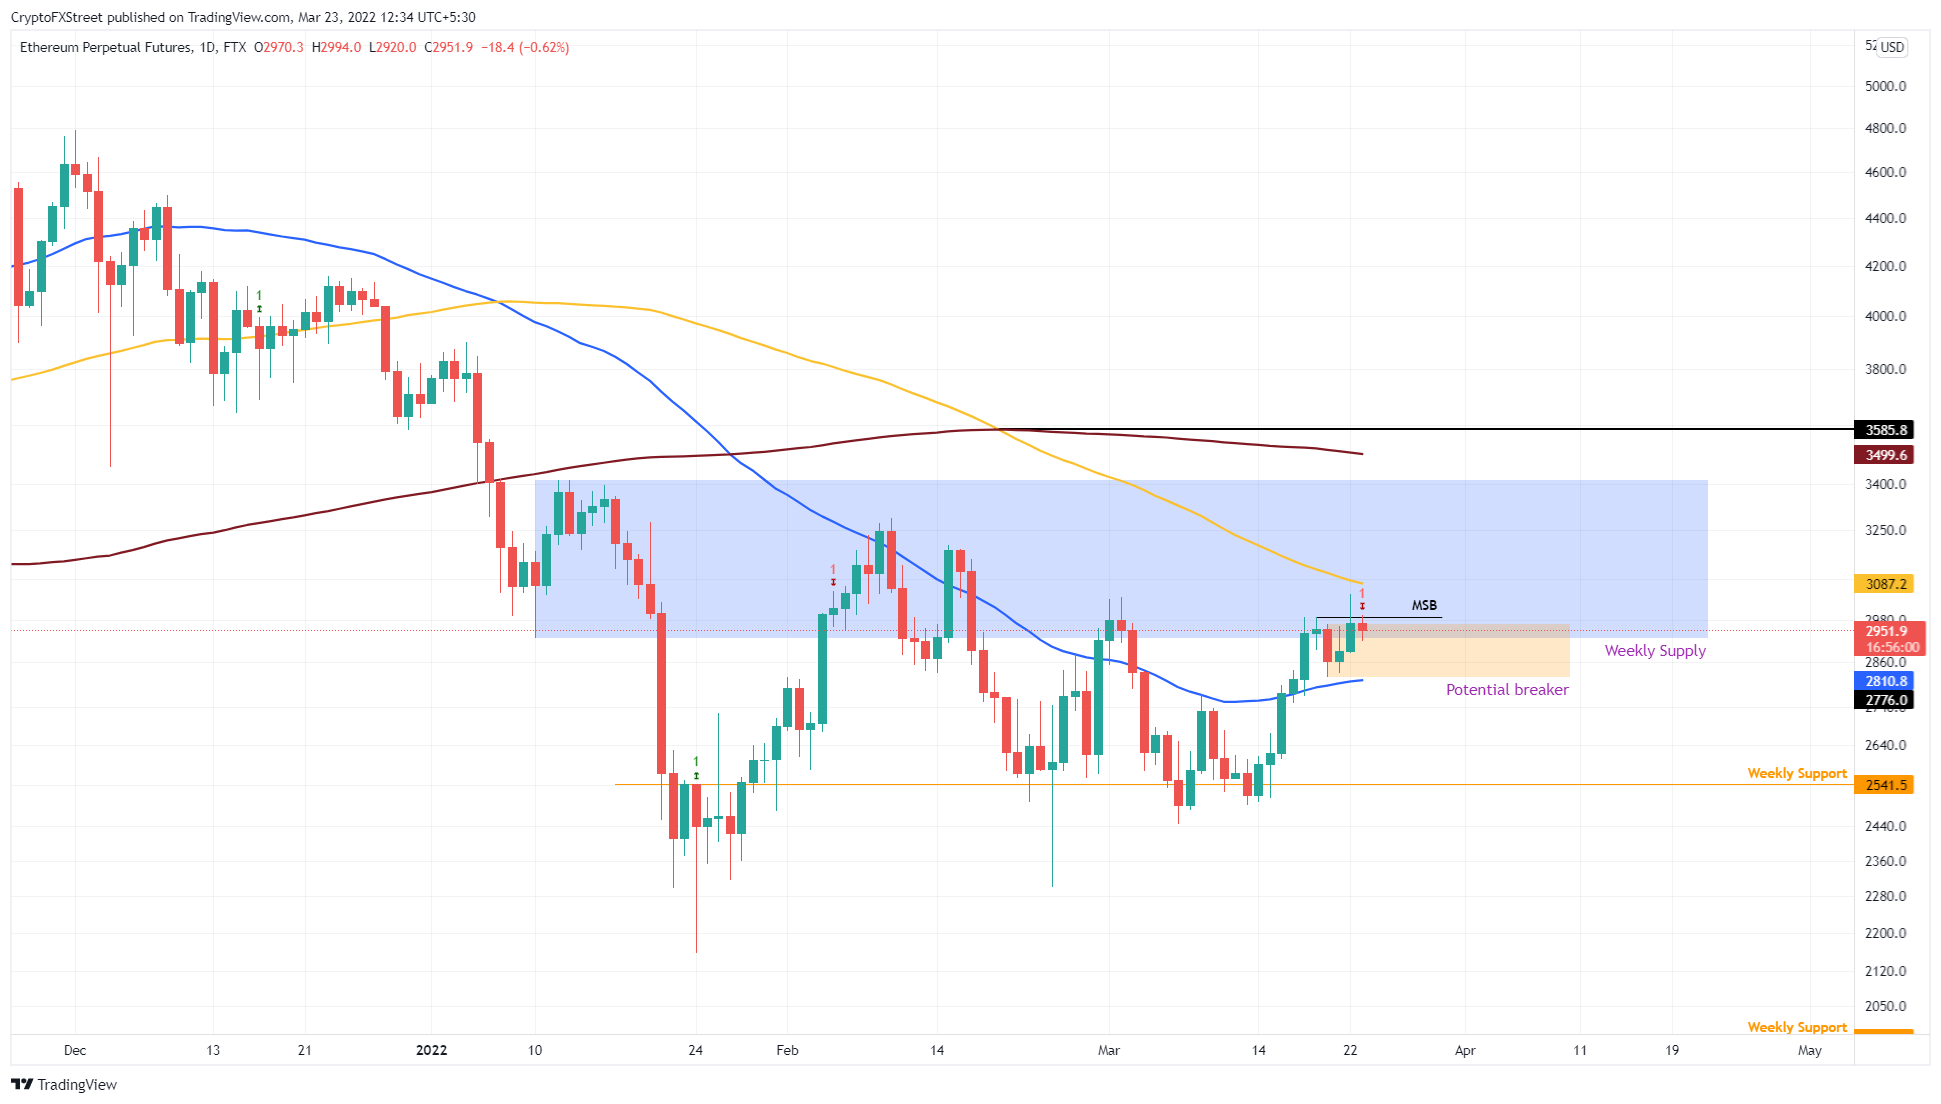
Ethereum price pierced the weekly supply zone, extending from $2,927 to $3,413, and failed to move higher. This lack of buying pressure combined with the Momentum Reversal Indicator (MRI)’s red ‘one’ sell signal indicates that an uptrend is unlikely.

This technical formation forecasts a one-to-four candlestick downtrend for ETH. Therefore, investors can expect ETH to revisit the weekly support level at $2,541 soon.

ETH/USD 1-day chart

ETH/USD 1-day chart

Regardless of the optimism surrounding the upcoming Merge for Ethereum price, a weekly close below $2,541 will invalidate the bullish thesis and trigger a correction to $2,000 or lower.

Ripple price remains bullish 

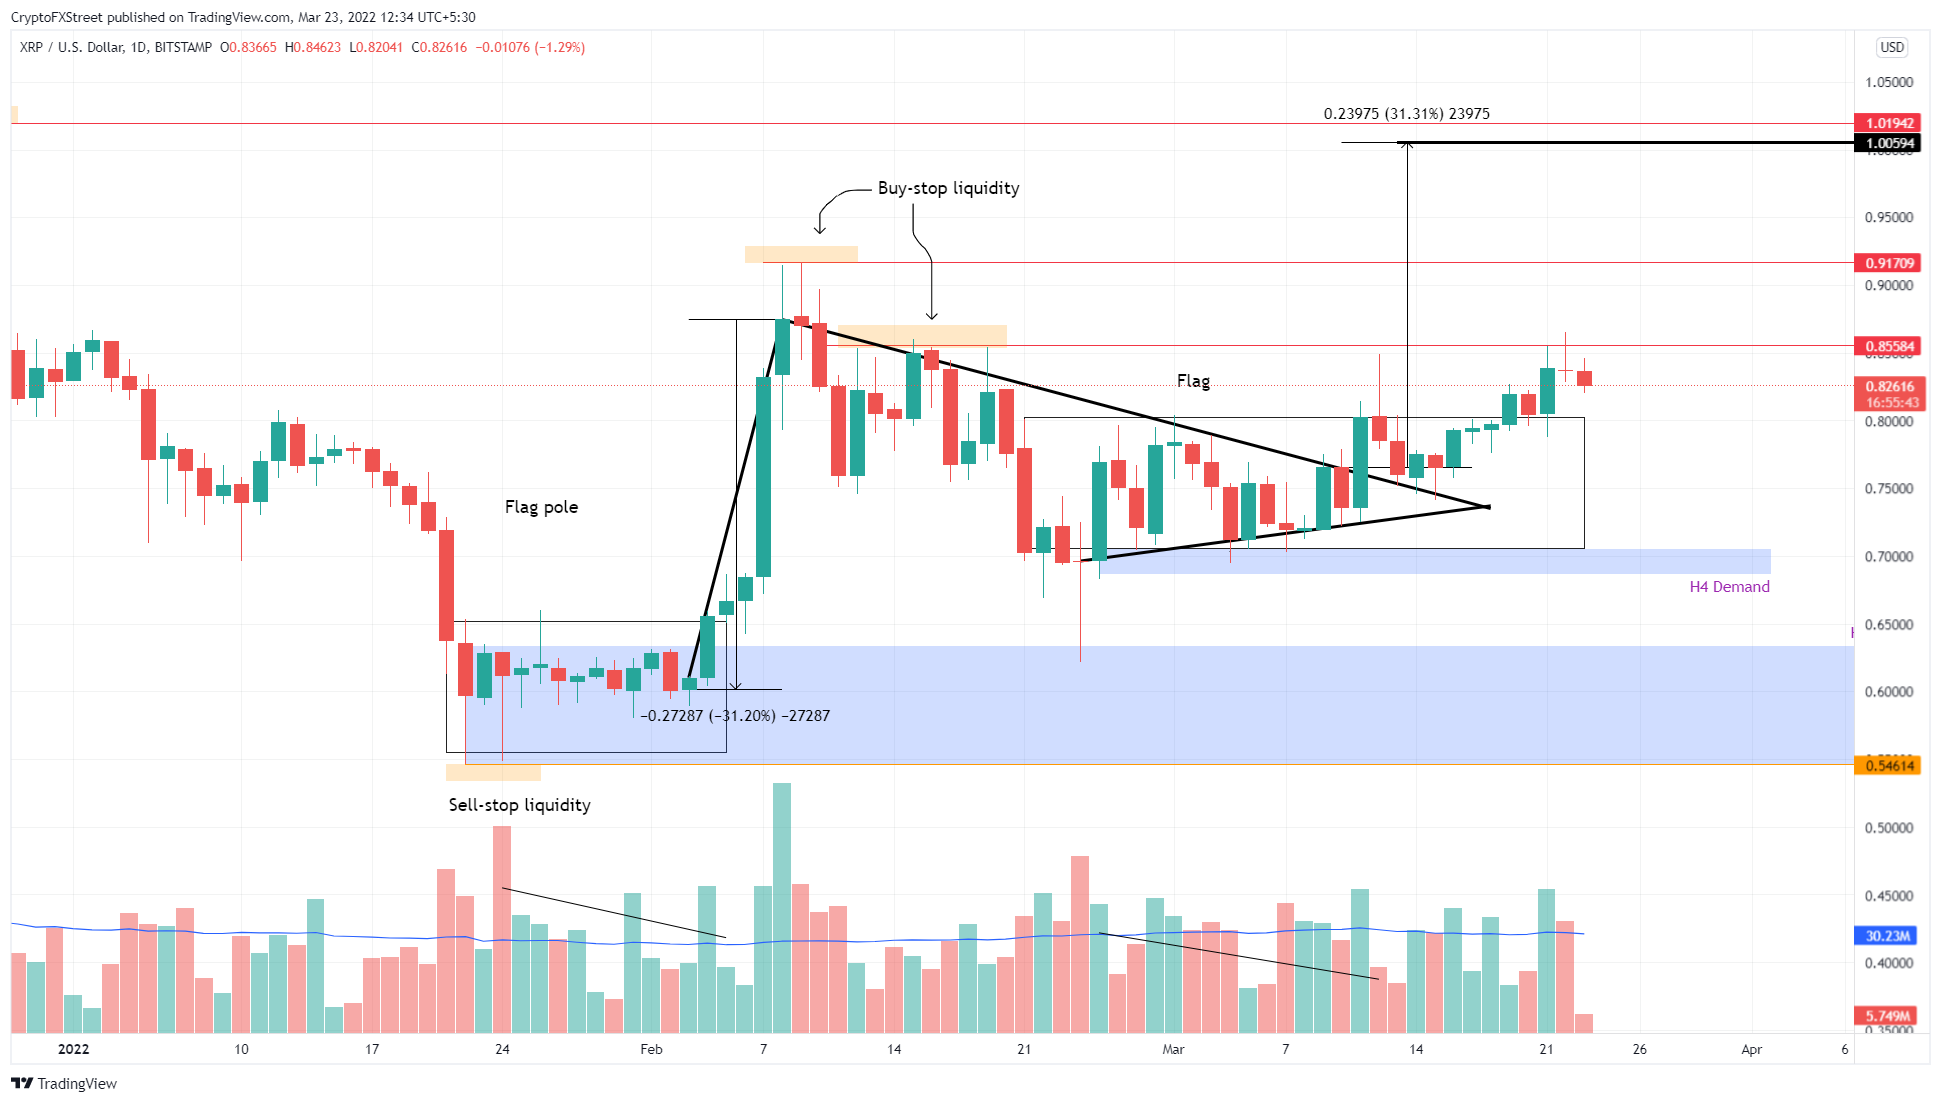
Ripple price enjoyed gains for the better part of last week when most altcoins were struggling to move higher or experiencing losses. However, after a 16% ascent and retesting the first target at $0.85, XRP price is experiencing a slowdown. 

While the bullish thesis is intact, investors can expect the remittance token to slide lower and retest the $0.80 or $0.76 barrier before triggering another leg-up to $0.91 and $1.00.

XRP/USD 1-day chart

XRP/USD 1-day chart

As optimistic as Ripple price might seem, the bullish thesis will face invalidation if the four-hour demand zone, extending from $0.68 to $0.70, is breached. While this move would put an end to the short-term uptrend, it doesn’t invalidate the long-term bullish thesis for Ripple.

XRP bulls have another opportunity at the nine-hour demand zone, ranging from $0.546 to $0.633, to give the uptrend another go and recover the losses.


Information on these pages contains forward-looking statements that involve risks and uncertainties. Markets and instruments profiled on this page are for informational purposes only and should not in any way come across as a recommendation to buy or sell in these assets. You should do your own thorough research before making any investment decisions. FXStreet does not in any way guarantee that this information is free from mistakes, errors, or material misstatements. It also does not guarantee that this information is of a timely nature. Investing in Open Markets involves a great deal of risk, including the loss of all or a portion of your investment, as well as emotional distress. All risks, losses and costs associated with investing, including total loss of principal, are your responsibility. The views and opinions expressed in this article are those of the authors and do not necessarily reflect the official policy or position of FXStreet nor its advertisers. The author will not be held responsible for information that is found at the end of links posted on this page.

If not otherwise explicitly mentioned in the body of the article, at the time of writing, the author has no position in any stock mentioned in this article and no business relationship with any company mentioned. The author has not received compensation for writing this article, other than from FXStreet.

FXStreet and the author do not provide personalized recommendations. The author makes no representations as to the accuracy, completeness, or suitability of this information. FXStreet and the author will not be liable for any errors, omissions or any losses, injuries or damages arising from this information and its display or use. Errors and omissions excepted.

The author and FXStreet are not registered investment advisors and nothing in this article is intended to be investment advice.

Join Telegram

Recommended content


Recommended Content

Editors’ Picks

Ripple wipes out weekly gains, experts comment on role of Ripple stablecoin

Ripple wipes out weekly gains, experts comment on role of Ripple stablecoin

Ripple declined to $0.52 on Thursday, erasing all gains registered earlier this week. Ripple SVP Eric van Miltenburg’s comments on the firm’s stablecoin, and how it is expected to benefit the XRP Ledger and native token XRP have raised concerns among crypto experts. 

More Ripple News

Hedera HBAR slips nearly 10% after air is cleared on mistaken link with giant BlackRock

Hedera HBAR slips nearly 10% after air is cleared on mistaken link with giant BlackRock

HBAR price is down nearly 10% on Thursday, partly erasing gains inspired by the misinterpreted link with BlackRock. Despite the recent correction, Hedera’s price is up 44% in the past seven days.

More Hedera News

The reason behind Bonk’s 105% rise and if you should buy now Premium

The reason behind Bonk’s 105% rise and if you should buy now

Bonk price has shot up 105% in the past five weeks. A retracement into $0.0000216 or the $0.0000152 to $0.0000186 imbalance would be a good buying opportunity. Patient investors can expect double-digit gains from BONK that could extend up to 70%.

More Cryptocurrencies News

Injective price weakness persists despite over 5.9 million INJ tokens burned

Injective price weakness persists despite over 5.9 million INJ tokens burned

Injective price is trading with a bearish bias, stuck in the lower section of the market range. The bearish outlook abounds despite the network's deflationary efforts to pump the price. Coupled with broader market gloom, INJ token’s doomed days may not be over yet.

More Injective News

Bitcoin: BTC post-halving rally could be partially priced in Premium

Bitcoin: BTC post-halving rally could be partially priced in

Bitcoin (BTC) price briefly slipped below the $60,000 level for the last three days, attracting buyers in this area as the fourth BTC halving is due in a few hours. Is the halving priced in for Bitcoin? Or will the pioneer crypto note more gains in the coming days? 

Read full analysis

BTC

ETH

XRP