Top 3 Price Prediction Bitcoin, Ethereum, Ripple: Crypto scary movie on the panel
- Sentiment level plummets by 30% despite falls of no more than 7%.
- The crypto market back to pessimism, a very positive factor in the long term.
- If selling returns in the short term, significant discounts on selected assets may arise.

At the same time that the bears on Wall Street showed their ability to break the irrational euphoria, some selling appeared in a crypto market that had already been pointing to a rapid fall for days, allowing it to emerge from the lethargy in which it was.
The impact of the downward movement on a technical level has been zero for the moment, but it leaves the situation much more dangerous for the next few days.
The market has felt the effects of the price drops on the market sentiment level. The indicator prepared by alternative.me site has collapsed to the 38 points from yesterday's 52 levels.
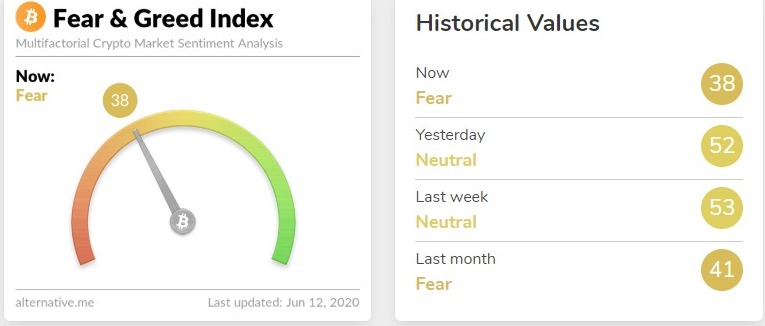
The crypto market is very fearful and is quickly giving up optimism about the first selling, even if it does not impact the technical scenario.
The indicator returns to the "fear" zone and pushes the moment back to the April level when the Bitcoin was trading below $7000.
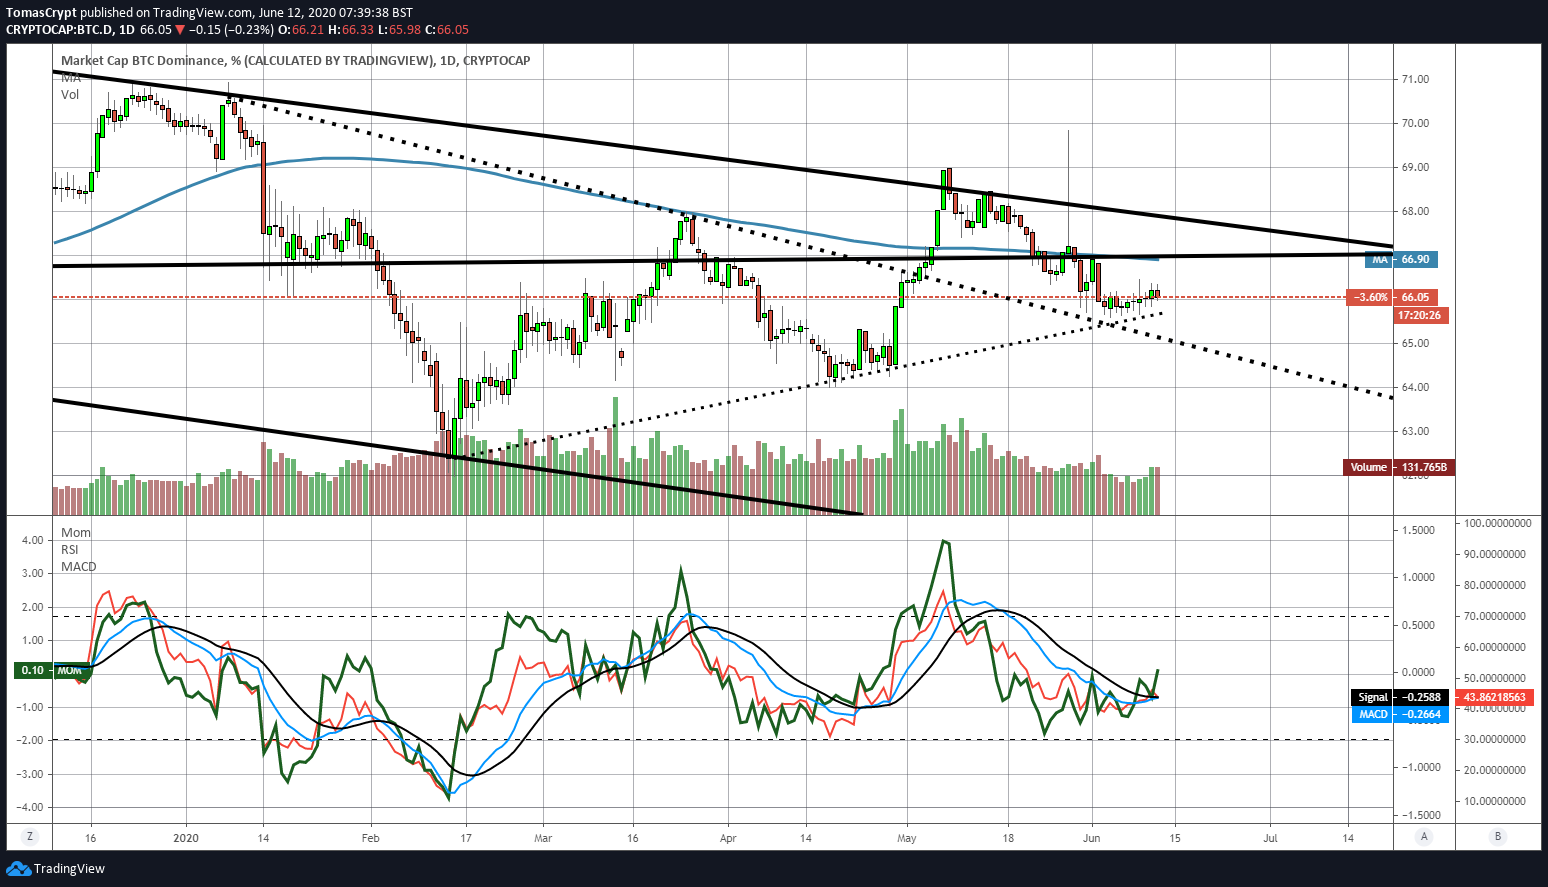
In the case of the dominance charts, the tension is still high. The Bitcoin dominance chart has an extremely bullish configuration at the moment, which has the Altcoin army on edge in case they need to rotate their positions towards the crypto market leader.
Ethereum dominance chart doesn't confirm the trend change towards a pro-Bitcoin market at the moment. Technical indicators are currently in a 66% bearish position.
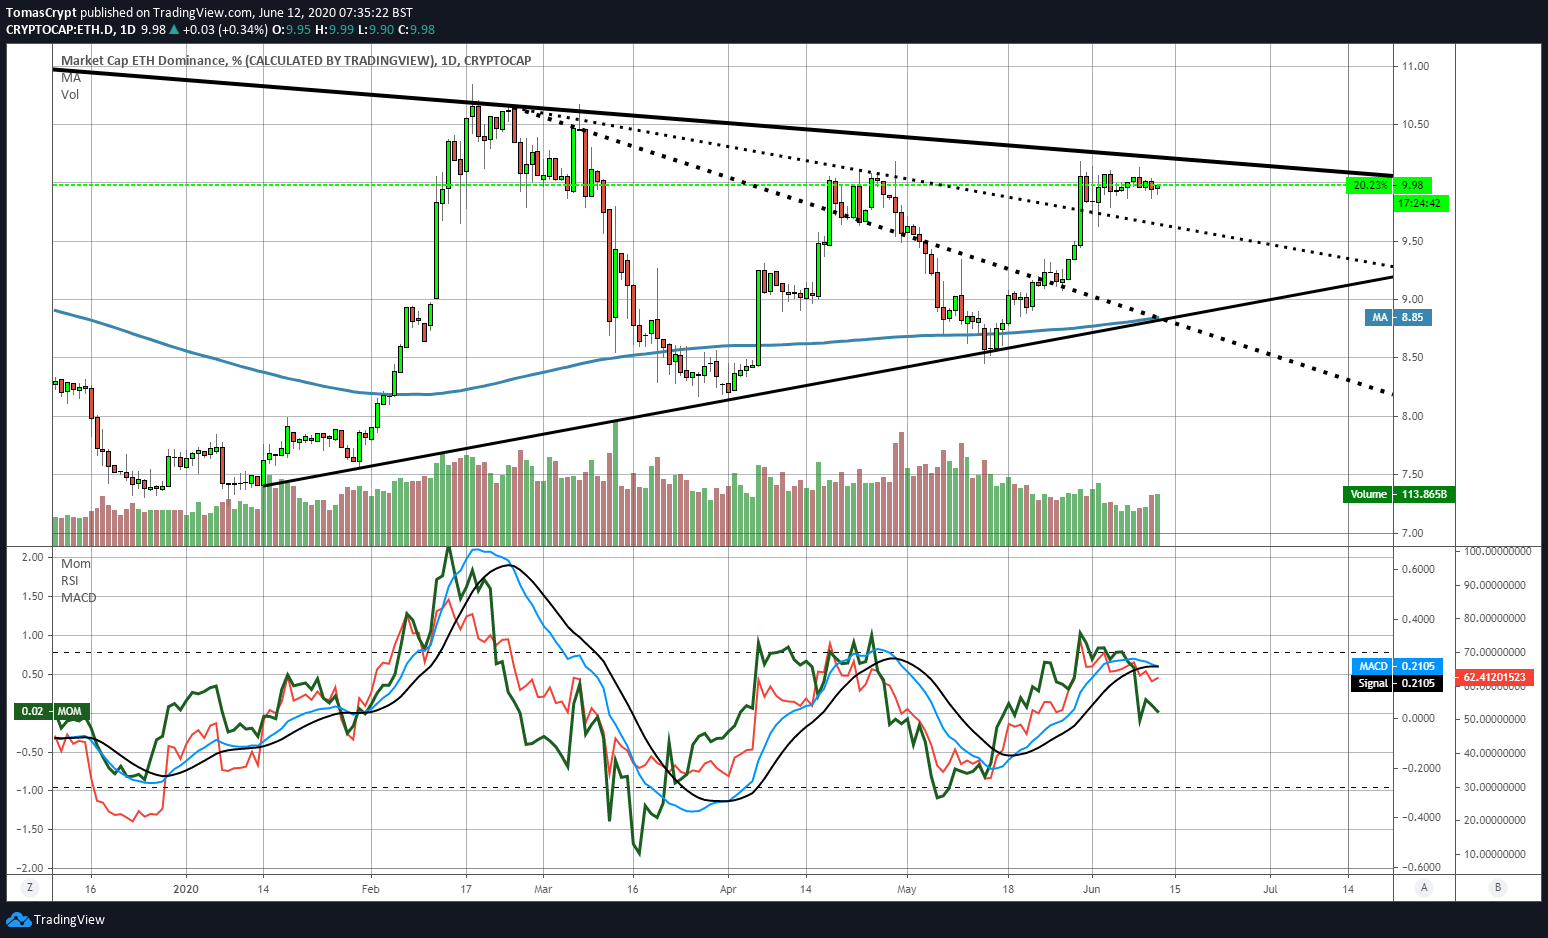
The bulls are clinging to the hope of a rapid upward movement that would raise the market share above 10.22% and thus enter a fully bullish scenario for Ethereum.
ETH/BTC Daily Chart
The ETH/BTC pair is currently trading at the price level of 0.0249 and remains above the price congestion support level of 0.0245. The bullish target is today at 0.0253, although it needs to break above 0.0258 to confirm the breakout.
Above the current price, the first resistance level is at 0.0253, then the second at 0.0258 and the third one at 0.0276.
Below the current price, the first support level is at 0.0245, then the second at 0.0236 and the third one at 0.0225.
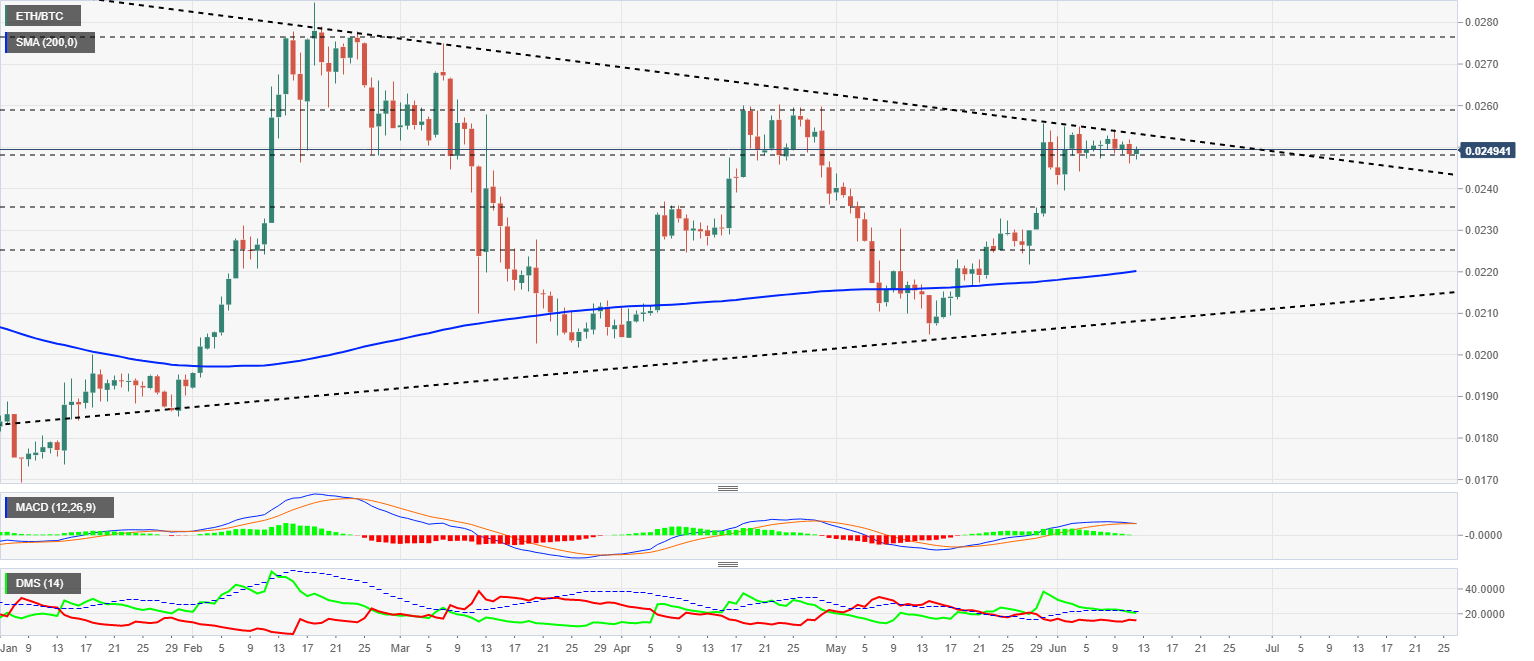
The MACD on the daily chart is crossing downwards, and the loss of support towards the 0.0235 level seems inevitable.
The DMI on the daily chart shows the bulls losing support from the ADX line, and thus disabling the previous bullish pattern.
BTC/USD Daily Chart
The BTC/USD pair is currently trading at $9450 price level, up 1.65% on the day as it attempts to hold onto the bullish quadrant of the chart. The bullish scenario remains intact but playing on the edge of danger. A close below the $9300 price level would be very damaging in the short and the medium term.
Above the current price, the first resistance level is at $9475, then the second at $10425 and the third one at $11381.
Below the current price, the first support level is at $9300, then the second at $9150 and the third one at $8725.
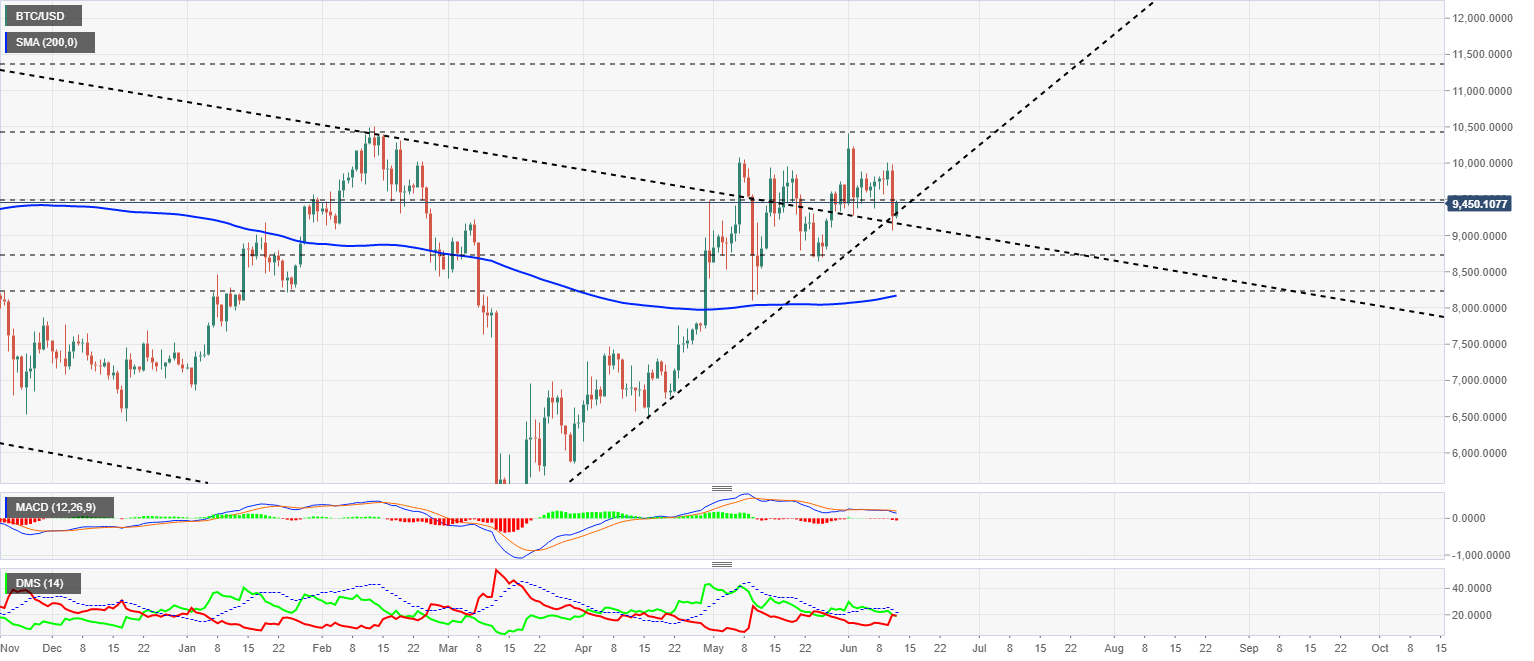
The MACD on the daily chart is sloping slightly lower but not enough to signal a definite end to the previous bullish trend.
The DMI on the daily chart confirms that there is still room for improvement for the bulls. Both sides of the market tie in trend strength levels, with both hands the 20 level – a sign of strength.
ETH/USD Daily Chart
The ETH/USD pair is currently trading at $236.1 and is regaining support from the $230 price congestion that it lost yesterday. The price remains within the lateral range of recent weeks, although technical indicators have worsened considerably.
Above the current price, the first resistance level is at $245, then the second at $268 and the third one at $285.
Below the current price, the first support level is at $230, then the second at $220 and the third one at $180.
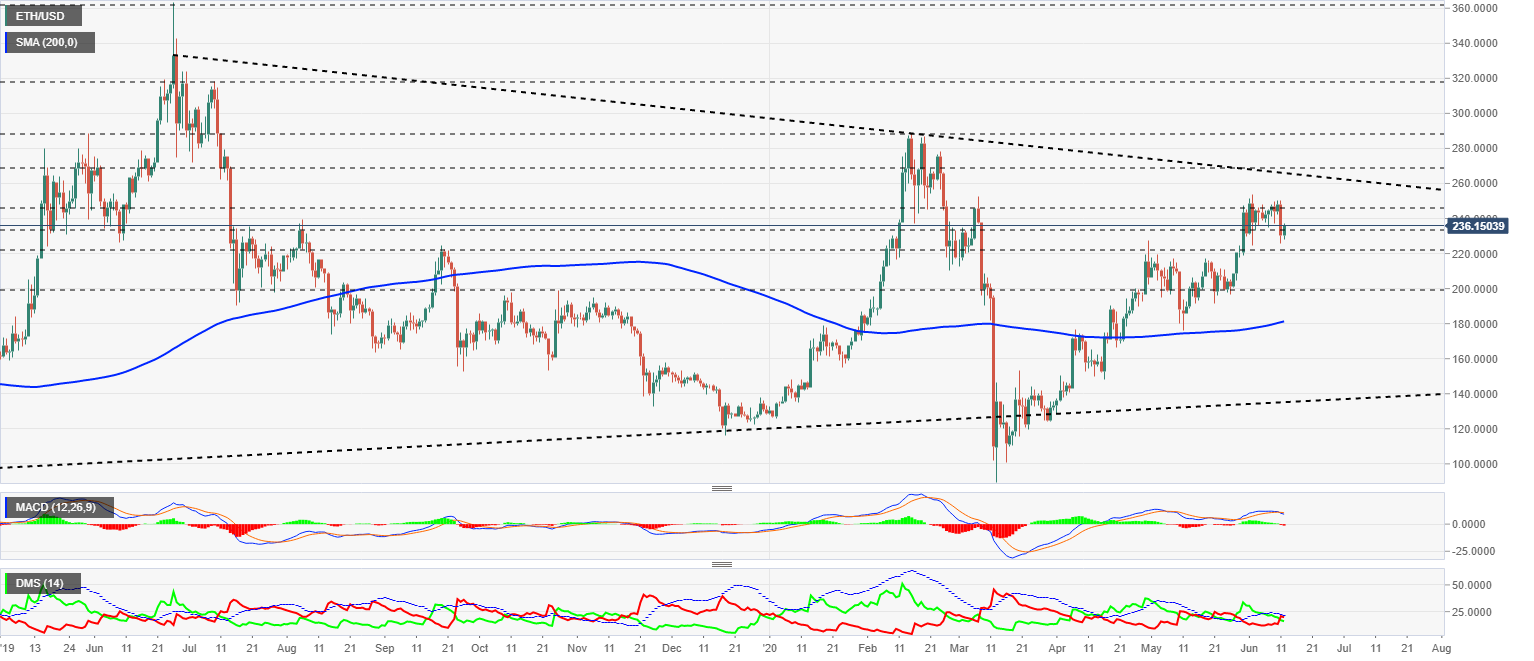
The MACD on the daily chart completes the bearish cross but could reverse if bulls take the lead.
The DMI on the daily chart shows the bears taking a small advantage of the bulls. The setup is not yet wholly bearish as the bears are unable to break the ADX line.
XRP/USD Daily Chart
The XRP/USD pair is currently trading at the price level of $0.1926 and is recovering after yesterday's drop brought the price to the primary bullish trend line of the current scenario.
Above the current price, the first resistance level is at $0.201, then the second at $0.211 and the third one at $0.235.
Below the current price, the first support level is at $0.184, then the second at $0.163 and the third one at $0.14.
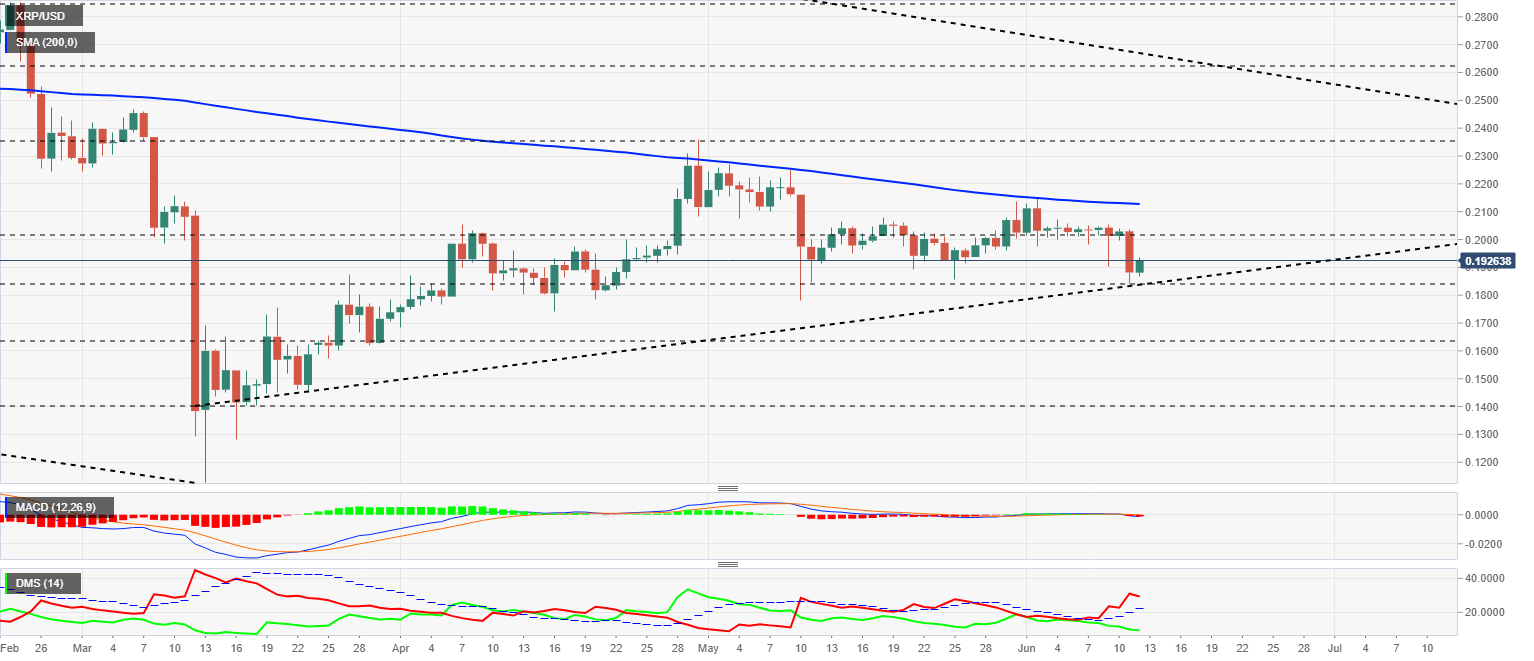
The MACD on the daily chart is finally coming out of its range and is slightly down, although it is still very close to the pair's upward sloping trend line and could turn up sharply.
The DMI on the daily chart shows the bears losing energy after yesterday's effort. The bulls are still pointing down, although we can expect an improvement on the buy-side due to oversold.
Author

Tomas Salles
FXStreet
Tomàs Sallés was born in Barcelona in 1972, he is a certified technical analyst after having completing specialized courses in Spain and Switzerland. He expanded his technical training following the guidance of great experts on the financial markets.


