Top 3 Price Prediction Bitcoin, Ethereum, Ripple: Crypto markets to turn green as bulls seize control
- Bitcoin price consolidates inside a range, extending from $28,575 to $31,493.
- Ethereum price eyes a revisit of $2,200 as it attempts a breakout.
- Ripple price shows a bullish structure from a high time frame perspective.

Bitcoin price is coiling up with no immediate directional bias in sight. On a higher time frame, however, things are looking bearish. Regardless, investors can expect BTC to sweep key levels to the bottom, allowing altcoins like Ethereum and Ripple to trigger a run-up.
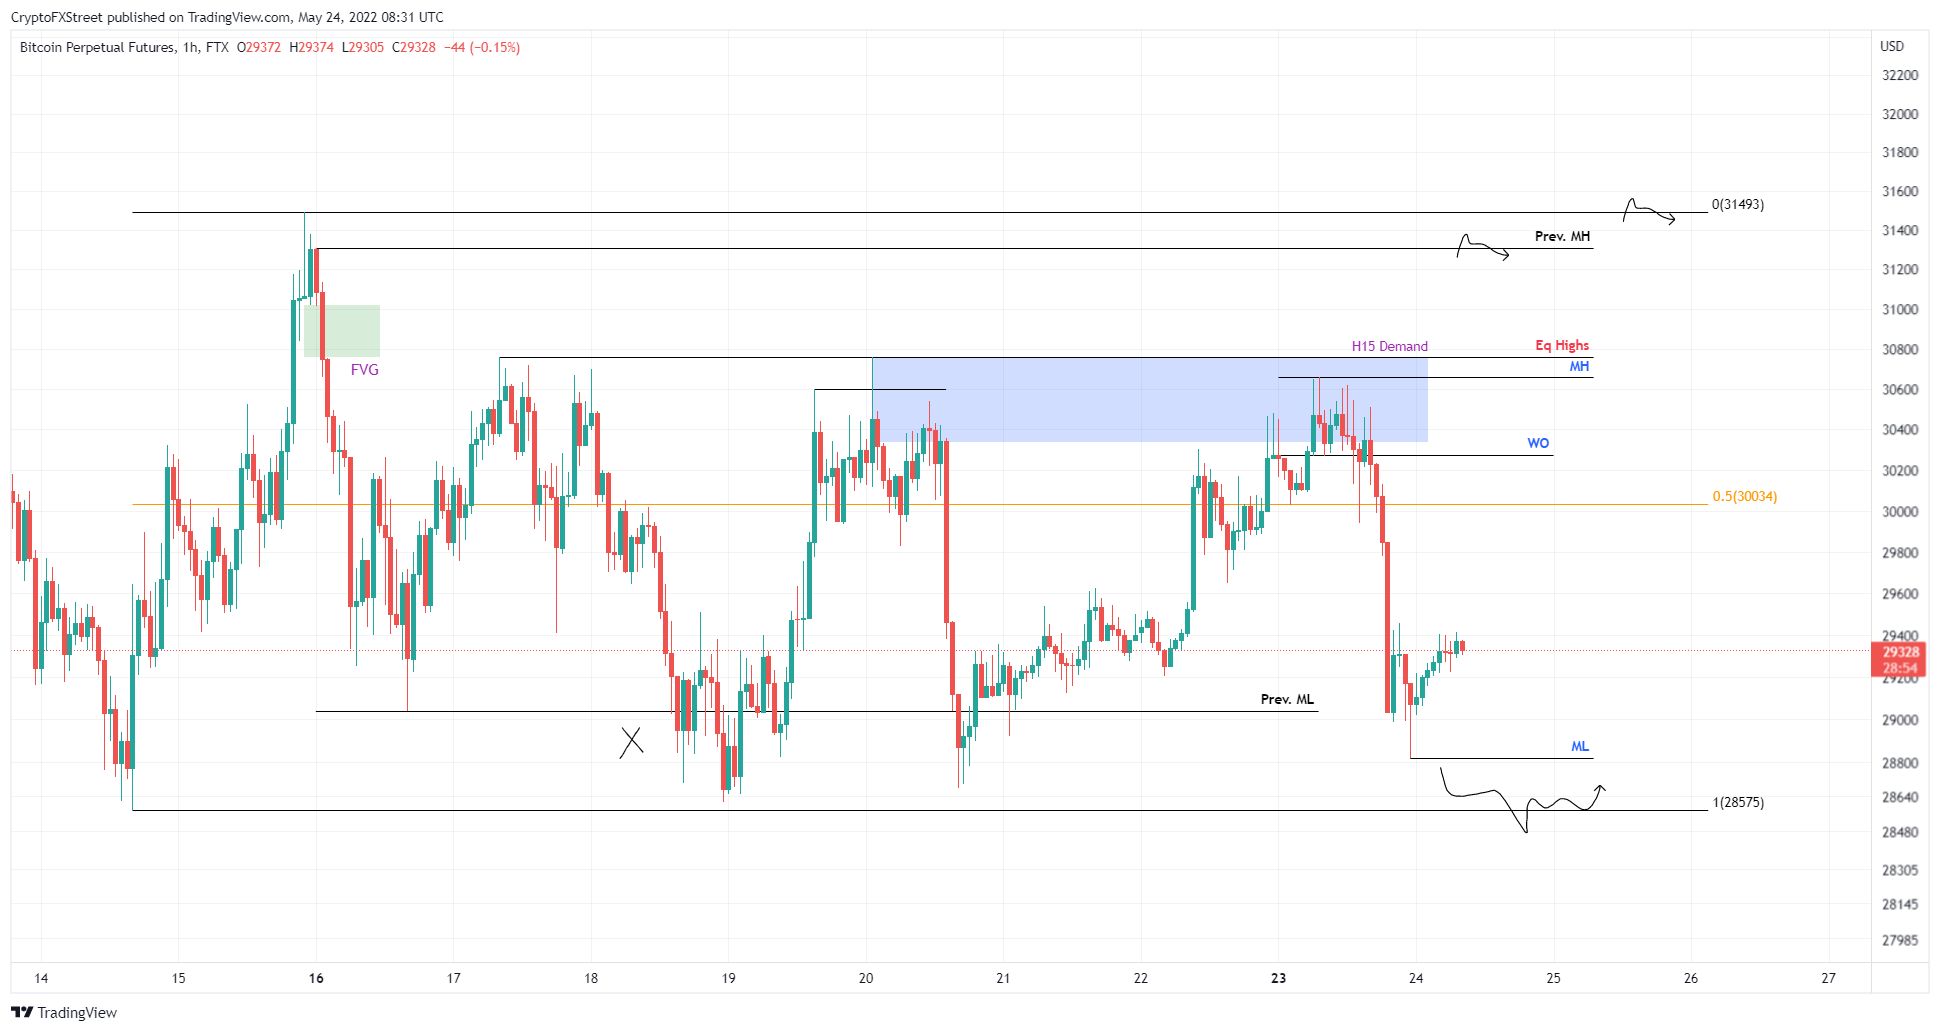
Bitcoin price ready to make a move
Bitcoin price tagged the 15-minute demand zone, extending from $30,336 to $30,757 and reversed the trend. This resulted in a 6% drop which created Monday’s high at $30,659 and Monday’s low at $28,820.
Investors need to wait for Bitcoin price to sweep the lower limit of the range, extending from $28,575 to $31,493. This move will collect liquidity and signal a reversal. In such a case, BTC will kick-start its rally to equal highs at $30,759 and a sweep of Monday’s low.
In some cases, Bitcoin price could extend to the large range’s upper limit at $31,493.
BTC/USD 1-hour chart
While things are looking up for Bitcoin price, a breakdown of the range low at $28,575 will open the path for BTC to sweep the equal low at $27,708. A four-hour candlestick close below this level will invalidate the bullish thesis and could push Bitcoin price to revisit the May 12 swing low at $25,333.
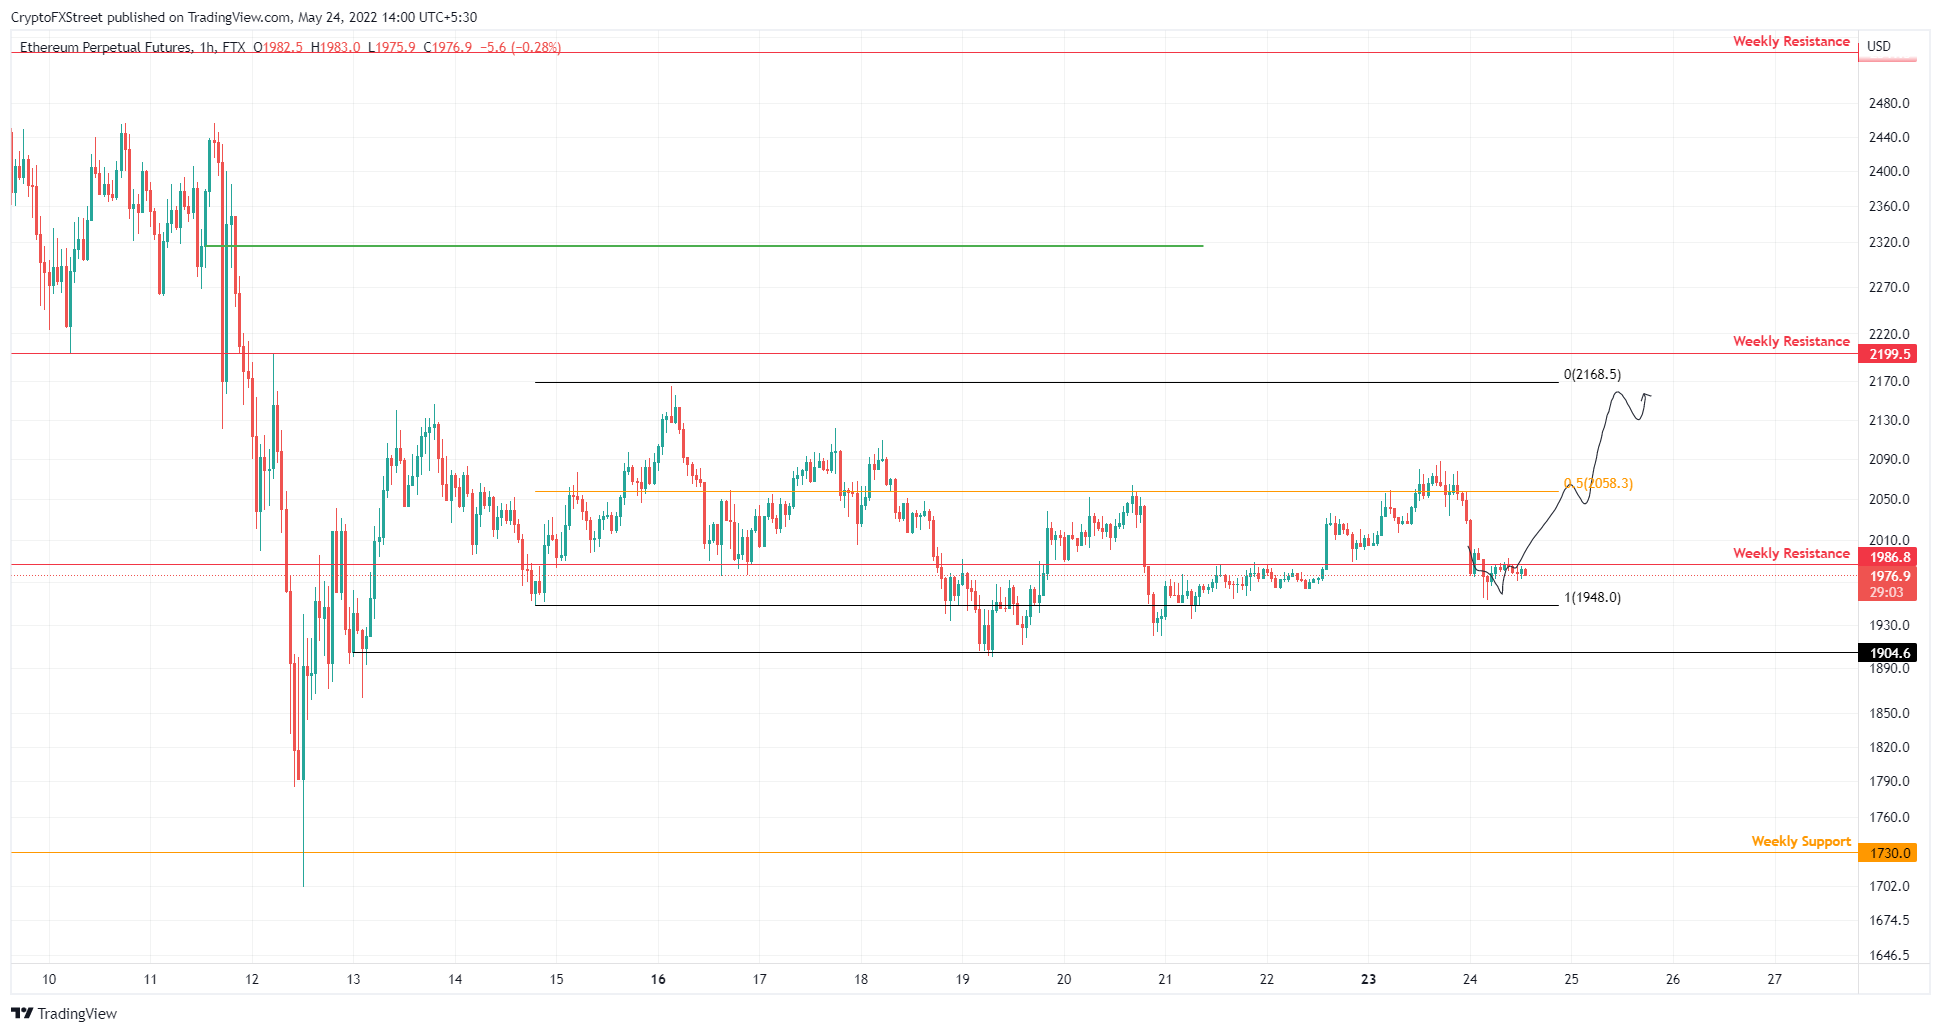
Ethereum price in relative trouble
Ethereum price is grappling with the $1,986 barrier, a swift move above which could indicate that buyers are dominating. Assuming this move occurs, ETH could continue its ascent and sweep the range high at $2,168.
While this move is impressive, Ethereum price could head higher to retest the weekly resistance level at $2,199. This barrier is where the upside is capped for ETH. In a highly bullish case, the smart contract token could extend the rally to $2,541, bringing the total run-up to 28%.
ETH/USD 1-hour chart
On the other hand, if Ethereum price produces a four-hour candlestick close below $1,904, it will create a lower low and invalidate the bullish thesis. This development could crash ETH to the weekly support level at $1,730.
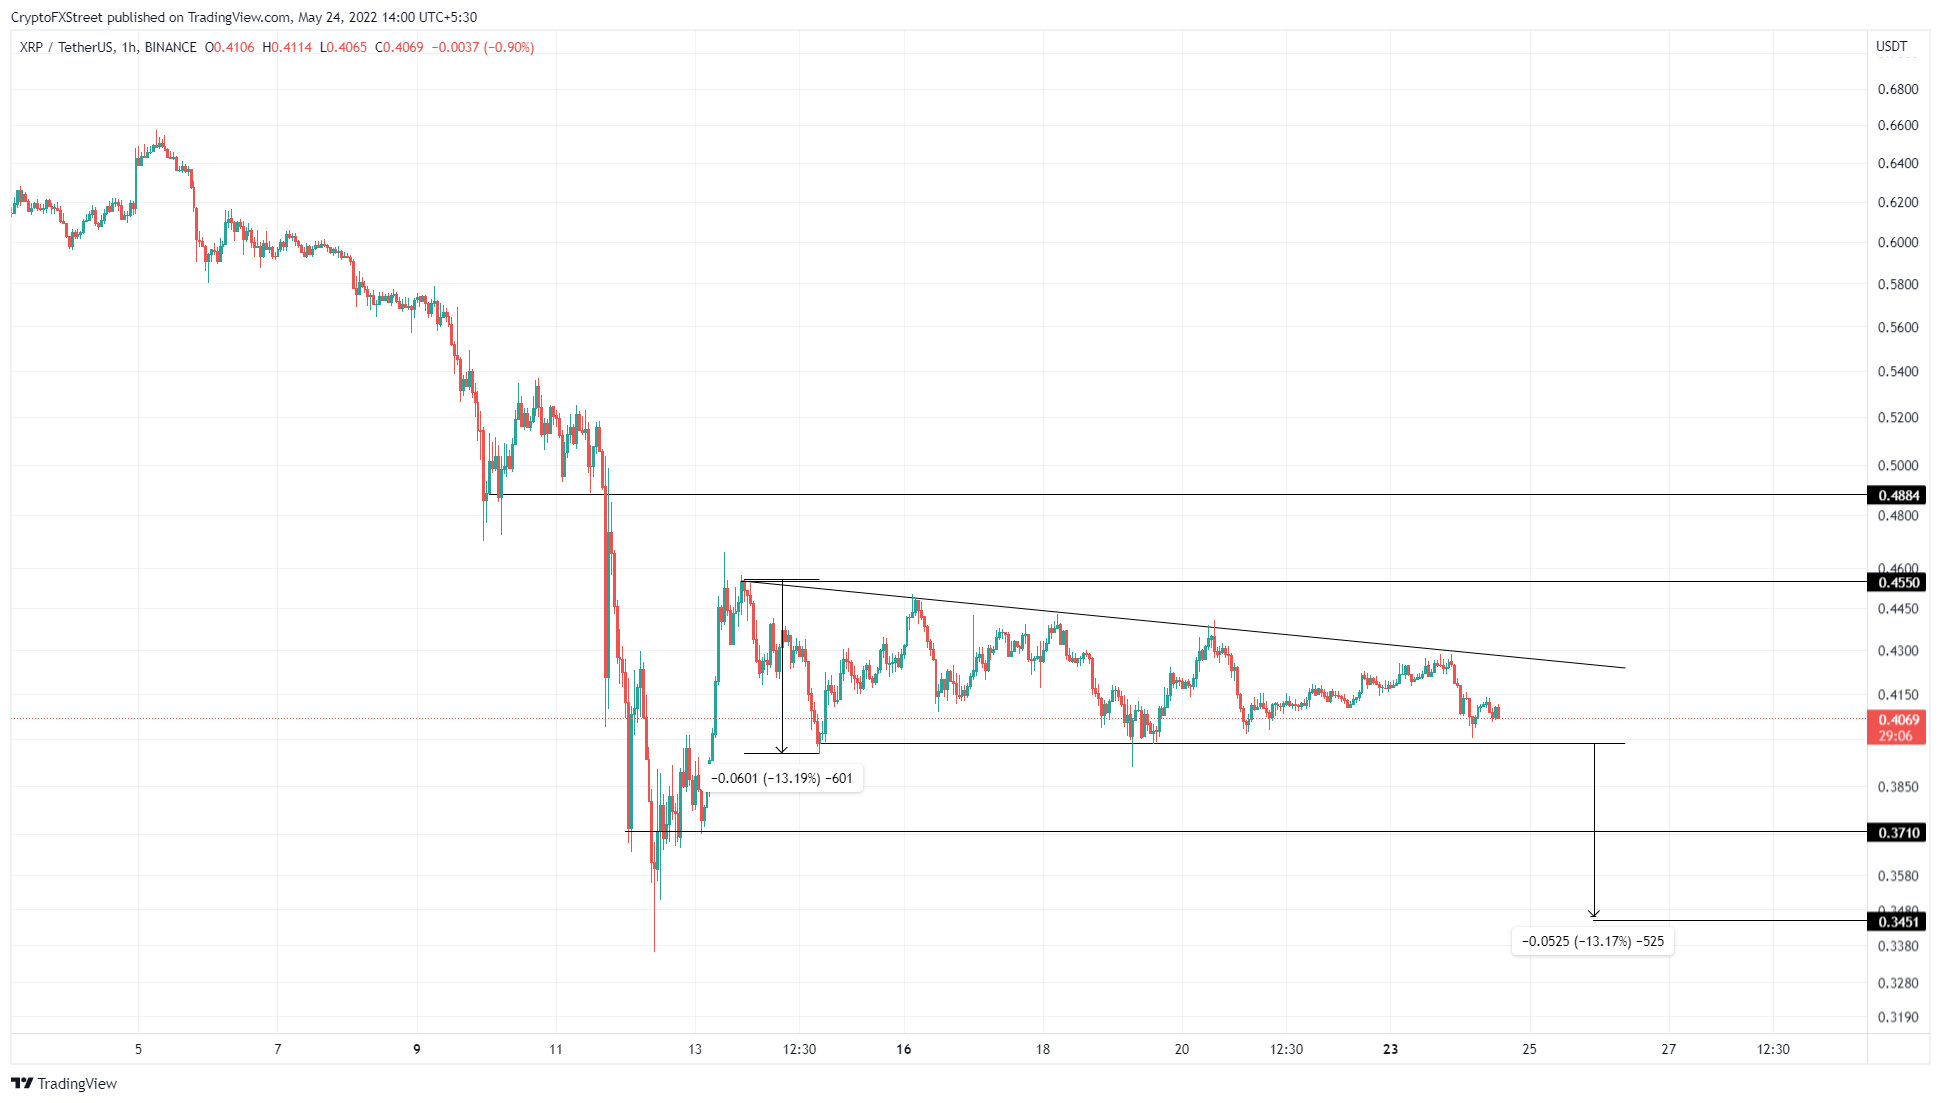
Ripple price eyes a descent
Ripple price set up equal lows around $0.398 and tagged this level thrice over the past nine days, The run-ups after these swing lows created lower highs. Connecting trend lines with these swing points shows a descending triangle in play.
This technical formation forecasts a 13% downswing, obtained by adding the distance between the first swing high and low to the breakout point at $0.398. Therefore, a four-hour candlestick close below this level will ignite this downtrend.
However, considering BTC’s outlook, there could be a fakeout that traps investors expecting a downtrend. Recovery from this fakeout above the triangle’s upper trend line will allow the XRP price to retest the $0.455 barrier.
A quick flip above this level will trigger a quick move higher that retests the $0.488 hurdle. In total, this move would constitute an 18% gain from the current position.
XRP/USD 1-hour chart
Regardless of the optimism, a four-hour candlestick close below $0.371 during a fakeout will indicate that the buyers are not in control and invalidate the bullish thesis. In such a case, Ripple price could crash lower and retest the $0.345 support level.
Author

Akash Girimath
FXStreet
Akash Girimath is a Mechanical Engineer interested in the chaos of the financial markets. Trying to make sense of this convoluted yet fascinating space, he switched his engineering job to become a crypto reporter and analyst.


