Top 3 Price Prediction Bitcoin, Ethereum, Ripple: Crypto market starts its engines, as ETH targets best day since May
- Bitcoin price is on pace for the best day since June 13 but remains down 8% for July.
- Ethereum price staging a rebound of 12% from the dominant support framed around $1,700.
- XRP price up 10% today after striking an oversold reading on the daily Relative Strength Index (RSI).

Bitcoin price leads a broad-based rally for the cryptocurrency complex after several altcoins reached an inflection point yesterday. It is an interesting evolution of the price action this month, but it does not definitively remove the downward bias that has been tormenting cryptocurrency investors in July. Confirmation of a trend change will come with follow-through for Ethereum and Ripple over the next few days as former resistance levels are overcome on a daily closing basis.
Bitcoin price masters support with bullish outcomes now possible
Bitcoin price builds on early gains as FOMO overtakes the cryptocurrency market after an enduring decline from the early July highs. The rebound has lifted BTC above the psychologically important $30,000 and towards the resistance marked by the confluence of the 50-week simple moving average (SMA) at $32,277 with the falling wedge’s upper resistance line around $32,800.
The falling wedge pattern is a bullish development for BTC after weeks of price churn around $30,000. It implies declining downside momentum and the potential for a sharp, convincing rally upon breakout.
To ignite a sustainable rally, Bitcoin price needs to log a daily close above the 50-week SMA at $32,277, the falling wedge’s upper resistance line at $32,800 and finally, the 10-week SMA at $34,873. The 10-week SMA invites a big challenge as BTC has not closed above the moving average on a weekly basis since the beginning of May.
Above $34,873, Bitcoin price will be primed to track down the resistance around the 38.2% Fibonacci retracement of the April-July correction at $42,589. The level closely matches the January high of $41,986.
Based on the measured move of the falling wedge, Bitcoin price will dismantle the resistance around the Fibonacci retracement and reach a price target of $46,300, or a gain of 40% from the pattern breakout. The BTC target correlates closely with the high of the crash week in May at $46,646.
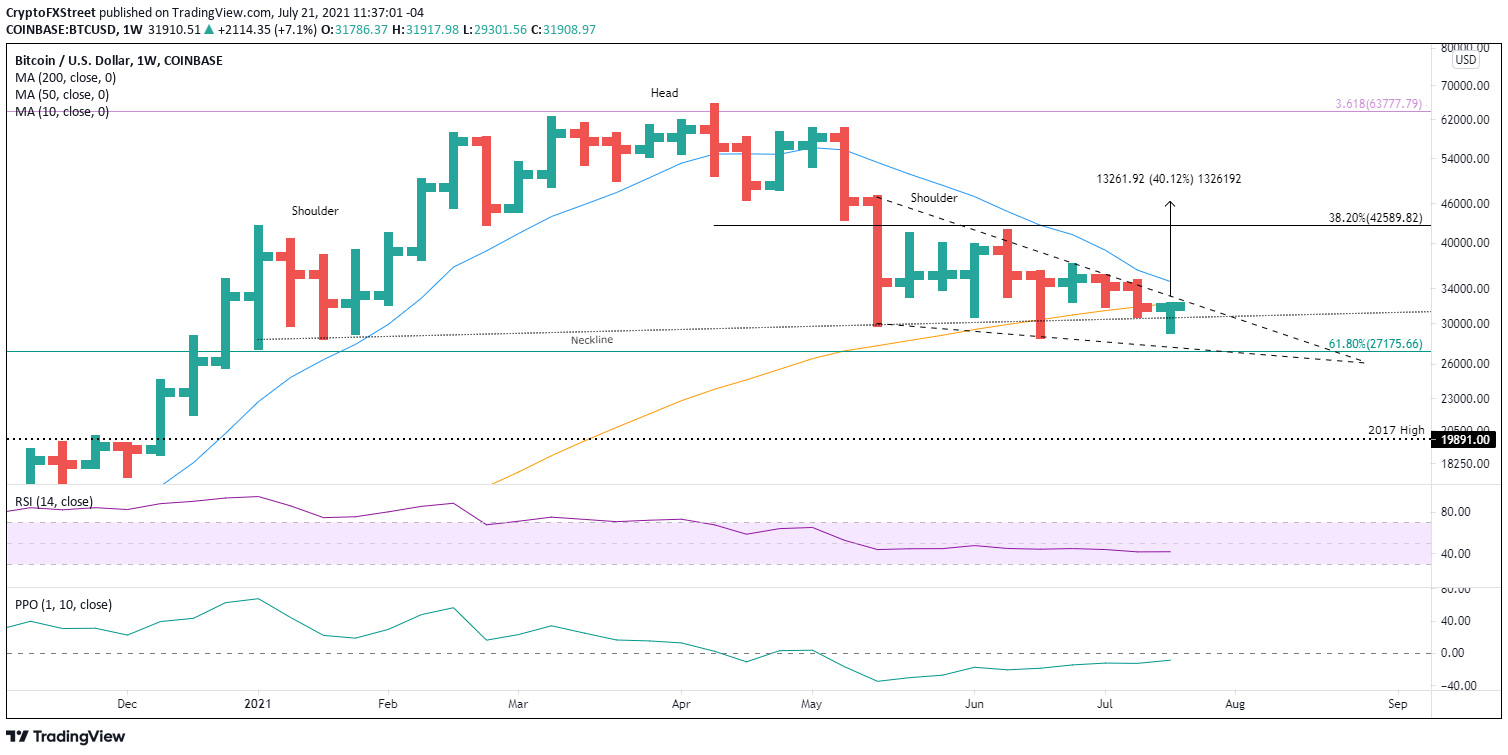
BTC/USD weekly chart
On the downside, Bitcoin price needs to hold the falling wedge’s lower support line around $27,670 and the 61.8% retracement level of the advance beginning in March 2020 at $27,175, on a daily closing basis.
A BTC failure to hold the levels could extend the correction to the 2017 high at $19,981 if the cryptocurrency market reverts lower on heavy selling.
Here, FXStreet's analysts evaluate where BTC could be heading next as it seems bound for a rebound before capitulation.
Ethereum price strongly bid as anxiety dissipates
Yesterday, Ethereum price successfully tested the principle support level around $1,700, dictated by the May 23 low of $1,728, the June 22 low of $1,700, the June 26 low of $1,717 and the 61.8% Fibonacci retracement level of the ETH rally beginning in March 2020 at $1,730. Interestingly, the average of the four levels is $1,719 and yesterday’s low was $1,720.
Today’s ETH gain of almost 12% is a compelling response to the successful test. If it holds, it positions Ethereum price to test the notable resistance spread between the psychologically important $2,000 and the intersection of the 2020 ascending trend line with the 200-day SMA at $2,083. It would represent a total gain of 18% from yesterday’s close and further release the heightened anxiety in the market.
A decisive close above the 200-day SMA frees Ethereum price to target the 50-day SMA at $2,213, taking the gain from yesterday’s low to 25%. However, yesterday, an FXStreet article revealed a huge number of out-of-the-money addresses around $2,000, suggesting the level will be a stiff test for the emerging bullish ETH momentum.
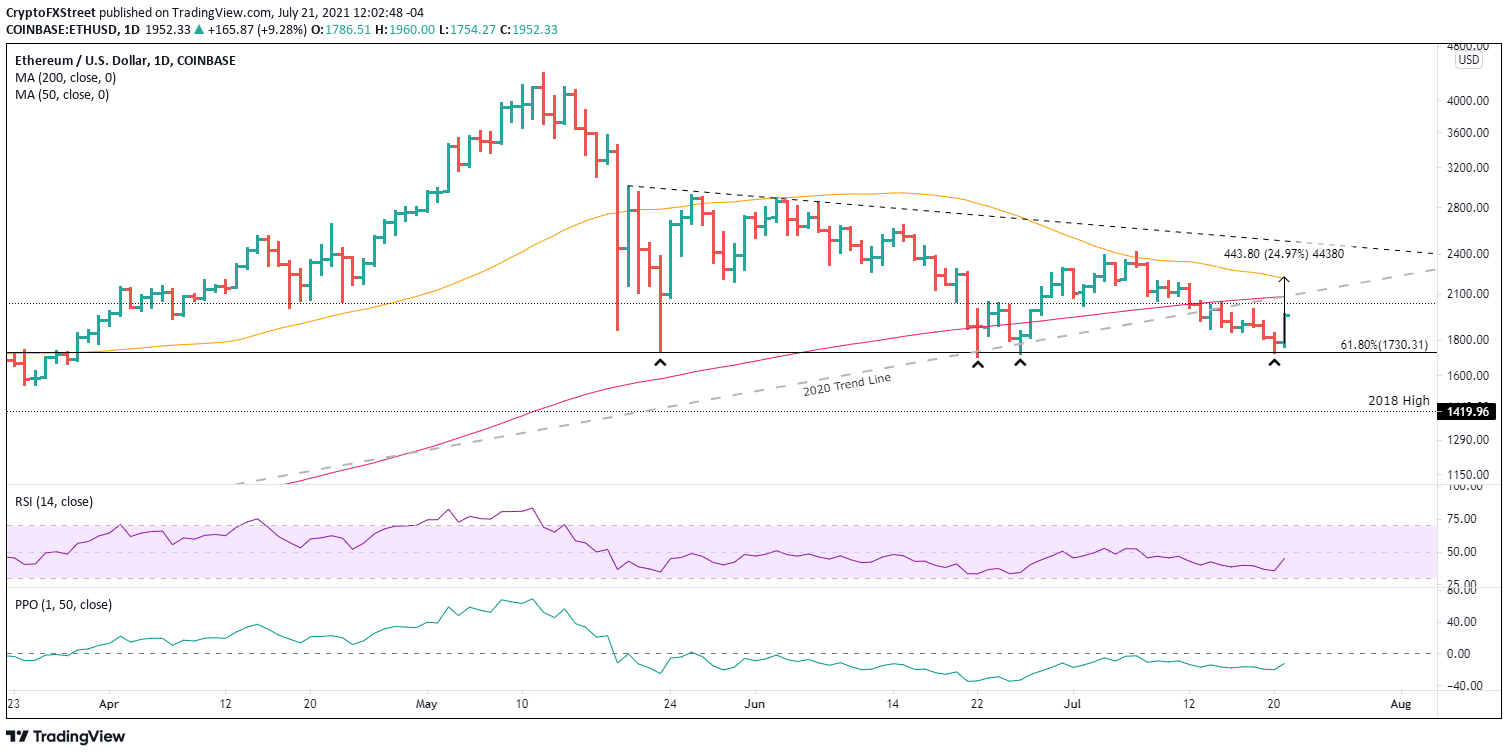
ETH/USD daily chart
If Ethereum price cannot sustain today’s bullish impulse and turns lower again, it needs to hold the $1,700 level on a daily close. A failure will project a quick decline to the formidable support created by the convergence of the 50-week SMA at $1,413 with the 2018 high of $1,419. Any ETH weakness beyond those levels may induce a sell-off to the 200-week SMA at $590.
Here, FXStreet's analysts evaluate where ETH could be heading next as it seems bound for a breakout after holding above key support.
XRP price starts the engines, seeking a resumption of the flight higher
The 9% gain for XRP price at the time of writing has placed the international settlements token above the 78.6% Fibonacci retracement level of the advance beginning in December 2020 at $0.555. Moreover, the considerable momentum may lift Ripple above the 50-week SMA at $0.571 on a weekly closing basis and, as a result, a bullish hammer candlestick.
Today’s rebound follows a test of the June 22 low of $0.512 and an oversold reading on the daily RSI. To confirm the low XRP price needs a daily close above May’s declining trend line at $0.631 and then the critical resistance defined by the May 23 low of $0.652. It is a 15% gain from the current price but a responsible approach to trading the Ripple price structure.
Above $0.652 XRP price will strike resistance at the declining 50-day SMA at $0.724 and then the organized resistance at the 200-day SMA at $0.755 and the neckline of the 2018-2021 inverse head-and-shoulders pattern around $0.773. A rally to the neckline would yield a gain of over 18% from $0.652.
The Ripple outlook becomes more exciting with a weekly close above the neckline, as there is no resistance of importance until the psychologically important $1.00. It would signal that XRP price has started the engines in search of profitable outcomes for investors.
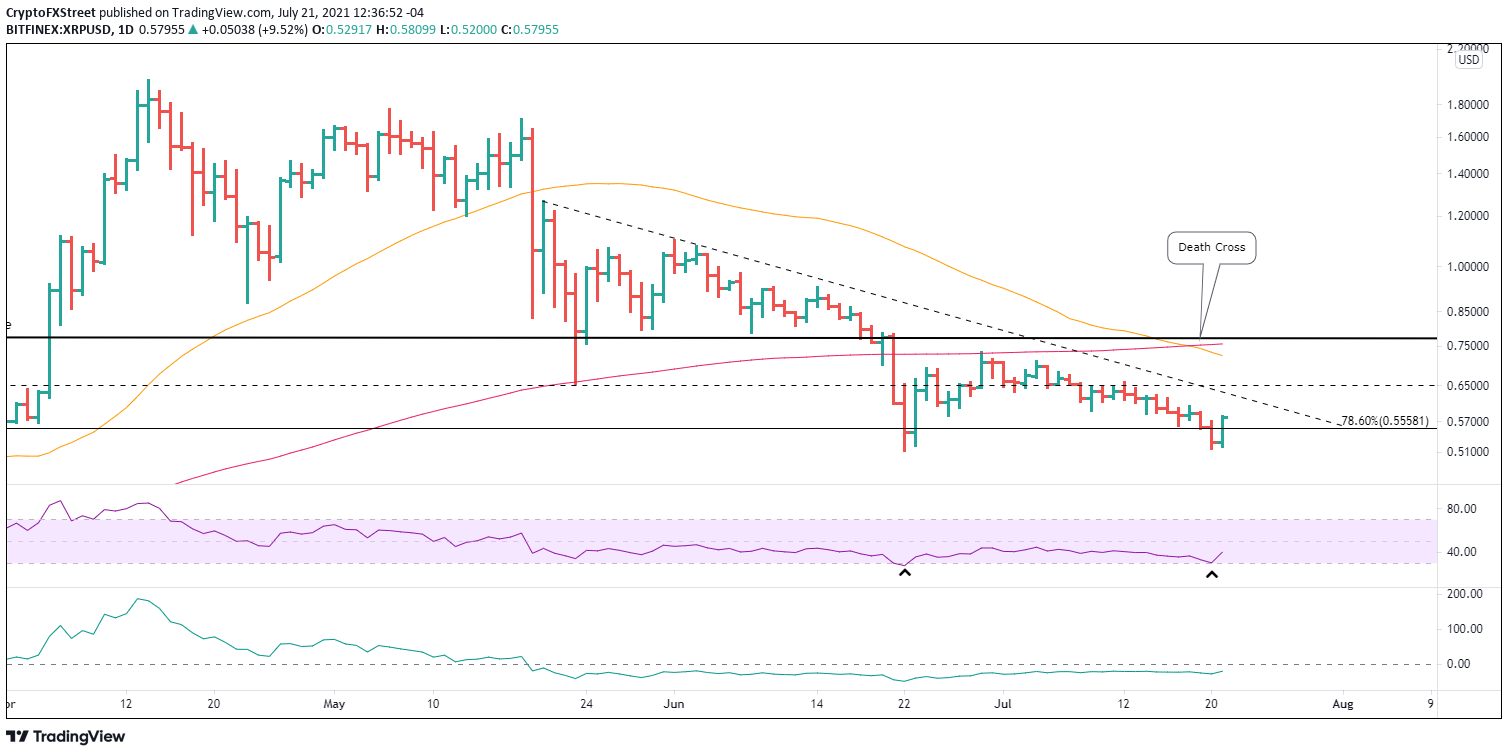
XRP/USD daily chart
Obviously, the XRP price strength could be a one-day event, and renewed selling asserts control again. A daily close below the June 22 low of $0.512 would raise the probabilities that Ripple will test the 200-week SMA (mean) at $0.457. Any weakness below the mean is not currently factored into the macro model for XRP price.
Not very often one day changes a trend, but it can awake market speculators from their slumber, putting their focus back on follow-through and timely, accurate trigger prices. For now, it is about the daily close and where it sits in the price structure of Bitcoin, Ethereum and Ripple. Nevertheless, the market has started its engines, improving the technical circumstances of the three major cryptocurrencies, at least for now.
Here, FXStreet's analysts evaluate where Ripple could be heading next as it seems bound for an upswing before lower lows.
Author

Sheldon McIntyre, CMT
Independent Analyst
Sheldon has 24 years of investment experience holding various positions in companies based in the United States and Chile. His core competencies include BRIC and G-10 equity markets, swing and position trading and technical analysis.


