Top 3 Price Prediction Bitcoin, Ethereum, Ripple: Crypto market in shambles as BTC consolidates
- Bitcoin price slides lower, hinting at a retest of the 50 weekly SMA at $44,778.
- Ethereum price prepares for a 16% breakout from the falling wedge pattern.
- Ripple price could see an 11% ascent to $0.96 as it prepares for a second leg-up.

Bitcoin price is moving sideways, trapped between crucial weekly moving averages. This consolidation has had a positive knock-on effect on Ethereum price which is setting up a bullish pattern ready for a breakout. Ripple, on the other hand, has already embarked on a climb and is preparing for its second leg-up.
Bitcoin price anticipates short-term losses
Bitcoin price is in a slow downtrend and looking to retest the 50-week Simple Moving Average (SMA) at $44,778. While this development will see BTC shed roughly 3%, it could result in a bounce, triggering a bullish outlook.
A successful bounce off the said SMA will open the path to retest the 21-week SMA at $51,256 and, in a highly bullish case, the $53,709 resistance level. If the bid orders continue to pour in, the pioneer crypto is likely to continue its ascent and tag the $57,845 barrier.
Regardless, investors need to note that this bullish outlook is contingent on a successful bounce off the 50-week SMA at $44,778.
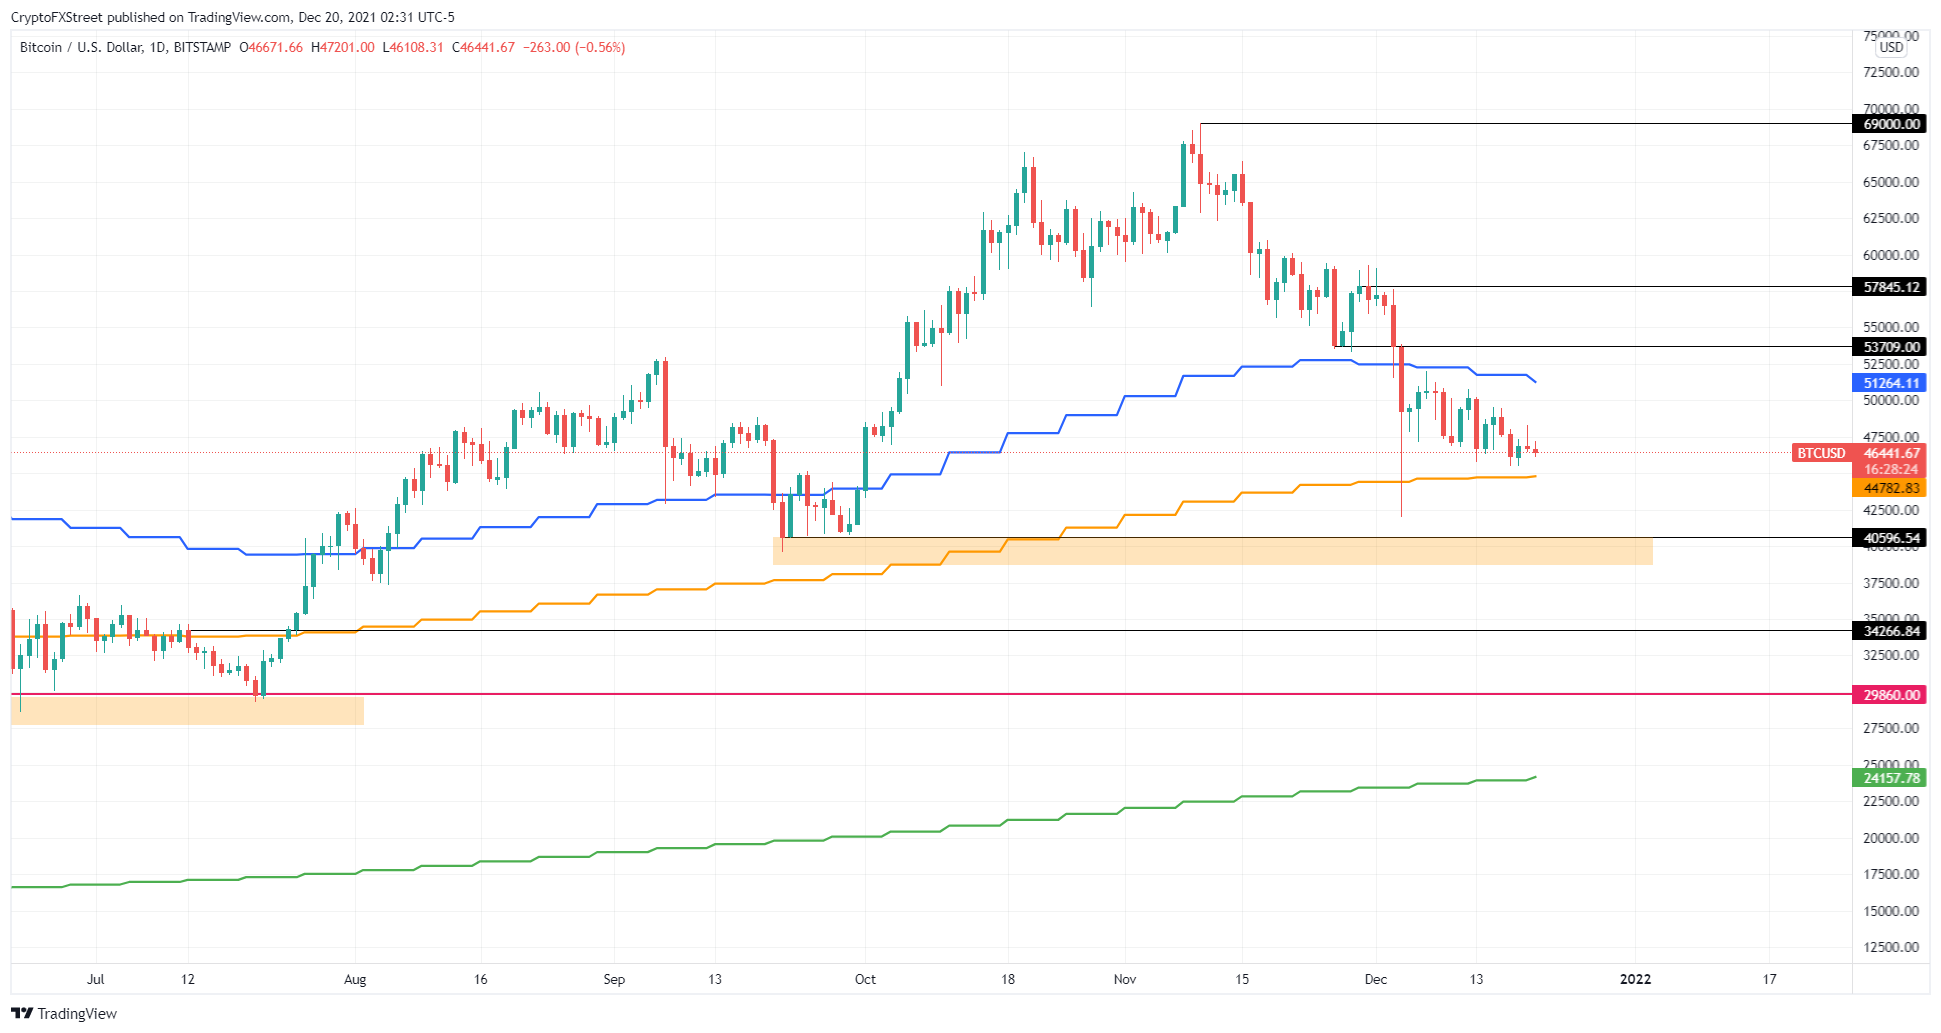
BTC/USD 1-day chart
If Bitcoin price slices through the SMA at $44,778, there is a good chance it will continue its descent to $40,596 to collect the liquidity resting below it. A daily close below $44,778 will invalidate the bullish thesis detailed above.
Ethereum price eyes higher highs
Ethereum price has been outlining a falling wedge pattern since November 28. This technical formation is obtained by connecting the three lower lows and four lower highs formed during this period using trend lines.
The setup forecasts a 16% upswing, obtained by adding the distance between the first swing high and swing low to the breakout point at $3,912, which puts ETH at $4,533.
Assuming Ethereum price can bounce off the 70.5% retracement level at $3,780, this run-up would constitute a 20% ascent. Therefore, investors need to keep a close eye on the reversal of the retracement.
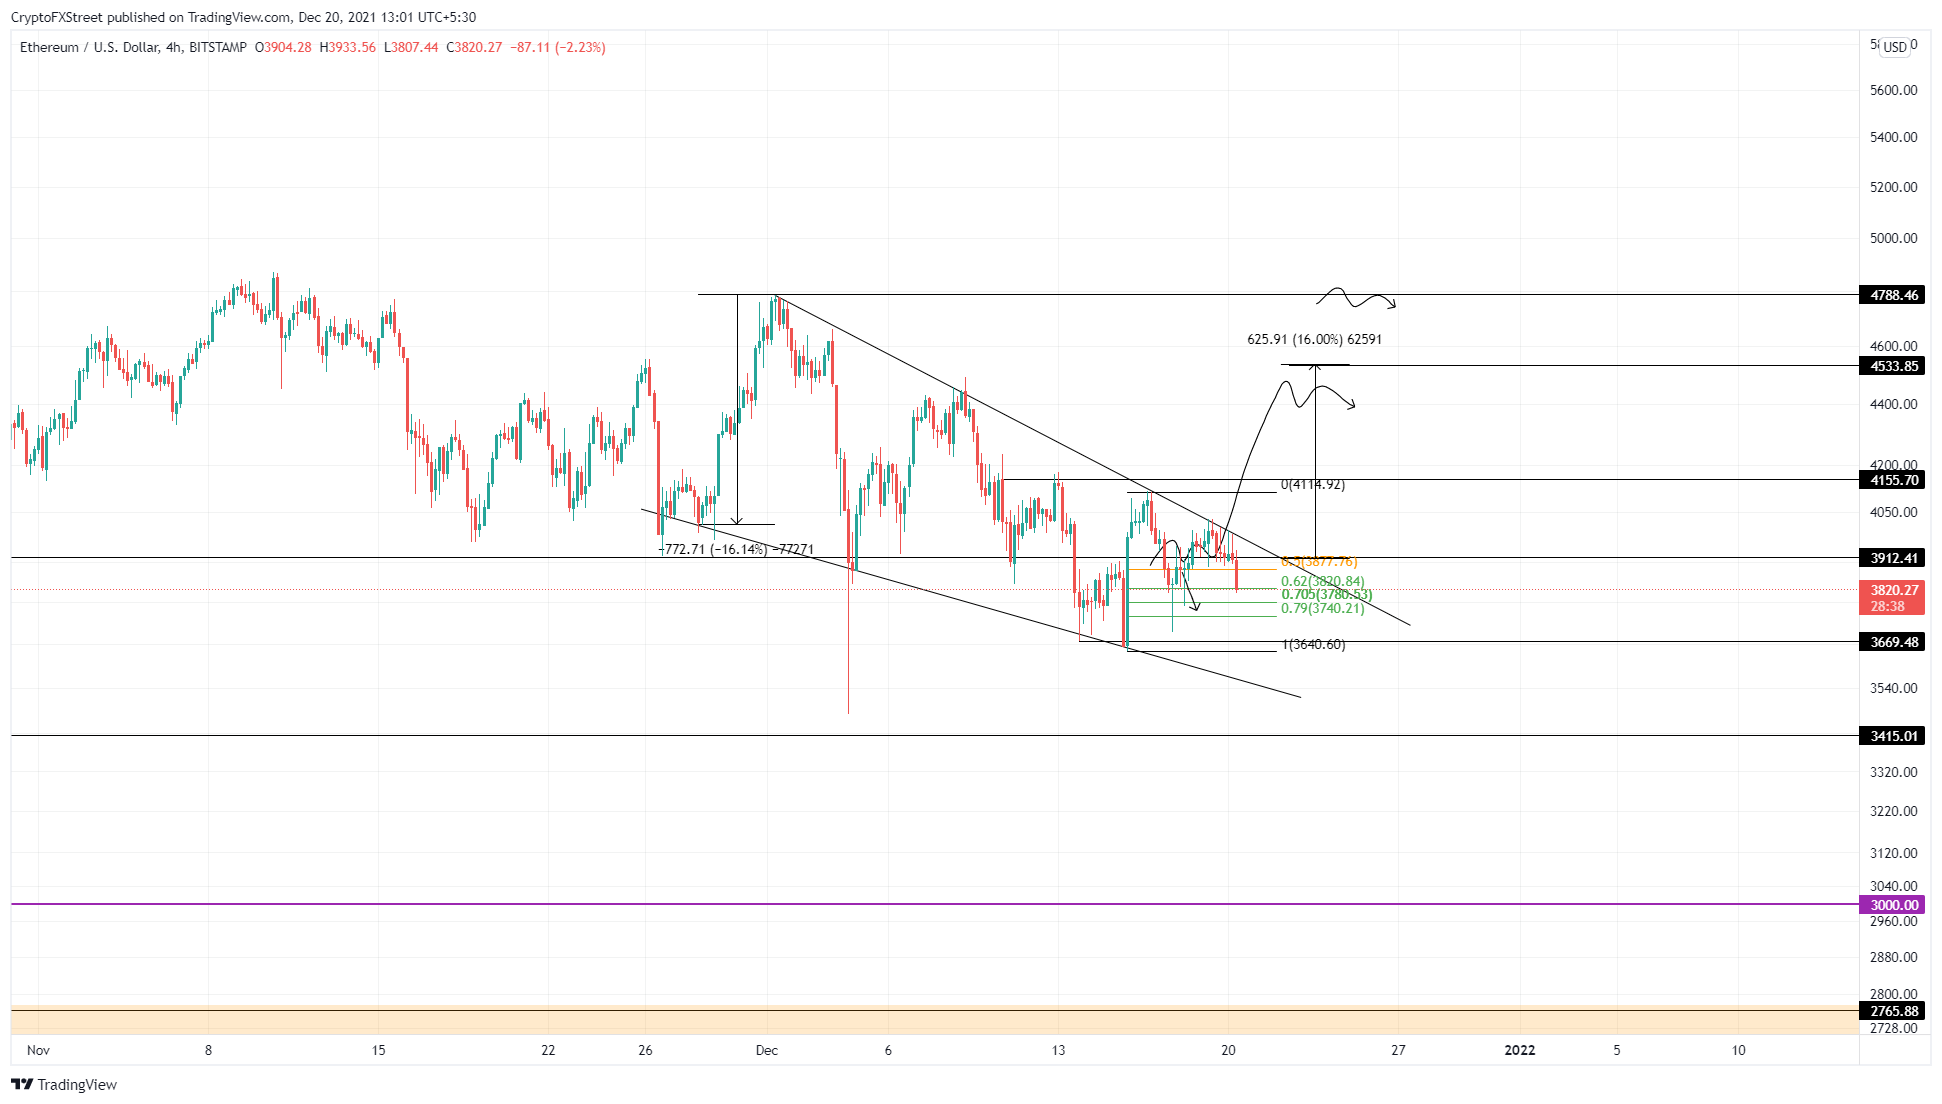
ETH/USD 4-hour chart
On the other hand, if Ethereum price shatters the $3,780 and $3,740 barriers, it is likely to head lower to retest the range low at $3,669. A four-hour candlestick close below this level will create a lower low, invalidating the bullish thesis.
Ripple price vies to keep going higher
Ripple price consolidated around the $0.837 resistance barrier for more than a week. The increased buying pressure resulted in an 11% spike in XRP price, pushing it to set up a potential swing high at $0.917.
While the initial surge was noticeable, investors can expect XRP price to retrace before triggering another rally. The 0.837 support level will likely be tagged again soon. Assuming this occurs, market participants can expect Ripple price to climb 12% to retest the $0.936 hurdle.
In some cases, XRP price might extend this advance to collect the liquidity resting above $0.980 or $1.018 hurdles.
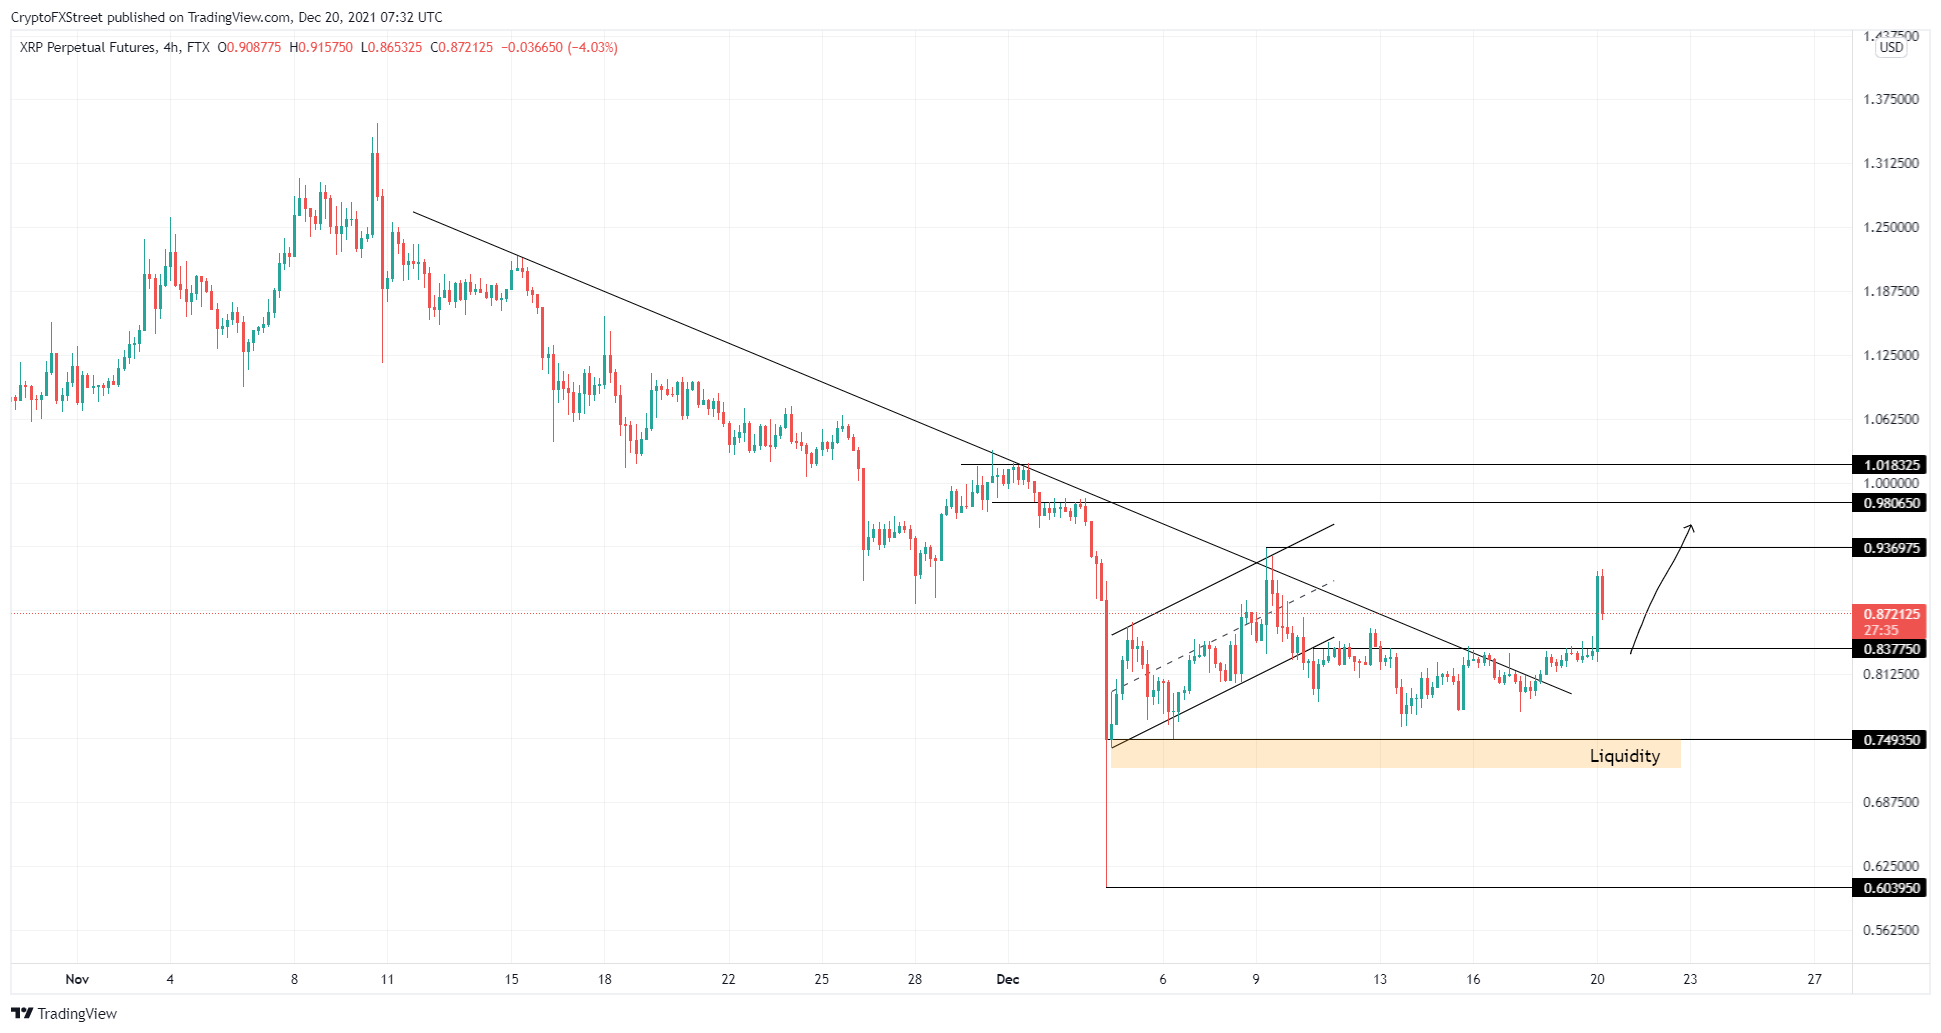
XRP/USD 4-hour chart
While things are looking up for Ripple price, a breakdown of the $0.837 support level will indicate weakness among buyers. In this case, XRP price will probably dip below the $0.749 demand barrier to collect the liquidity resting there. A daily close below this level will indicate buyers are unwilling to push the price higher and invalidate the bullish thesis for the remittance token.
Author

Akash Girimath
FXStreet
Akash Girimath is a Mechanical Engineer interested in the chaos of the financial markets. Trying to make sense of this convoluted yet fascinating space, he switched his engineering job to become a crypto reporter and analyst.



