Top 3 Price Prediction Bitcoin, Ethereum, Ripple: Casual cryptocurrencies are around the corner
- Binance and Pay-Pal work to make cryptocurrencies simple and common for the masses.
- Second-tier Altcons decouple from Ethereum and fight for market share.
- Ripple dangerously plays with the cliff, threatening the recent gains.

Daylight is dawning today with green as the dominant color in response to two announcements that are on their way to make the line between the crypto universe and the quotidian and earthly world of daily shopping very narrow.
Binance Europe presents a new credit card that will allow customers to make purchases and pay for them with funds from Bitcoin, Binance Coin, Swipe and Binance USD. The remarkable thing about the product is that the user will not need to convert these crypto assets to fiat currency previously. The money will go from the Binance portfolio to the retail account.
The second story that is encouraging the market comes from PayPal. The giant of internet payments has admitted in a document sent to the EU that it is working on blockchain technology to implement a cryptographic solution to its payments and collections structure.
HOW TO MANAGE A PORTFOLIO OF ALTCOINS
When everything seemed to point out that the crypto board would fall into one of its soporific "mini winters", it rises again and maintains the medium-term upward scenario.
The market is closely watching the dominance charts, the overall reading of which indicates that both Bitcoin and Ethereum are losing market share relative to the Altcoin segment.
The chart below is an index representing the value of a basket of the leading Altcoins versus Bitcoin. The index includes Ethereum, although it is likely that in the future its status will be closer to that of Bitcoin rather than crypto. The other components of the index are Ripple, Bitcoin Cash, Bitcoin SV, Cardano, Stellar Lumens, Litecoin and EOS.
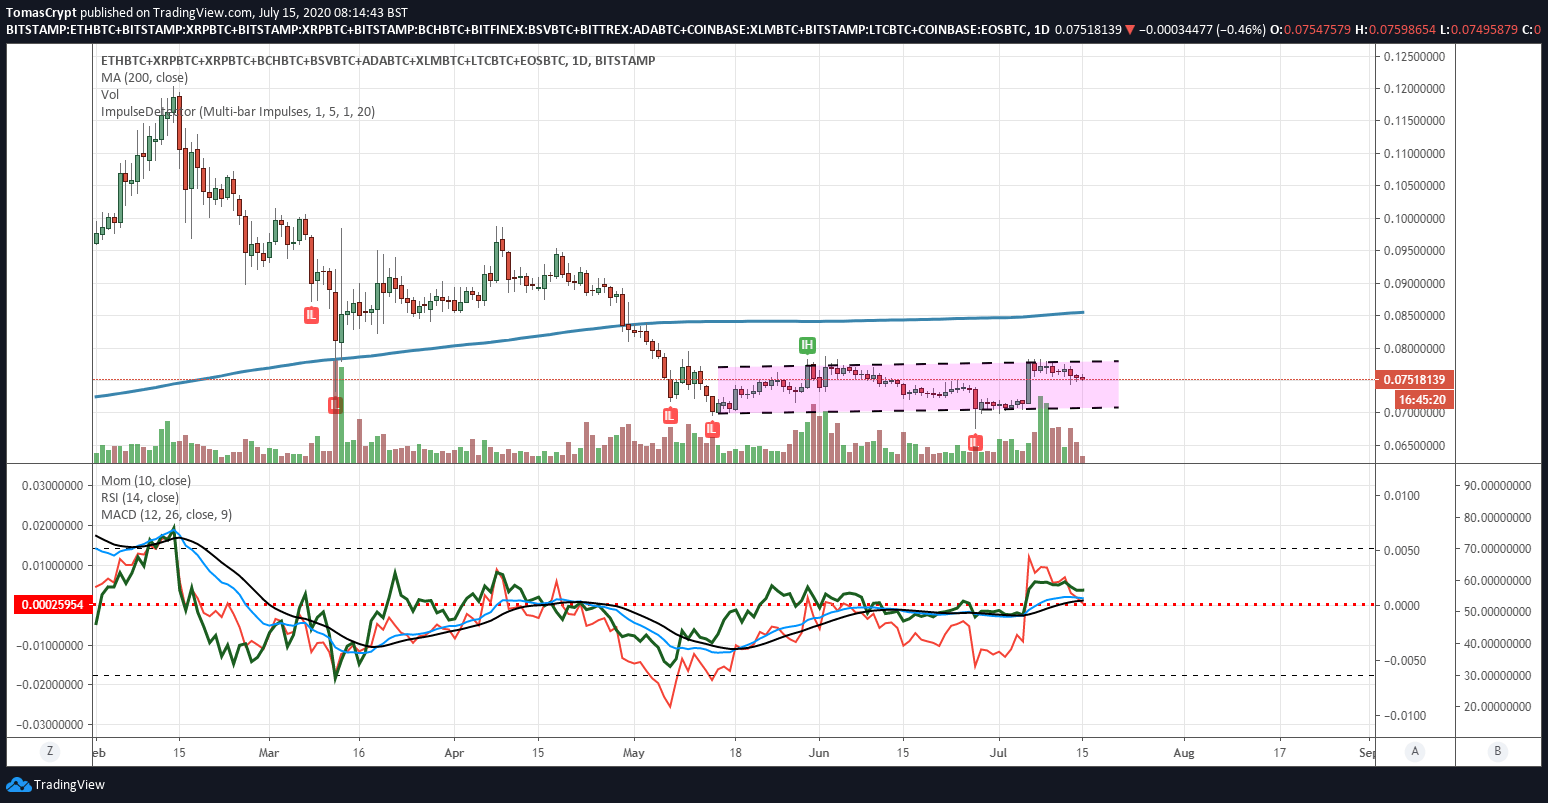
In this chart, we can see that the 200-day simple moving average has been rising since the beginning of the year. The index is currently trading at 0.07529, following a narrow upward sloping channel. Above the 0.078 level, this group of Altcoins would rise very sharply against the Bitcoin, with the 0.0856 level as the first target.
Anyone can build a similar synthetic index with their Altcoin bag, and correctly manage possible rebalancing of their cryptocurrency investment.
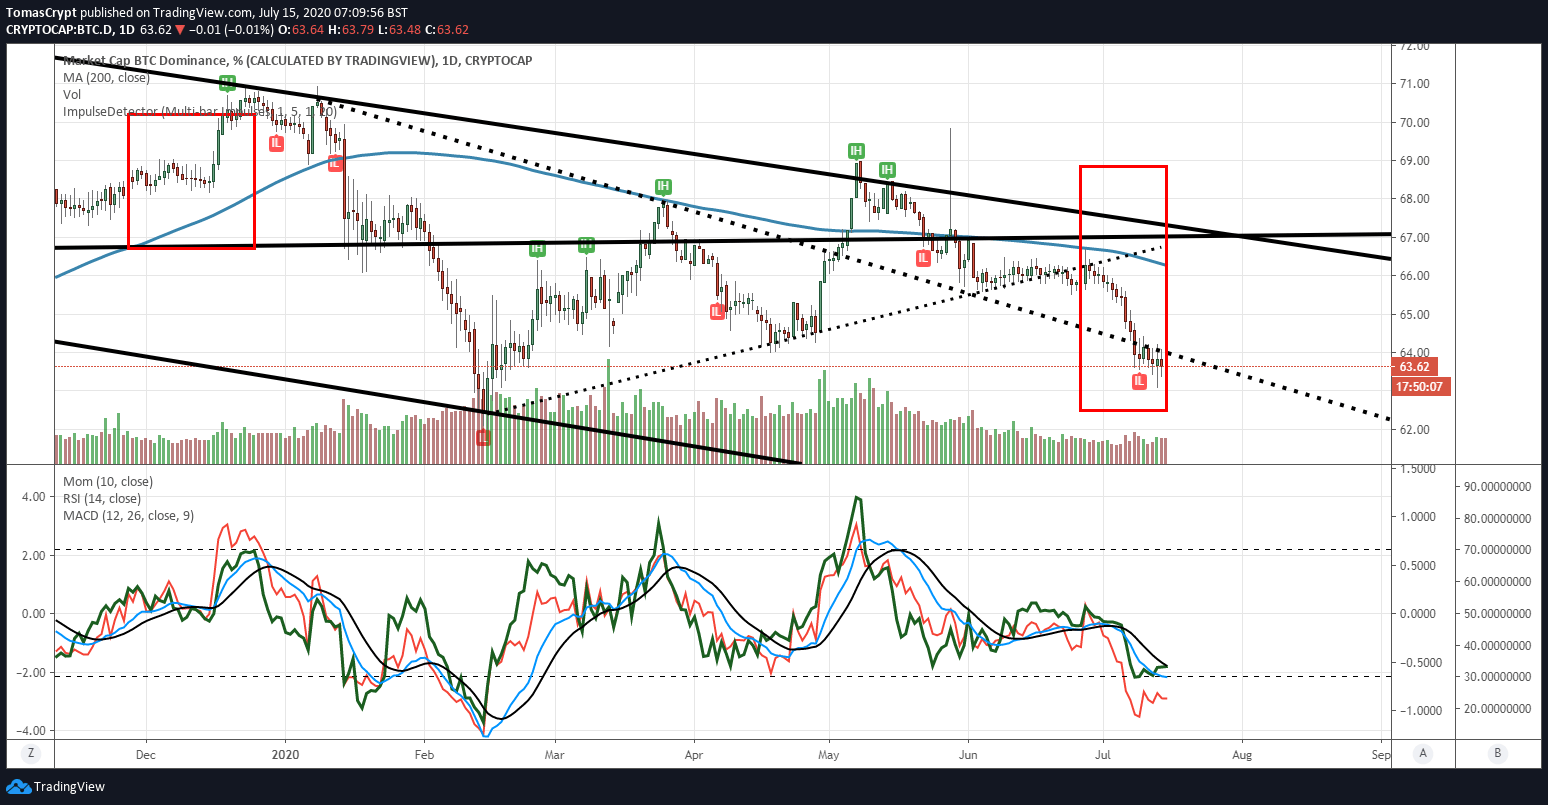
THE WAR FOR DOMINANCE
Bitcoin is failing to recover the sliding support zone above the 64.05% mark, and technical indicators are showing a possible further downward movement to the 62 levels. However, the move could extend to the 60% level.
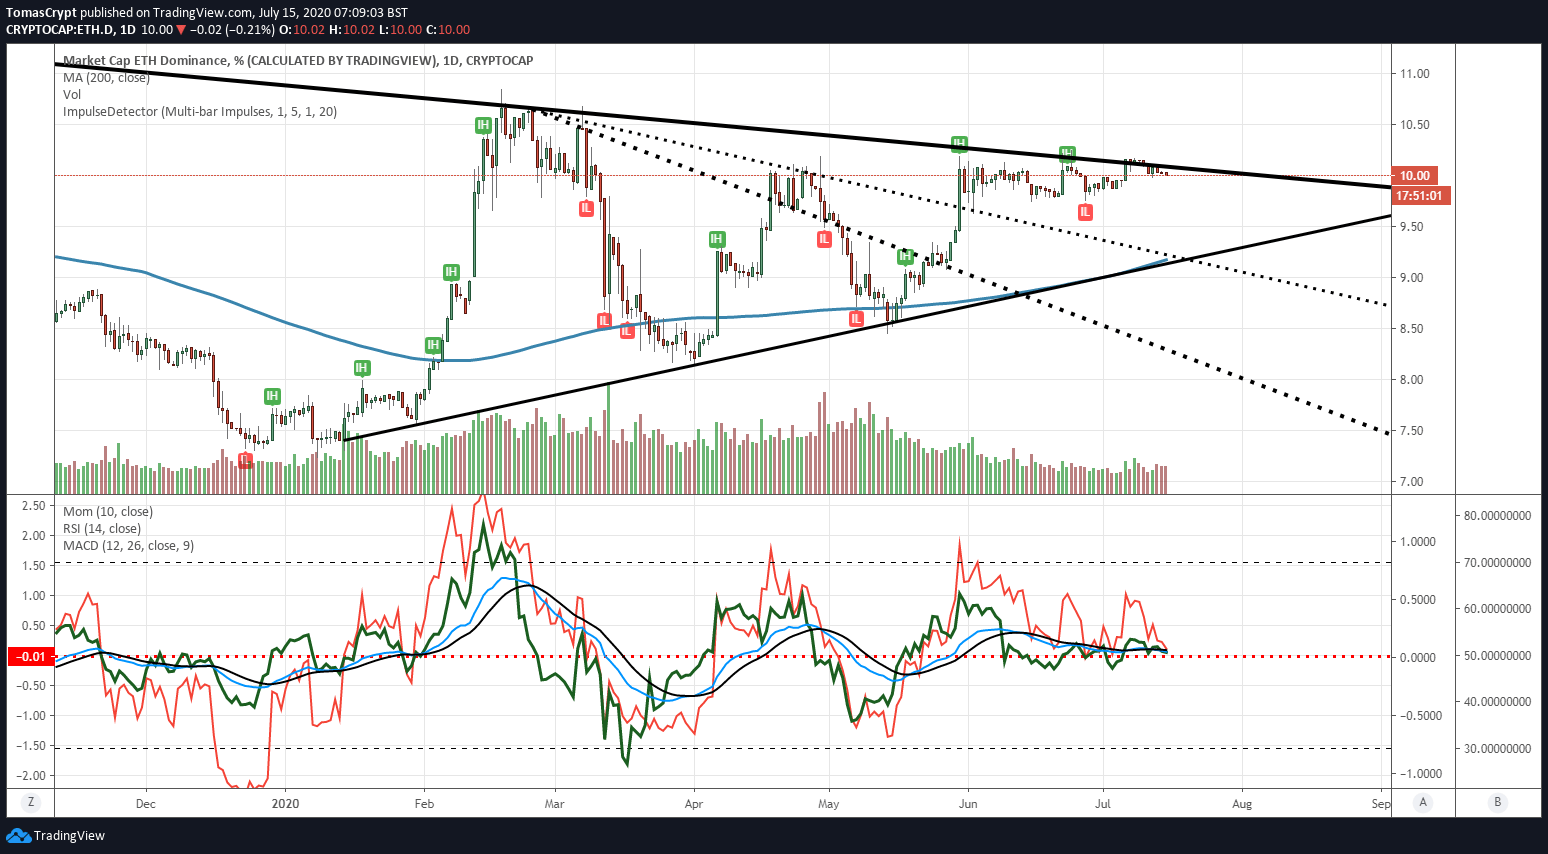
Ethereum also lost market share yesterday and stepped back into the previous bearish scenario. Below the 10.05 level, the bullish momentum disappears and enters a pause waiting for a resolution in the direction of the next move. Above the 10.10 level of dominance, the scenario would be downright bullish again for the Ethereum.
ETH/BTC Daily Chart
The ETH/BTC pair is currently trading at the price level of 0.0259, the same position as in recent weeks. The persistence in this price level allows the 200-day simple moving average to increase the bullish profile and rise rapidly.
Above the current price, the first resistance level is at 0.0276, then the second at 0.0295 and the third one at 0.0307.
Below the current price, the first support level is at 0.0258, then the second at 0.0248 and the third one at 0.023.
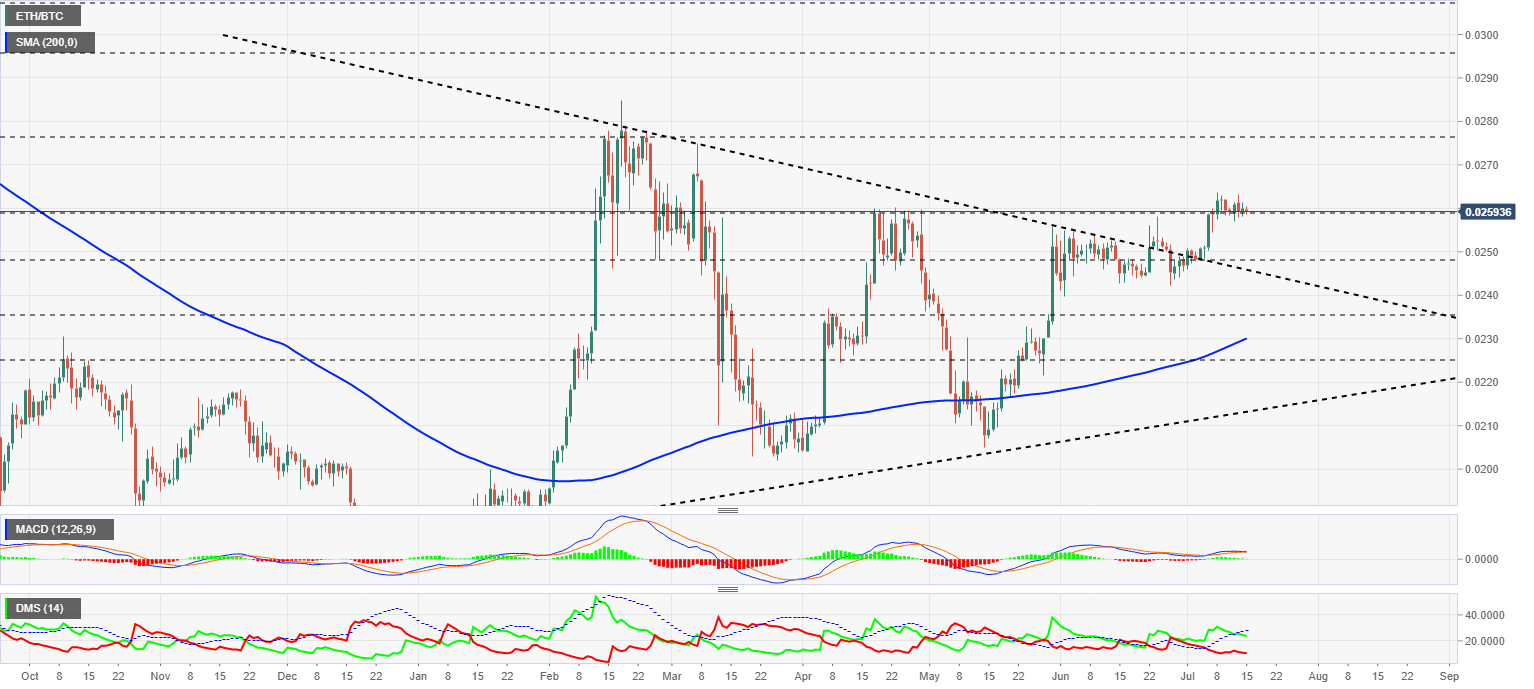
The MACD on the daily chart faithfully reflects the lack of a trend, showing a very flat profile as it moves in the bullish zone of the indicator.
The DMI on the daily chart shows the bulls are losing strength and are now entirely below the ADX line, a position that deactivates the previous bullish pattern. The bears are also losing power, accepting that the bullish trend is just a pause in the road.
BTC/USD Daily Chart
The BTC/USD pair is currently trading at the $9235 price level and replicates the passivity we have already seen in the ETH/BTC pair. The 200-day simple moving average is gaining momentum and is moving very fast towards the $9000 level.
Above the current price, the first resistance level is at $9500, then the second at $10500 and the third one at $11400.
Below the current price, the first support level is at $8850, then the second at $8750 and the third one at $8500.
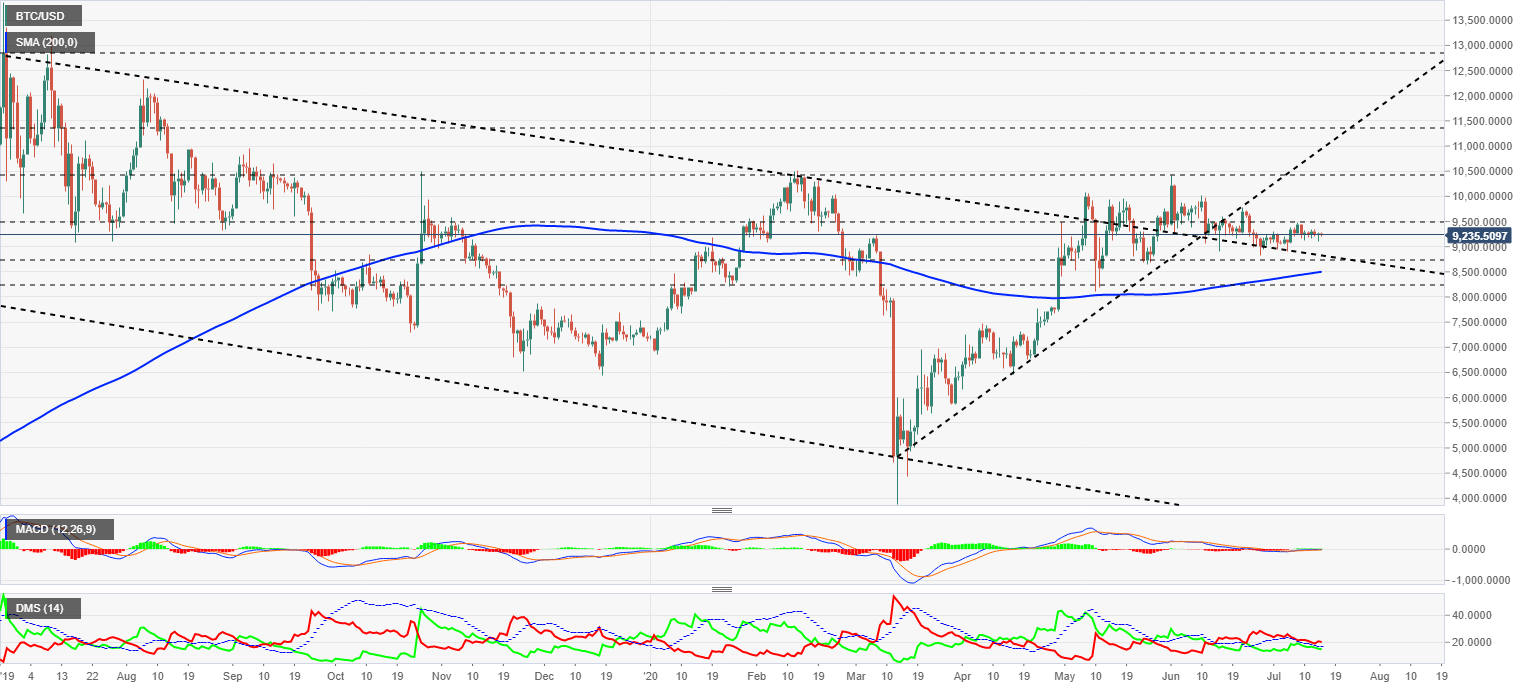
The MACD on the daily chart shows an entirely flat profile that rests on the zero levels of the indicator. This no-strengthening setup usually resolved with a sharp movement in the price.
The DMI on the daily chart shows bears leading the pair, but with a slight advantage. The bulls are keeping the optimal attacking distance from the bears, so a bullish surprise is likely.
ETH/USD Daily Chart
The ETH/USD pair is currently trading at $239 and again reflects the lack of direction among market leaders. The 200-day simple moving average is exacerbating the bullish profile and is already moving at the $200 level.
Above the current price, the first resistance level is at $246, then the second at $260 and the third one at $270.
Below the current price, the first support level is at $230, then the second at $220 and the third one at $200.
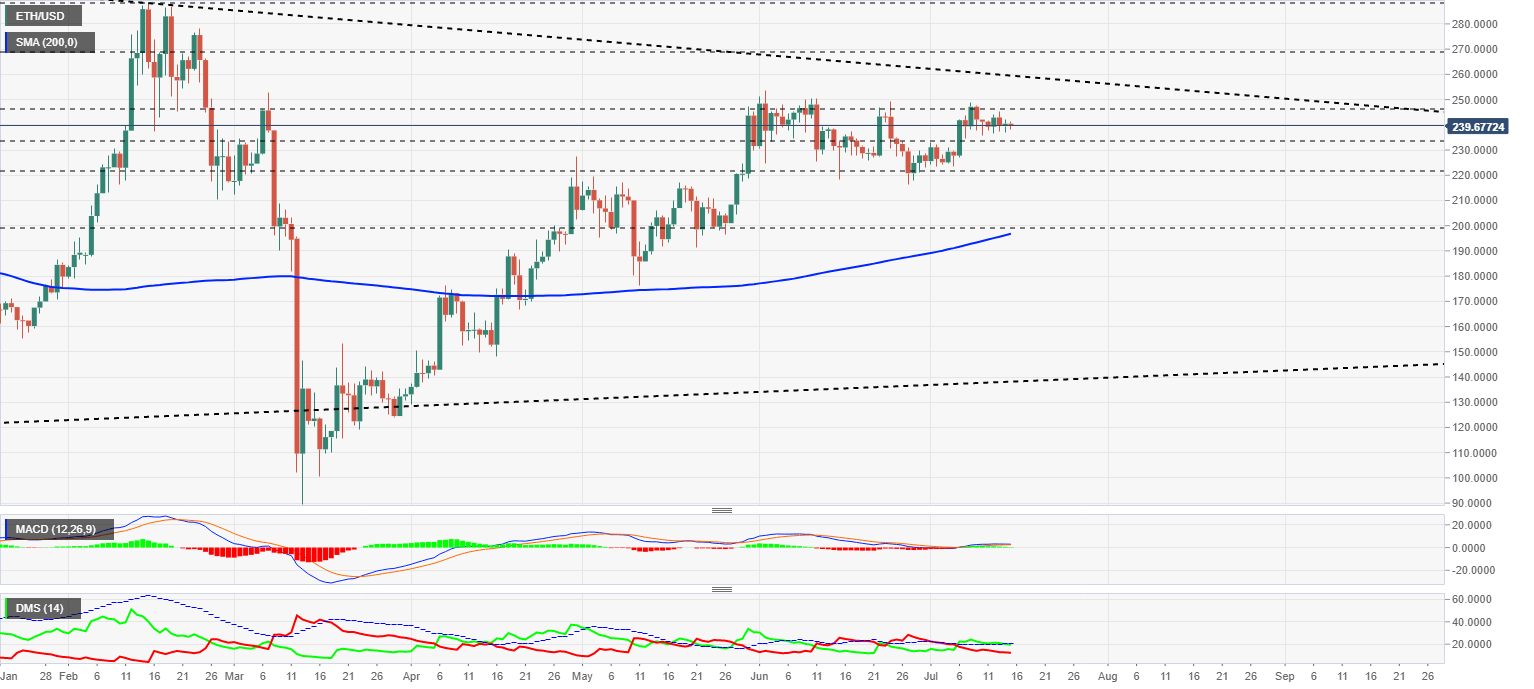
The MACD on the daily chart shows a very flat profile within the bullish zone of the indicator. The structure of the moving averages does not provide visibility over any time frame.
The DMI on the daily chart shows the bulls resisting to lose the support of the ADX line, so the bullish pattern continues to be active. Bears continue to lose strength for another day.
XRP/USD Daily Chart
The XRP/USD pair is currently trading at the price level of $0.1987 and is missing the critical support level of $0.20 that it did manage to hold yesterday. Below the $0.20 level, a bearish chasm opens up with unpredictable consequences.
Above the current price, the first resistance level is at $0.20, then the second at $0.202 and the third one at $0.209.
Below the current price, the first support level is at $0.184, then the second at $0.175 and the third one at $0.163.
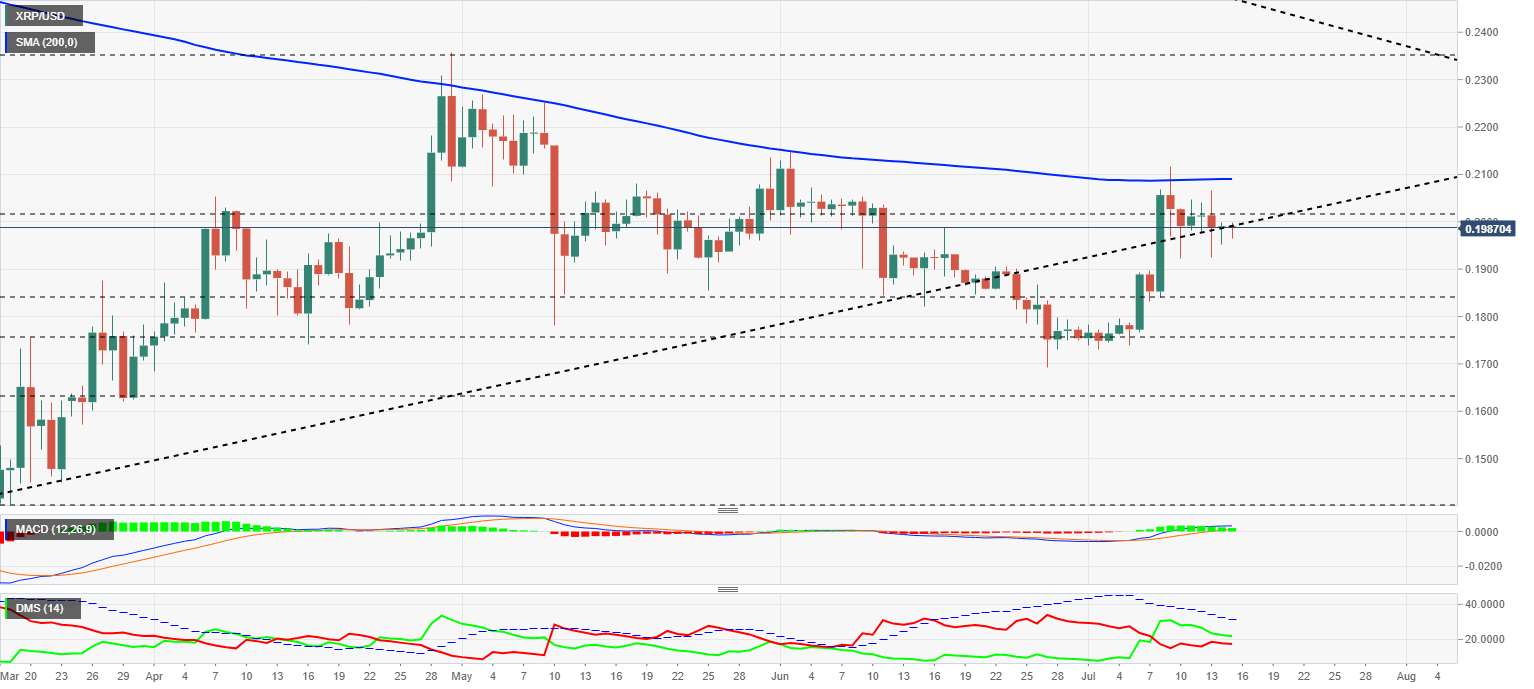
The MACD on the daily chart is already moving in the bullish zone of the indicator and maintains the separation between its moving averages. Maintaining this separation indicates that the previous trend – upward – is still in place.
The DMI on the daily chart shows that the bulls are leading by the shortest distance on the XRP/USD. The bears are moving very close to the bulls and could easily take control.
Author

Tomas Salles
FXStreet
Tomàs Sallés was born in Barcelona in 1972, he is a certified technical analyst after having completing specialized courses in Spain and Switzerland. He expanded his technical training following the guidance of great experts on the financial markets.


