Top 3 Price Prediction Bitcoin, Ethereum, Ripple: BTC stabilizes while ETH and XRP show weakness
- Bitcoin price hovers around $87,000 on Friday; RSI indicates indecisiveness among traders.
- Ethereum price hovers around $2,000 after correcting 3.73% in the last three days.
- XRP is retesting its 100-day EMA at $2.31; a firm close below would indicate a further correction.

Bitcoin (BTC) price stabilizes at around $87,000 on Friday, as its RSI indicates indecisiveness among traders. However, Ethereum (ETH) and Ripple (XRP) show signs of weakness as they face resistance around their key levels and face a pullback this week.
Bitcoin’s RSI indicator flatlines, suggesting indecisiveness among traders
Bitcoin price broke and closed above its 200-day Exponential Moving Average (EMA) at around $85,580 on Sunday and rose 4.45% until Monday. However, BTC stabilized around $87,000 over the next three days and found support around its 200-day EMA. At the time of writing on Friday, it hovers around $87,000, slightly below its descending trendline (drawn by connecting multiple high levels since mid-January).
If the 200-day holds as support and BTC breaks and closes above the descending trendline, it could extend the recovery to retest the key psychological level of $90,000. A successful close above this level could extend an additional rally toward its March 2 high of $95,000.
The RSI on the daily chart reads 51, floating around its neutral level of 50 since Monday, indicating indecisiveness among the traders. For the bullish momentum to be sustained, the RSI must point upward and move above its neutral level of 50.
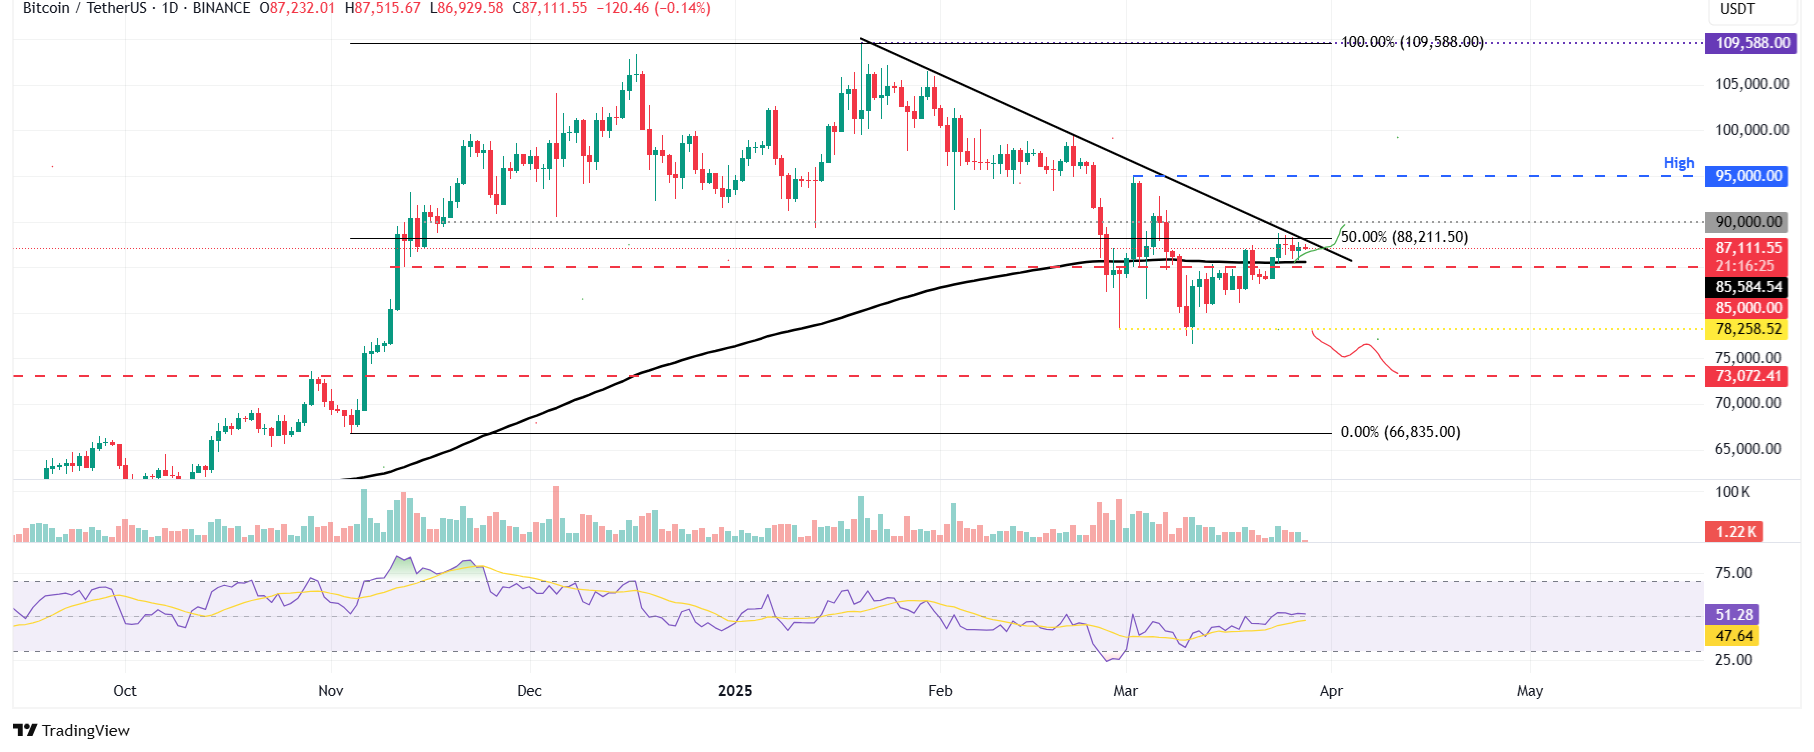
BTC/USDT daily chart
However, if BTC faces a rejection from the descending trendline and closes below the 200-day EMA, it could extend the decline to retest its next support level at $78,258.
Ethereum shows signs of weakness
Ethereum price retested and found support around its daily level of $1,861 for the last two weeks, and it recovered nearly 7% last week. ETH continued its recovery on Monday and closed above $2,081. However, it faced a correction of almost 4% for three consecutive days. At the time of writing on Friday, it continues to decline, trading below $2,000.
If ETH continues to face a pullback, it could extend the decline to retest its daily support at $1,861.
The RSI on the daily chart reads 43, facing rejection from its neutral level of 50 on Monday, indicating bearish momentum.
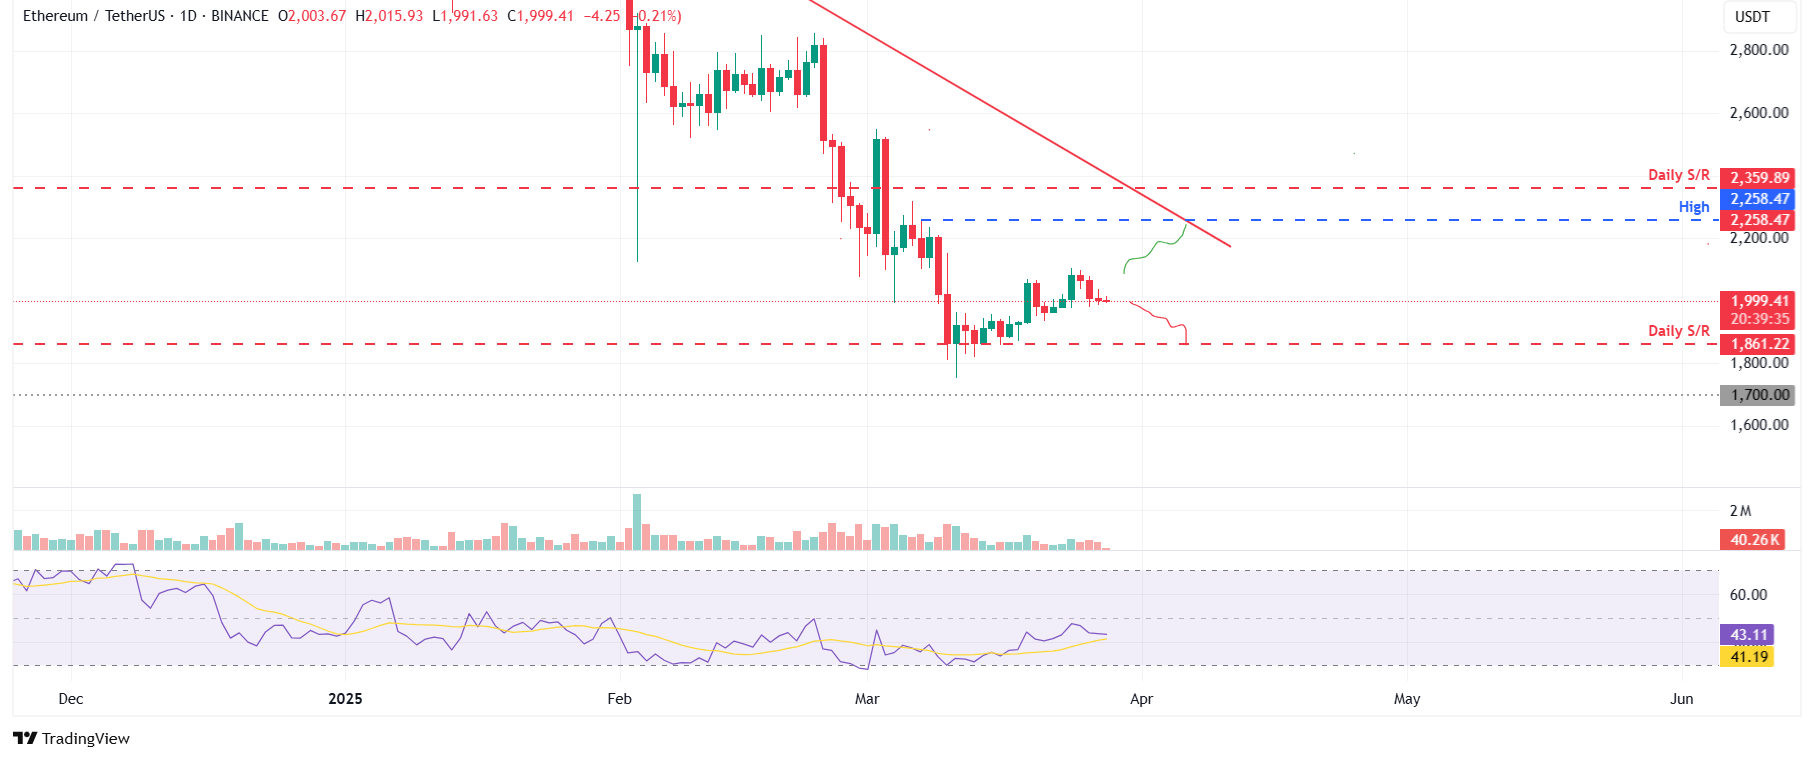
ETH/USDT daily chart
Conversely, if it continues to recover, it could extend the recovery to retest its March 7 high of $2,258.
Ripple price could face a downleg if it closes below its 100-day EMA
Ripple price broke above its 100-day EMA at $2.32 last week and recovered almost 7%. However, XRP faced a pullback on Tuesday and declined 5.74% until Thursday. At the time of writing on Friday, it continues to decline, approaching its 100-day EMA of around $2.31.
If XRP fails to find support around its 100-day EMA and closes below it, it could extend an additional decline to test its next support level at $1.96.
The RSI on the daily chart reads 46, slipping below its neutral level of 50 earlier this week, indicating bearish momentum.
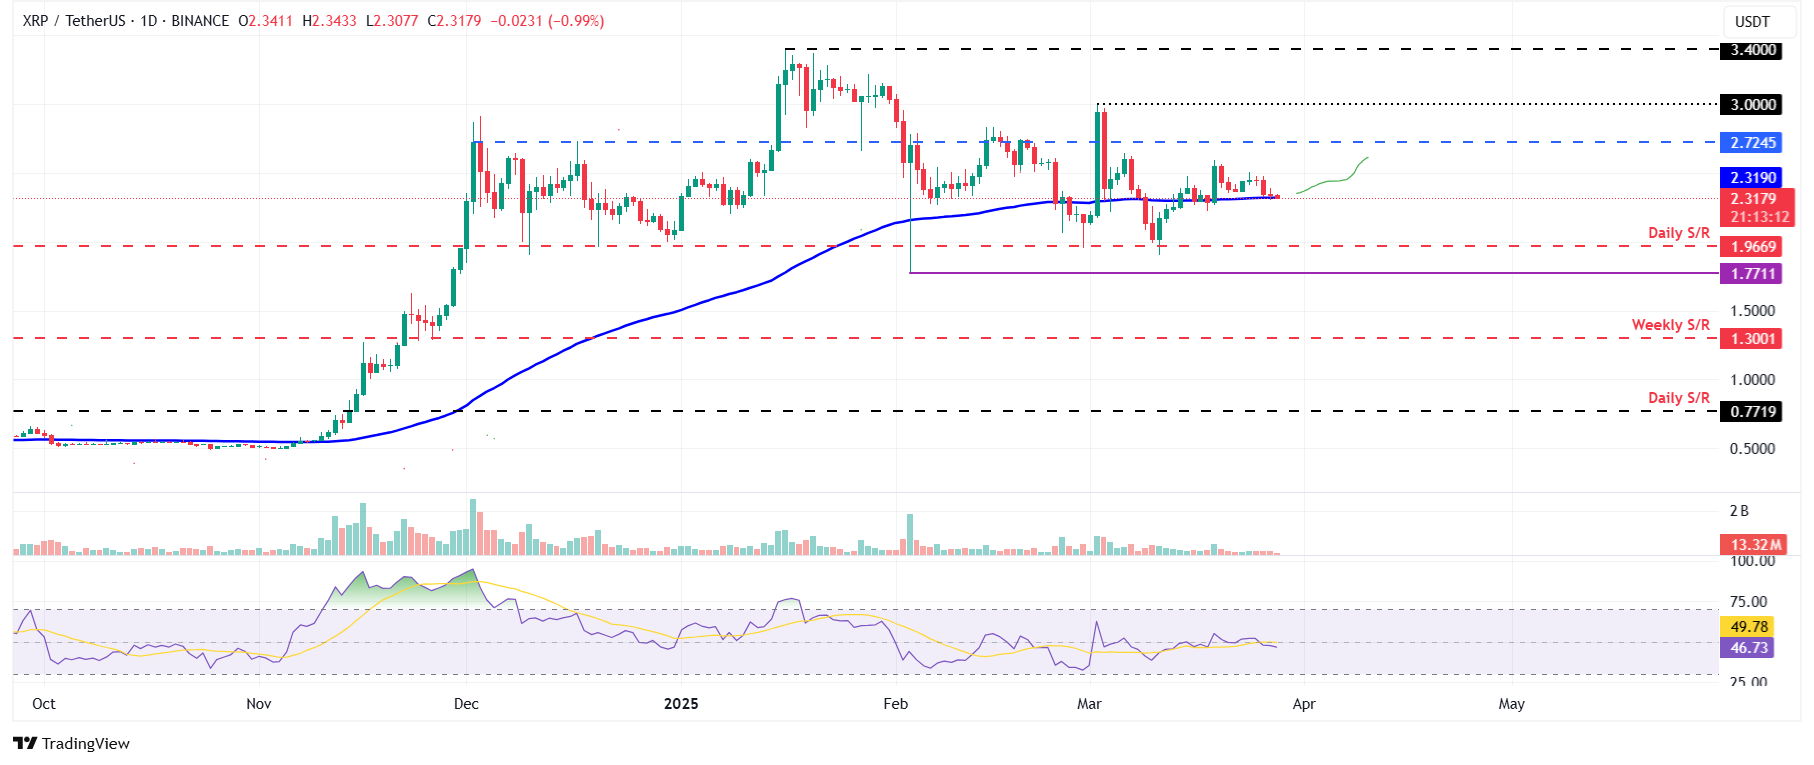
XRP/USDT daily chart
On the other hand, if the 100-day EMA around $2.32 continues to hold, it could extend the recovery to retest its next resistance level at $2.72.
Bitcoin, altcoins, stablecoins FAQs
Bitcoin is the largest cryptocurrency by market capitalization, a virtual currency designed to serve as money. This form of payment cannot be controlled by any one person, group, or entity, which eliminates the need for third-party participation during financial transactions.
Altcoins are any cryptocurrency apart from Bitcoin, but some also regard Ethereum as a non-altcoin because it is from these two cryptocurrencies that forking happens. If this is true, then Litecoin is the first altcoin, forked from the Bitcoin protocol and, therefore, an “improved” version of it.
Stablecoins are cryptocurrencies designed to have a stable price, with their value backed by a reserve of the asset it represents. To achieve this, the value of any one stablecoin is pegged to a commodity or financial instrument, such as the US Dollar (USD), with its supply regulated by an algorithm or demand. The main goal of stablecoins is to provide an on/off-ramp for investors willing to trade and invest in cryptocurrencies. Stablecoins also allow investors to store value since cryptocurrencies, in general, are subject to volatility.
Bitcoin dominance is the ratio of Bitcoin's market capitalization to the total market capitalization of all cryptocurrencies combined. It provides a clear picture of Bitcoin’s interest among investors. A high BTC dominance typically happens before and during a bull run, in which investors resort to investing in relatively stable and high market capitalization cryptocurrency like Bitcoin. A drop in BTC dominance usually means that investors are moving their capital and/or profits to altcoins in a quest for higher returns, which usually triggers an explosion of altcoin rallies.
Author

Manish Chhetri
FXStreet
Manish Chhetri is a crypto specialist with over four years of experience in the cryptocurrency industry.


