Top 3 Price Prediction Bitcoin, Ethereum, Ripple: BTC leads $100 billion market capitalization recovery
- Bitcoin price saw a 10% rebound from its low at $50,931 and the entire market had a significant recovery.
- Ethereum price is closer to all-time highs and has outperformed BTC.
- XRP is fighting to stay above a critical resistance level on the daily chart.

The total cryptocurrency market capitalization had a steep drop on April 17 from $2.27 trillion to a low of $1.9 trillion, losing more than $300 billion in just 24 hours. Bitcoin has lost some of its market dominance in the last week but continues to influence the entire sector.
Bitcoin price to trigger significant leg down if key level breaks
On the daily chart, Bitcoin is trading inside an ascending wedge pattern and it is close to losing the lower trend line support level at $55,400.
A daily candlestick close below $55,400 would confirm a breakdown that has a long-term price target of $42,000.
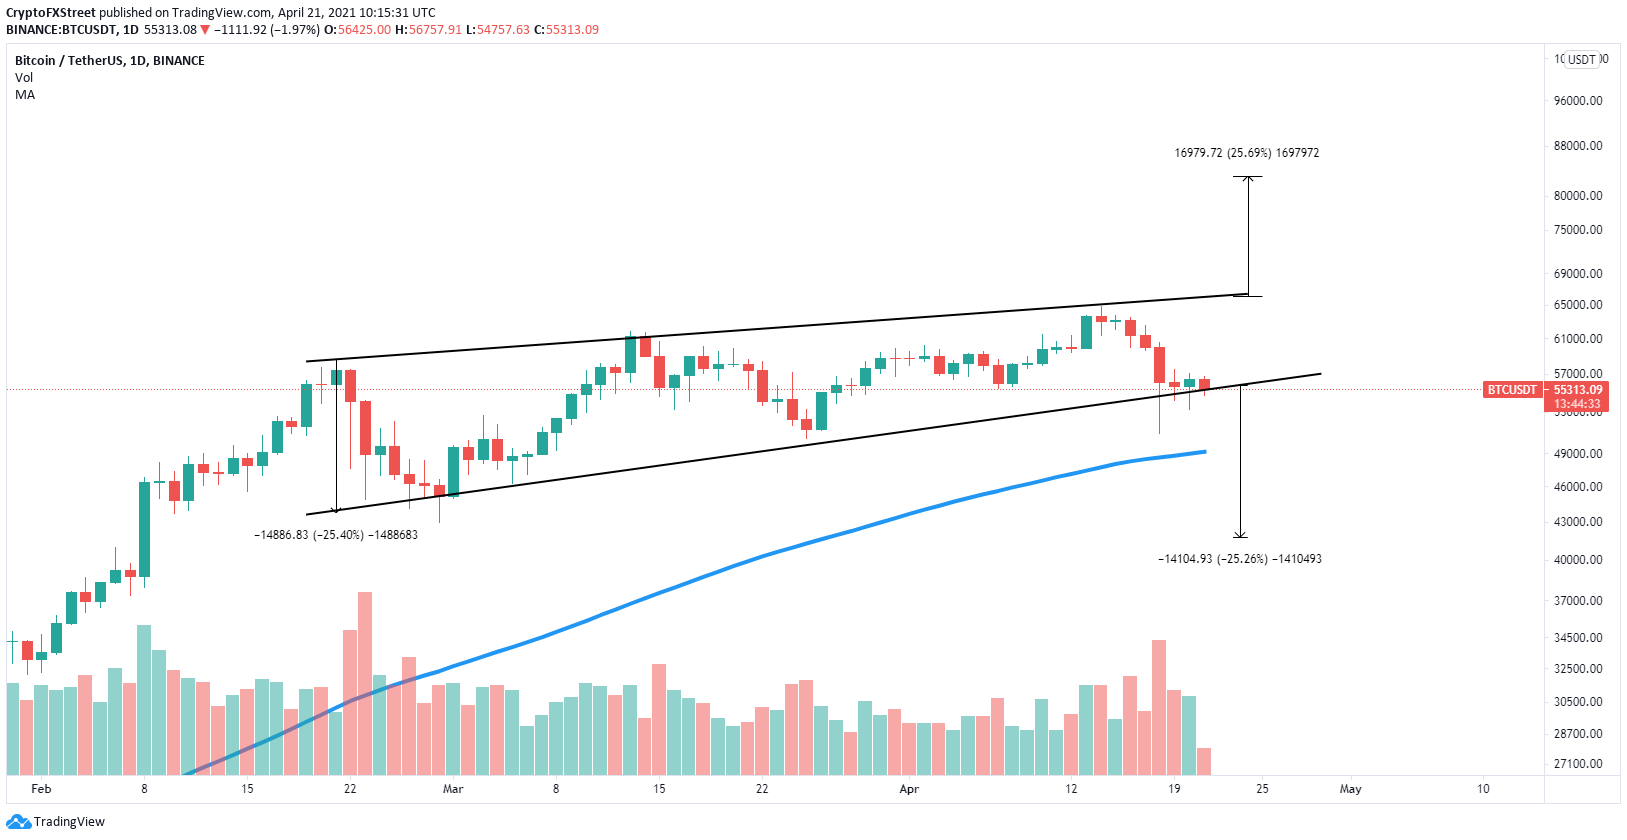
BTC/USD daily chart
The initial price target of the bears would be the psychological level at $50,000 and then the 100 SMA support on the daily chart located at $49,000.
However, if the bulls can hold the lower boundary support, BTC could quickly jump toward the upper trend line at $66,120, which would be a new all-time high. A breakout of this point has a long-term price target of $83,000.
The percentage of BTC coins inside exchanges has sharply dropped in the last week despite a significant correction
%20[14.30.21,%2021%20Apr,%202021]-637546006235210851.png)
BTC Supply on Exchanges
Since April 14, this percentage dropped by 0.52%, which is significant and the lowest value since June 2019. This indicates that investors are not interested in selling despite prices dropping, adding credence to the bullish outlook.
Ethereum price remains on the path to $3,000
On the daily chart, Ethereum had a breakout from an ascending wedge pattern on April 13 and successfully defended the previous resistance trend line.
The digital asset is now bouncing toward the pattern’s long-term price target at $2,850, with some resistance at $2,550.
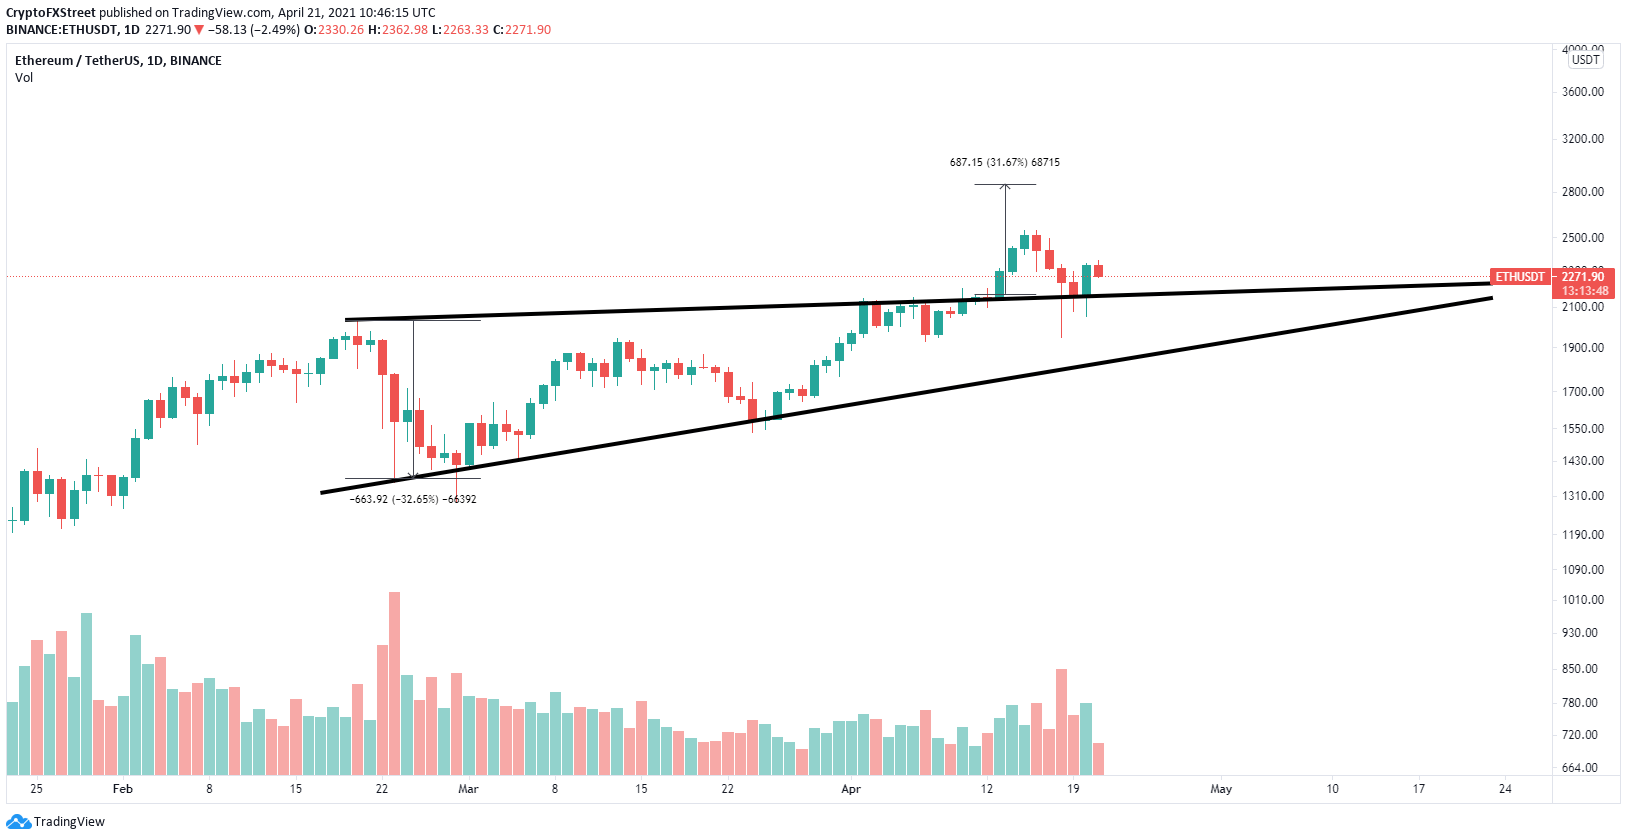
ETH/USD daily chart
On the other hand, the In/Out of the Money Around Price (IOMAP) chart shows only one crucial support area between $2,200 and $2,258 where 421,000 addresses purchased over 11 million ETH.
Losing this critical point would be a notable bearish breakdown and can easily drive Ethereum price down to $2,000 and even as low as $1,900.
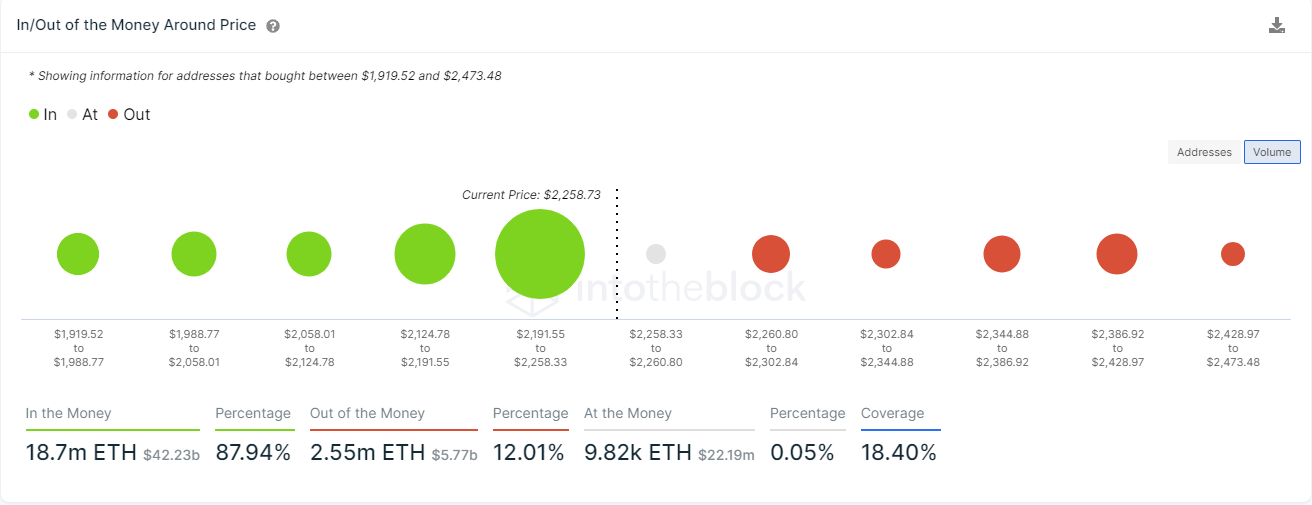
ETH IOMAP chart
XRP price losing its bullish momentum
The digital asset is trying to remain above a crucial support level on the 4-hour chart. The 100 SMA at $1.31 must hold, otherwise, XRP can quickly fall down to $1.24 at the 50% Fibonacci retracement level.
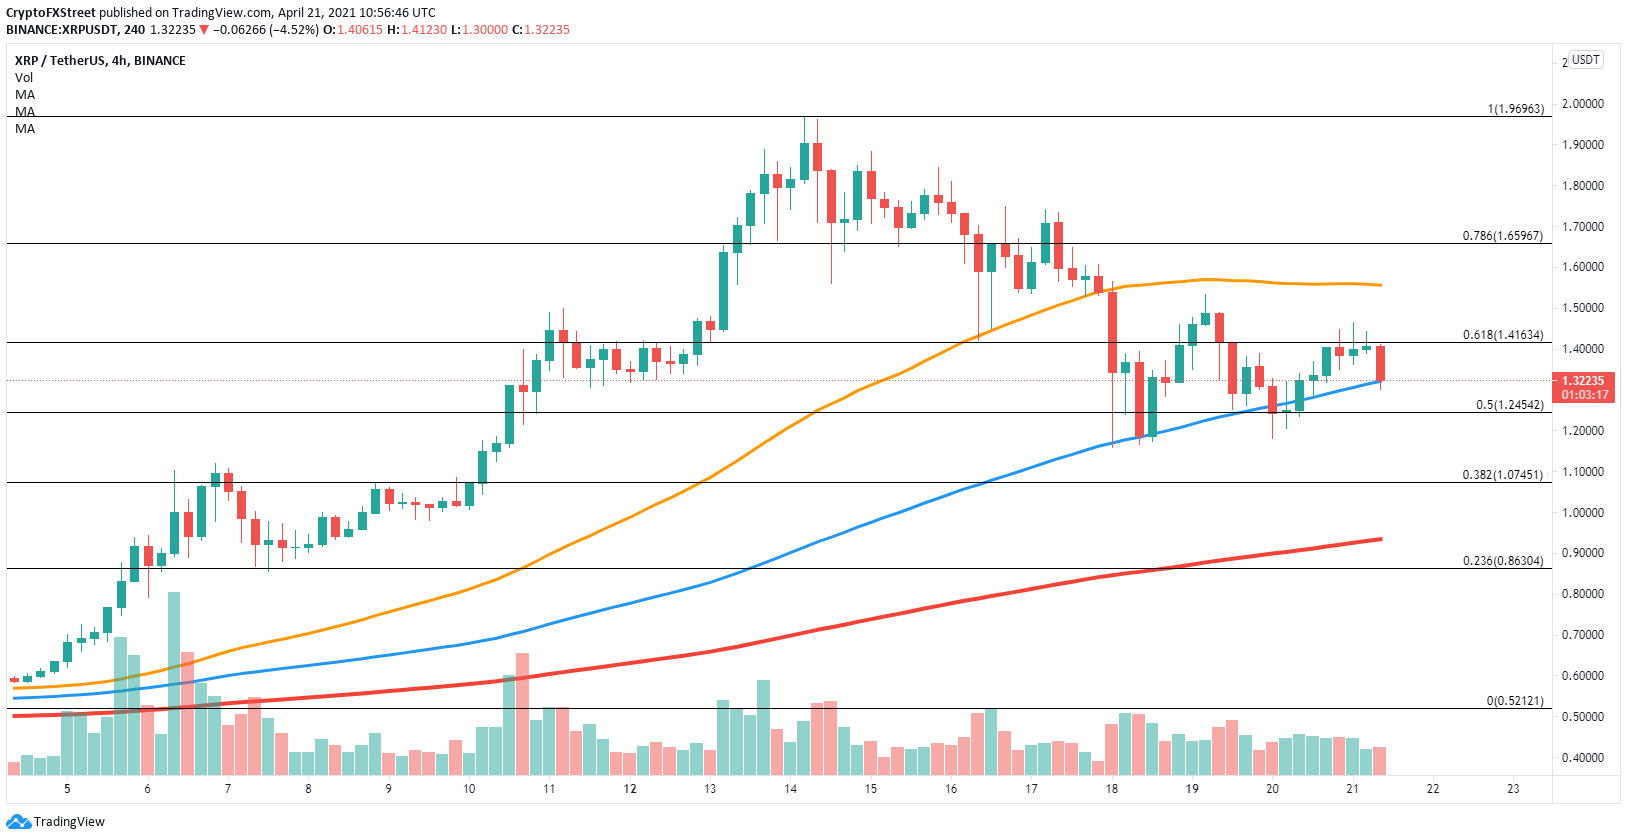
XRP/USD 4-hour chart
XRP could also drop toward $1.07 at the 38.2% Fibonacci level, $0.92 which is the 200 SMA, and $0.86 at the 23.6% level.
On the other hand, successfully defending the 100 SMA should push Ripple toward the 61.8% Fibonacci level at $1.41 and even to $1.55 at the 50 SMA.
Author

Lorenzo Stroe
Independent Analyst
Lorenzo is an experienced Technical Analyst and Content Writer who has been working in the cryptocurrency industry since 2012. He also has a passion for trading.


