Top 3 Price Prediction: Bitcoin, Ethereum, Ripple – BTC, ETH, and XRP pause after strong rallies
- Bitcoin price hovers around $121,000 on Friday, falling slightly after reaching a new all-time high early this week.
- Ethereum price closes below $4,488 support, signaling a correction ahead.
- XRP faces rejection from the upper trendline boundary, correcting more than 5% so far this week.

Bitcoin (BTC) trades around $121,000 at the time of writing on Friday, facing a slight pullback after reaching a record high this week. Ethereum (ETH) and Ripple (XRP) followed BTC’s footsteps and faced correction, closing below their key support levels, suggesting further downside risks.
Bitcoin could decline further if it closes below $120,000
Bitcoin price reached a new all-time high (ATH) of $126,199 on Monday, but failed to maintain the upward momentum and declined over 2% until Thursday, retesting the $120,000 support level. At the time of writing on Friday, it hovers at around $121,000.
If BTC continues its correction and closes below $120,000, it could extend the decline toward the next daily support level at $116,000.
The Relative Strength Index (RSI) on the daily chart reads 58 after falling from the overbought conditions on Monday, indicating a potential slowdown in bullish momentum and the likelihood of short-term consolidation.
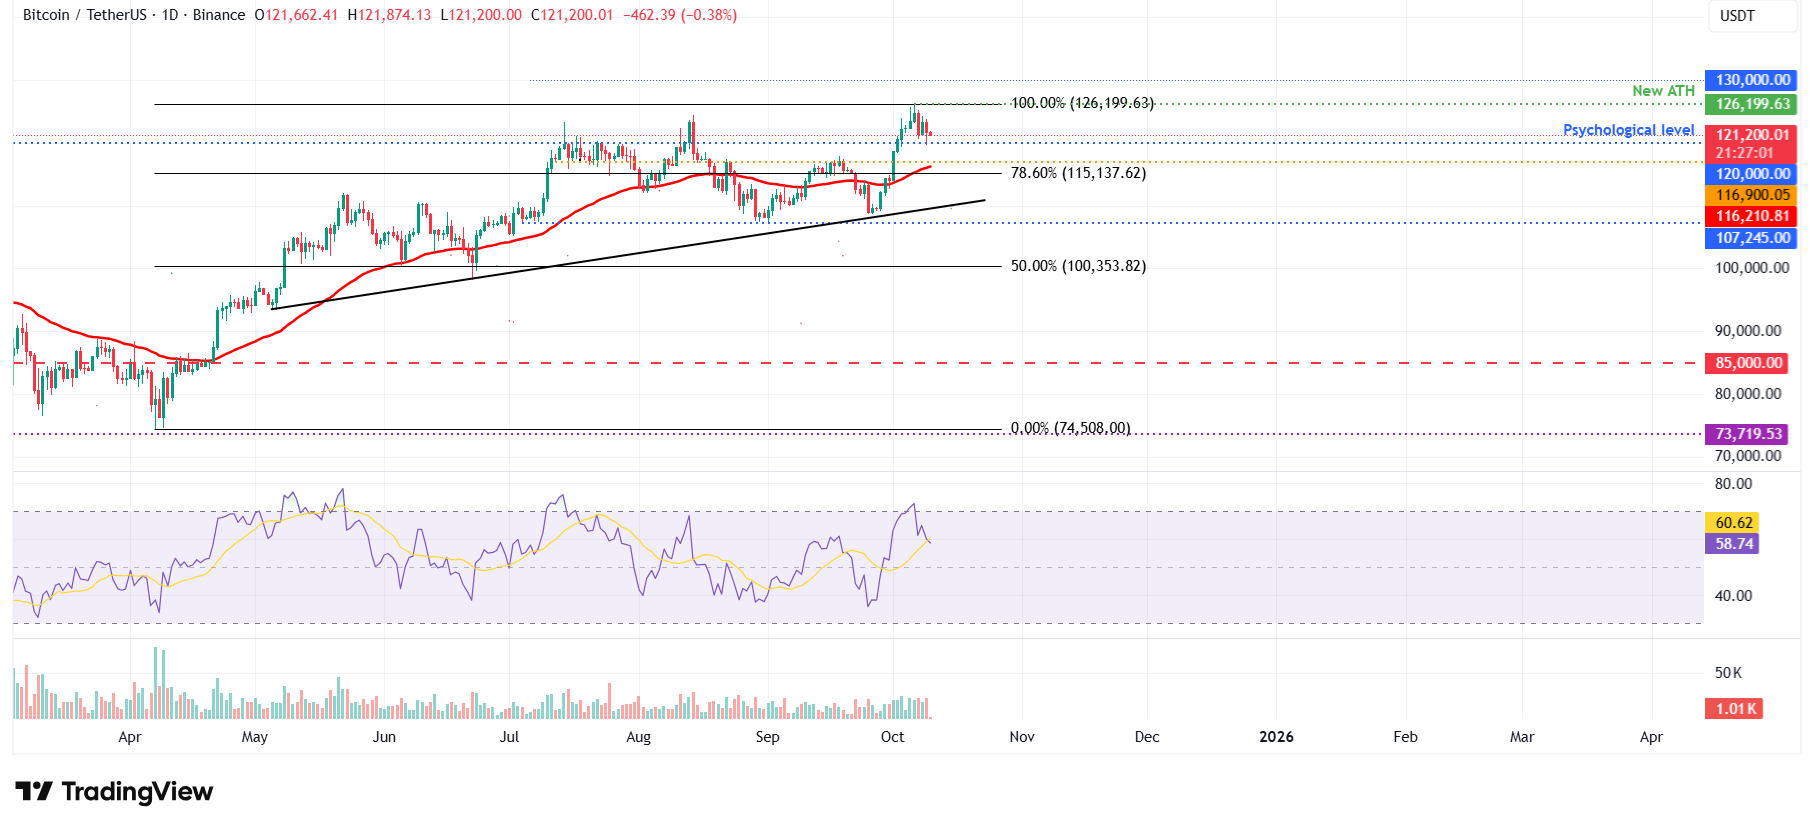
BTC/USDT daily chart
However, if the $120,000 holds as support and BTC maintains its upward momentum, it could extend the rally toward the record high of $126,199.
Ethereum fails to close above the $4,488 level, signaling weakness
Ethereum price closed above the $4,488 resistance level last week, and found support around it and rose by 4.5% in the next three days. However, on Tuesday, ETH corrected 5%, closed below the $4,488 level, and continued its pullback by Thursday. At the time of writing on Friday, it hovers at around $4,370.
If ETH continues its pullback, it could extend the decline toward the next daily support at $4,232.
The RSI on the daily chart is slipping below the neutral level of 50, indicating bearish momentum is gaining traction.
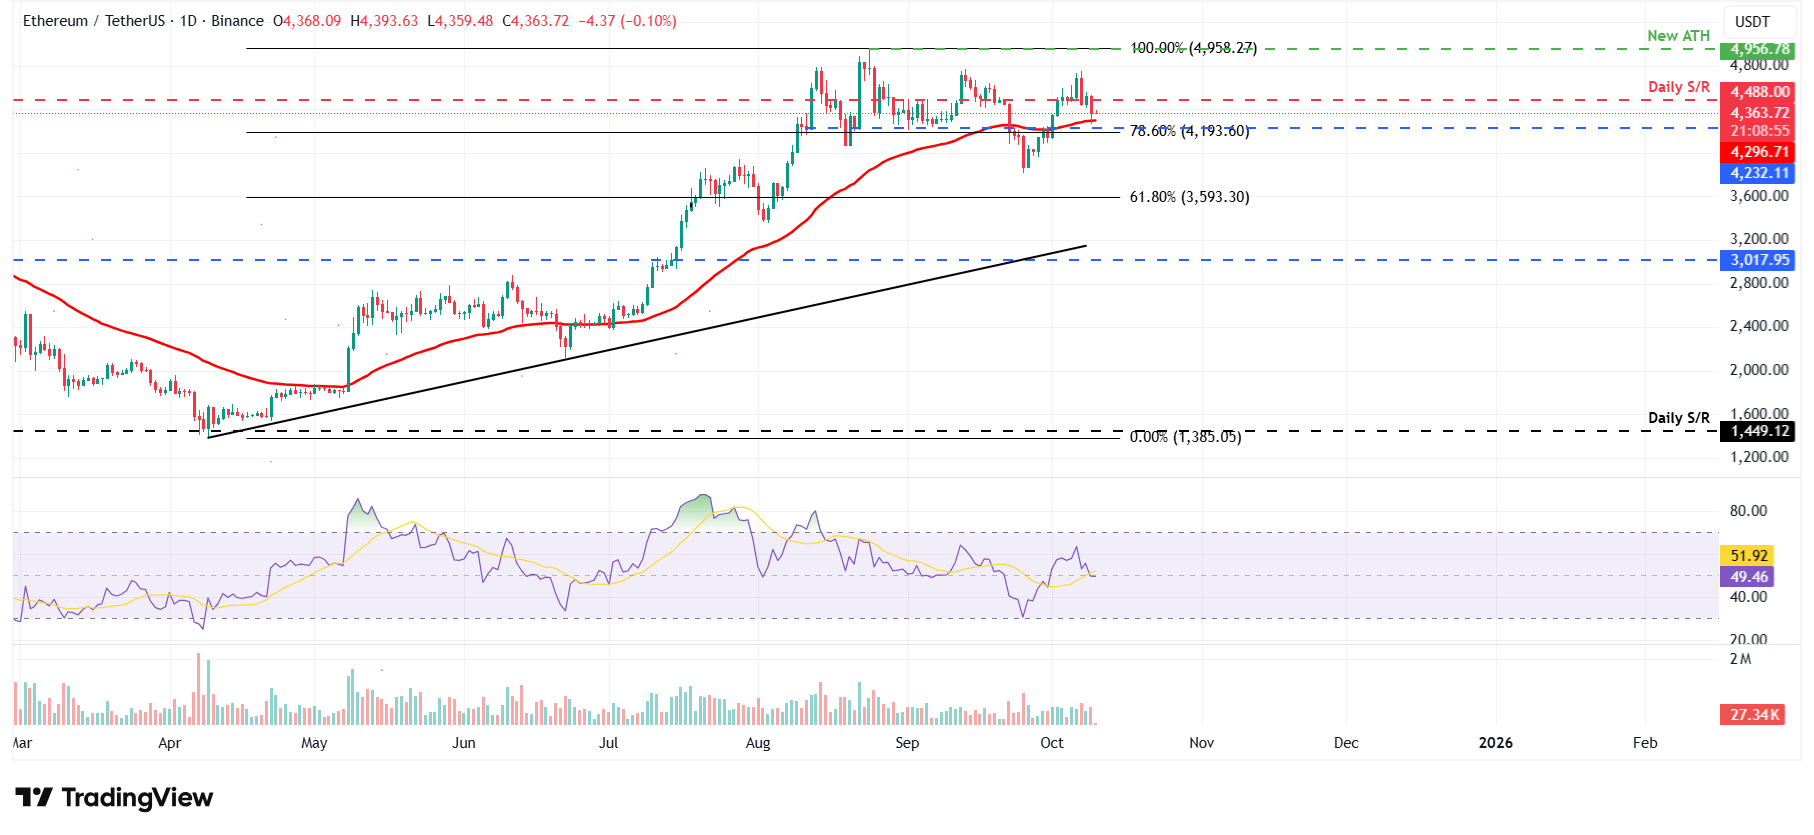
ETH/USDT daily chart
However, if ETH breaks above the $4,488 level and finds support around it, the rally could extend toward the all-time high at $4,956.
XRP closes below the 100-day EMA
Ripple price faced rejection from the upper trendline boundary on October 3 and declined 8% by Thursday, closing below the 100-day Exponential Moving Average (EMA) at $2.85. At the time of writing on Friday, it trades at around $2.79.
If XRP continues its correction, it could extend the decline toward the daily support at $2.72.
The RSI on the daily chart reads 41 below the neutral level of 50, indicating bearish momentum is gaining traction. Moreover, the Moving Average Convergence Divergence (MACD) indicator showed a bearish crossover on Wednesday, giving sell signals and further supporting the bearish view.
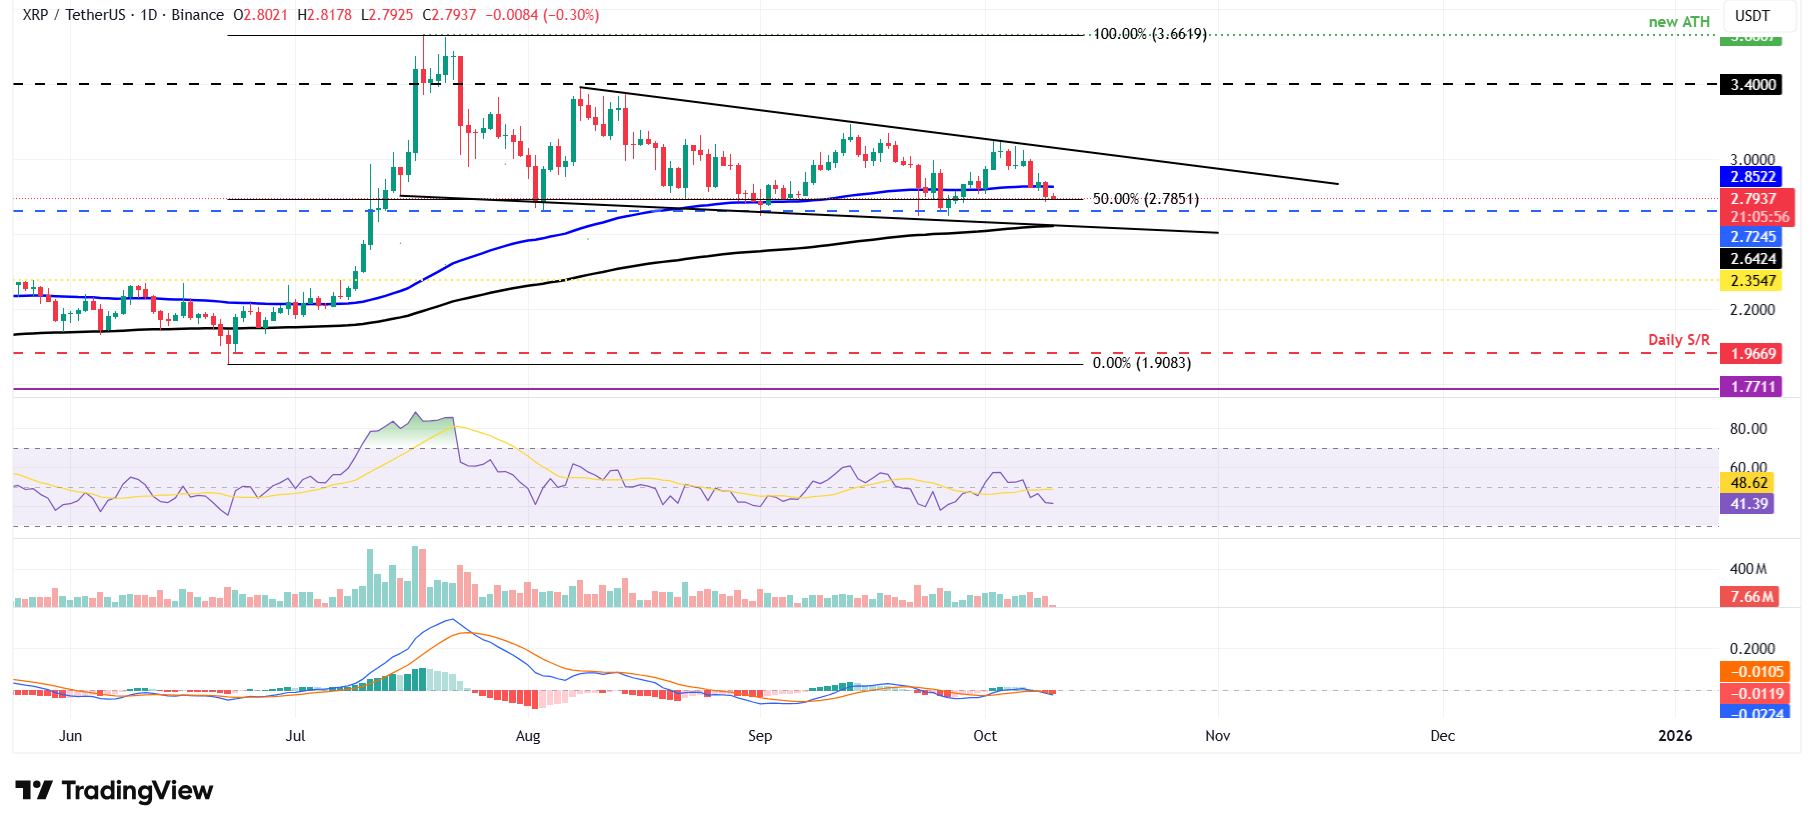
XRP/USDT daily chart
However, if XRP recovers, it could extend the rally toward the key psychological level at $3.
Cryptocurrency metrics FAQs
The developer or creator of each cryptocurrency decides on the total number of tokens that can be minted or issued. Only a certain number of these assets can be minted by mining, staking or other mechanisms. This is defined by the algorithm of the underlying blockchain technology. On the other hand, circulating supply can also be decreased via actions such as burning tokens, or mistakenly sending assets to addresses of other incompatible blockchains.
Market capitalization is the result of multiplying the circulating supply of a certain asset by the asset’s current market value.
Trading volume refers to the total number of tokens for a specific asset that has been transacted or exchanged between buyers and sellers within set trading hours, for example, 24 hours. It is used to gauge market sentiment, this metric combines all volumes on centralized exchanges and decentralized exchanges. Increasing trading volume often denotes the demand for a certain asset as more people are buying and selling the cryptocurrency.
Funding rates are a concept designed to encourage traders to take positions and ensure perpetual contract prices match spot markets. It defines a mechanism by exchanges to ensure that future prices and index prices periodic payments regularly converge. When the funding rate is positive, the price of the perpetual contract is higher than the mark price. This means traders who are bullish and have opened long positions pay traders who are in short positions. On the other hand, a negative funding rate means perpetual prices are below the mark price, and hence traders with short positions pay traders who have opened long positions.
Author

Manish Chhetri
FXStreet
Manish Chhetri is a crypto specialist with over four years of experience in the cryptocurrency industry.


