Top 3 Price Prediction Bitcoin, Ethereum, Ripple: BTC, ETH and XRP may decline 50%
- Bitcoin price releases to the upside from a bear pennant pattern before quickly reversing.
- Ethereum price defines a bear pennant pattern that is triggering to the downside today.
- XRP price holding the lower trend line of a bear flag pattern.

Bitcoin price flashes bull trap as bearish pennant attempts to resolve to the upside with limited commitment and emotion. Ethereum price falls short of the double bottom trigger after closing May with a long-legged doji pattern. XRP price fails to maintain the psychologically important $1.00 and now projects notable downside for the international settlements token.
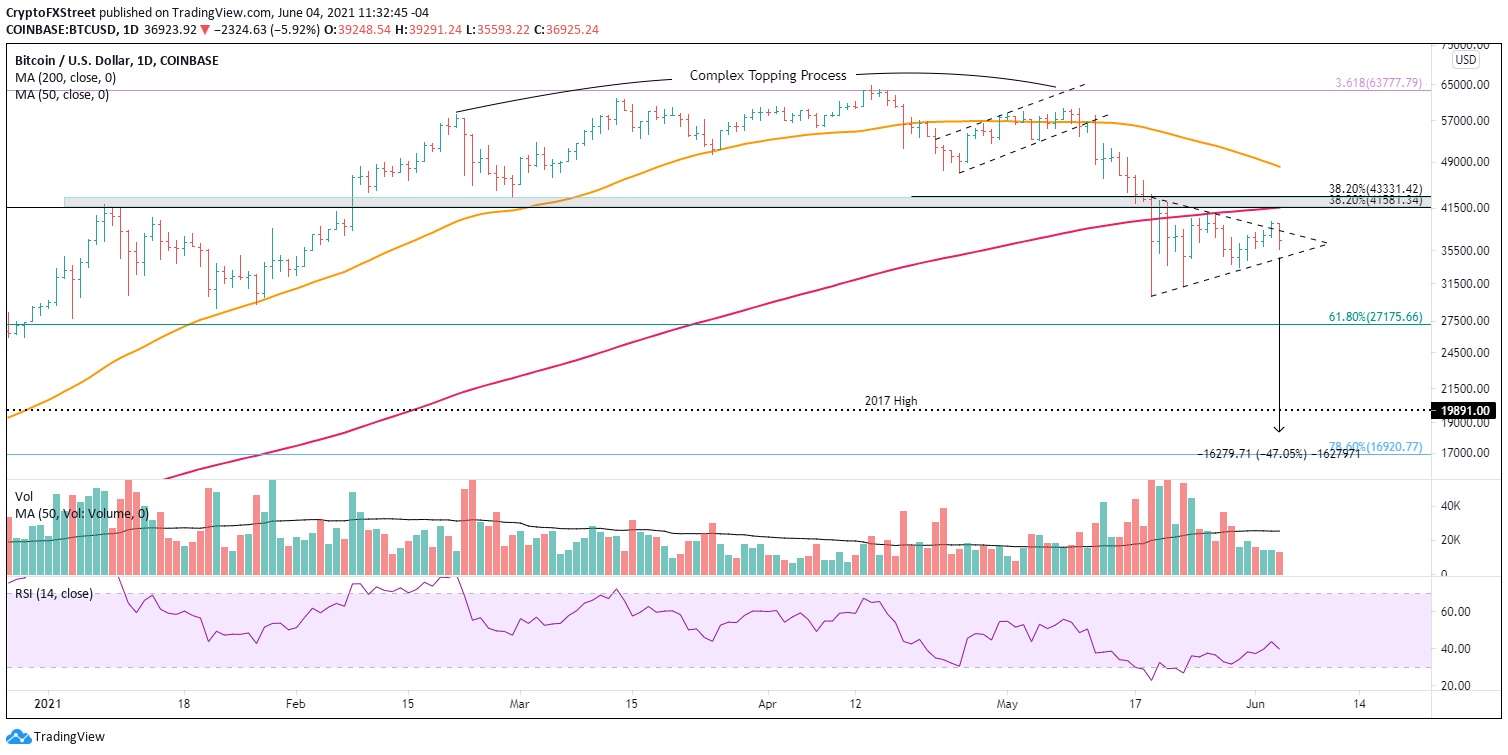
Bitcoin price unable to capture investor attention
Bitcoin price had been defining a bearish pennant pattern on the daily chart since May 19, before attempting a breakout to the upside yesterday. Today, the breakout was quickly reversed, creating a bull trap and raising the odds that BTC is now primed to sell through the pennant’s lower trend line at $34,603.
The attempted breakout emerged with Bitcoin price at more than 80% of the horizontal distance from the base to the apex, indicating a weaker pattern or less robust continuation. Based on historical precedent, the best price thrusts develop when price is between half and three-quarters of the horizontal distance.
The measured move target for the bear pennant continuation pattern is $18,320, representing a 47% decline from the BTC pennant’s lower trend line at the time of writing. The target is based on the length of the flagpole preceding the pennant. The target coincides very closely with the 78.6% Fibonacci retracement of the March 2020 to April 2021 advance at $16,920.
To achieve a sell-off to the target, Bitcoin price will need to dissolve support at the 61.8% retracement of the March 2020 to April 2021 rally at $27,175, followed by the 2017 high at $19,891.
BTC/USD daily chart
The bear pennant shaped below the intersection of multiple resistance levels that will challenge Bitcoin price for days and weeks to come if the pennant breakout to the upside regains traction. The resistance includes the 38.2% Fibonacci retracement of the historic rally from the March 2020 low to the April high at $41,581, the January 8 high at $41,986, the February 28 low at $43,016 and the 38.2% retracement level of the April-May decline at $43,331. Adding to the substantive resistance is the convergence of the 200-day SMA at $41,578.
With Bitcoin price upside potential limited to 8%-14% and downside potential of nearly 50%, BTC presents a high reward, low-risk opportunity for bearish investors.
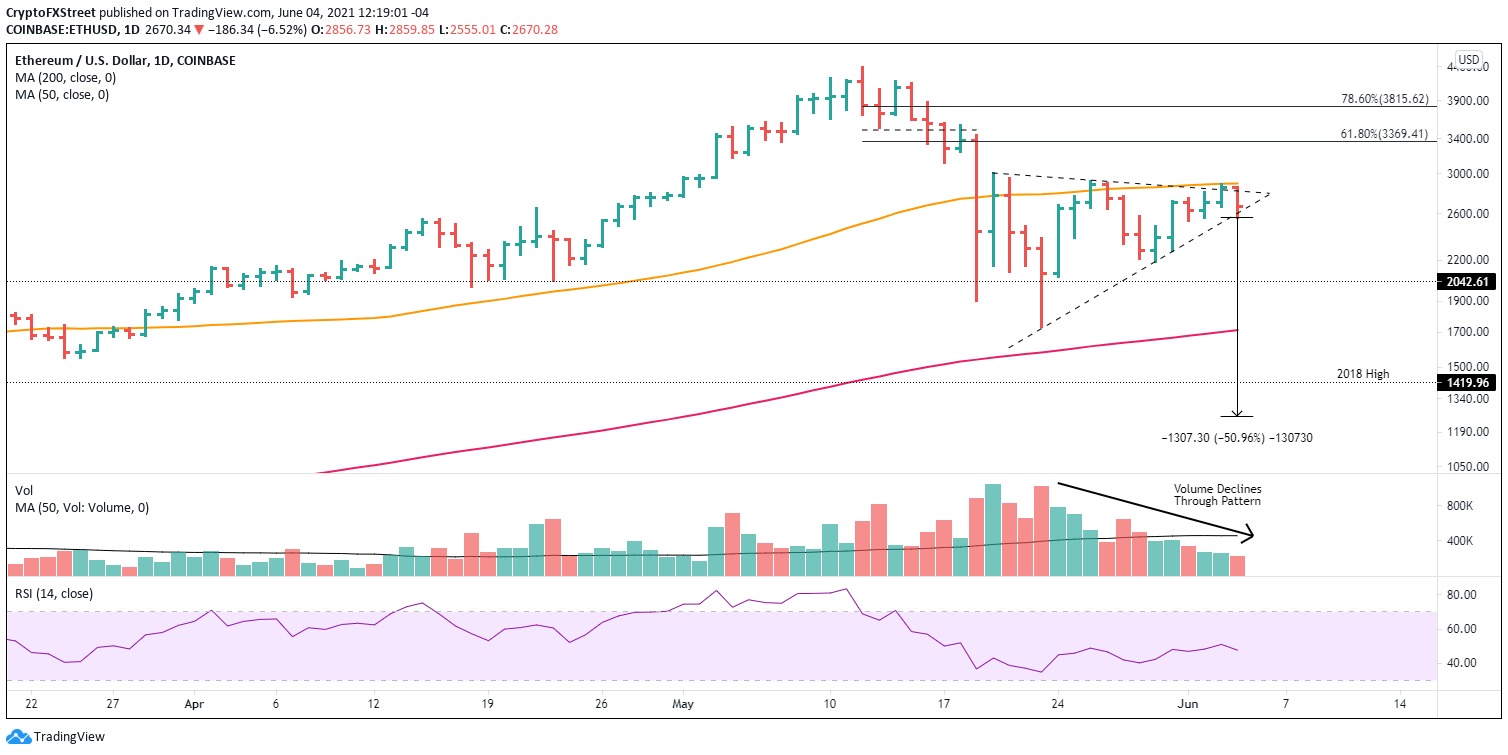
Ethereum price stumbles, improving fundamentals take a backseat to technicals
Similar to Bitcoin price, Ethereum price defined a bearish pennant pattern that initially released to the upside on June 3 but was met with notable resistance at the 50-day SMA at $2,898. ETH has reversed the breakout attempt and is now testing the pennant’s lower trend line at $2,580.
Since the ETH pennant pattern resolved near the apex, the power of the continuation should be questioned if a downside breakout does emerge. Based on the flagpole heading into the pattern, the measured move target is $1,257, yielding a 51% decline from the position of the lower trend line today.
The magnitude of the potential Ethereum price decline will slice through the May 23 low at $1,728, the 200-day SMA at $1,713 and the 2018 high at $1,419.
ETH/USD daily chart
If Ethereum price can register a daily close above $3,000, the outlook turns neutral for ETH investors and places the smart contracts token on the path to test the 61.8% retracement of the May correction at $3,369 and then the 78.6% retracement at $3,815.
As price is dictating today, the environment for the cryptocurrency complex is highly fluid and vulnerable to wide-ranging price swings. The bearish tilt in the Ethereum price outlook could flip very quickly, so investors need to be agile and disciplined in their ETH position sizing.
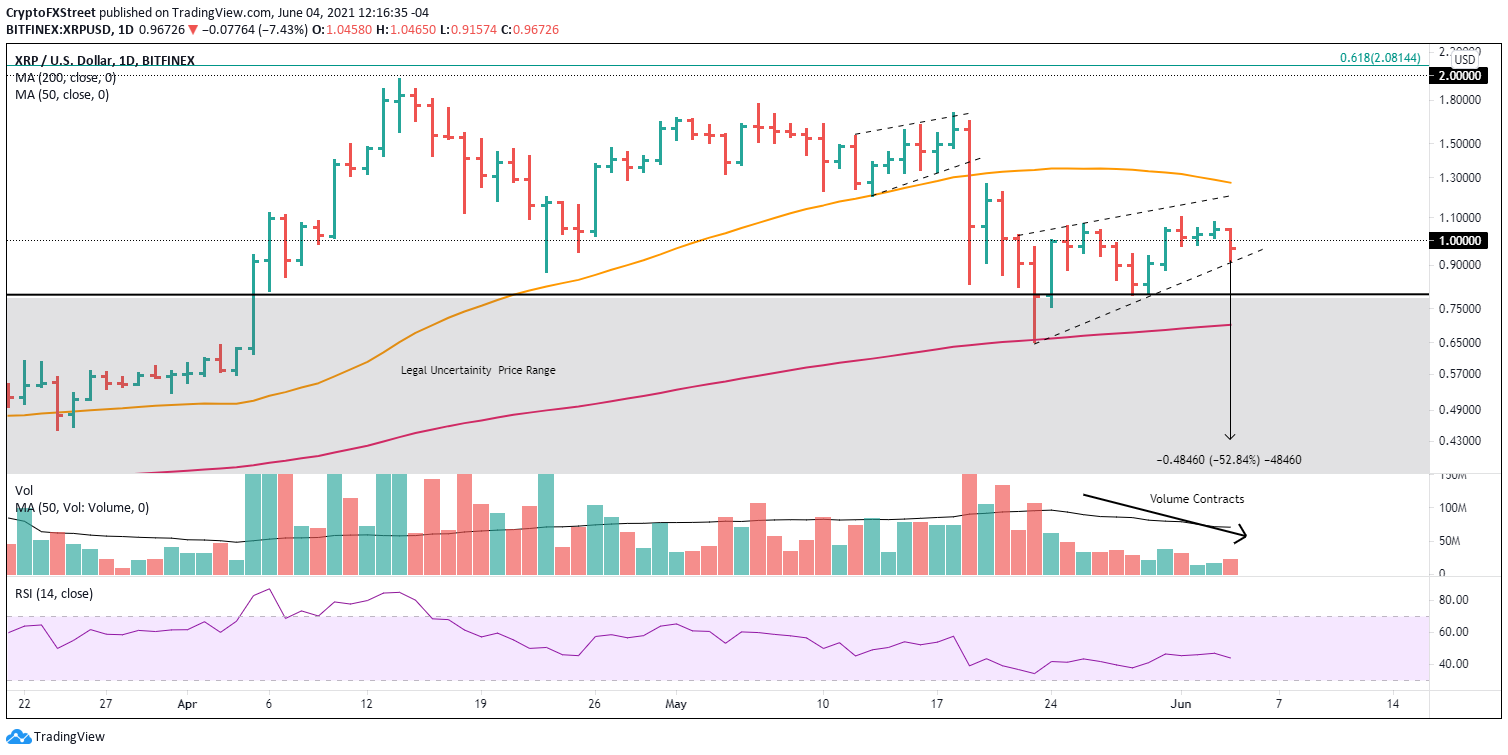
XRP price toys with investors searching for a timely long opportunity
To review, XRP price illustrated a cup-with-high-handle base on the four-chart, with a measured move target of $1,539, delivering a 40% return from the handle high at $1.10. The development of the pattern had been consistent with successful historical precedents, defined by rising volume on the right side of the cup and then progressively lower volume through handle construction.
The optimistic cup-with-high-handle base failed to materialize after it was voided today with the 8% decline. XRP price is now trading below $1.00 and at the lower trend line of the larger bearish flag pattern. A failure to hold leaves Ripple exposed to a test of $0.800 and then the 200-day SMA at $0.701.
The measured move target of the Ripple bearish flag pattern is $0.432, offering investors a 53% decline from the position of the flag’s lower trend line today. It is calculated using the length of the flagpole preceding the flag. A drop of that magnitude leaves XRP price stuck in the legal uncertainty price range that followed the November 2020 high into the December 2020 low.
XRP/USD daily chart
If XRP price closes above the 10-week SMA at $1.164, it will be a reversal of fortune for investors.
XRP price action has failed to achieve any significant trading outcomes, excluding the May 23 low bounce. Ripple has wrestled with the negative overhang of the broader crypto market while trying to piece together the interesting fundamental story into a compelling narrative for investors.
Author

Sheldon McIntyre, CMT
Independent Analyst
Sheldon has 24 years of investment experience holding various positions in companies based in the United States and Chile. His core competencies include BRIC and G-10 equity markets, swing and position trading and technical analysis.


