Top 3 Price Prediction Bitcoin, Ethereum, Ripple: Bitcoin falls below $55,000 level
- Bitcoin fell below $56,552 on Sunday, breaking the market structure and prompting a bearish outlook.
- Ethereum revisits the $2,817 support level, a close below it would indicate a bearish move.
- Ripple price finds support around the weekly support level of $0.413, breaking below signals a bearish move.

Bitcoin (BTC) dropped below $56,552 on Sunday, disrupting market structure and signaling a bearish outlook. Ethereum (ETH) and Ripple (XRP) also revisited their support levels, slipping below critical thresholds, indicating a possible downtrend for these assets in the days ahead.
Bitcoin price shows potential for a downward move
Bitcoin's price encountered resistance at the weekly resistance level of $58,375 on Saturday, resulting in a 4% decline the next day. By Sunday's close, it had fallen below the low of $56,552 from May 1 and traded around $54,900, 1.65% down on Monday.
If BTC's weekly support at $58,375 acts as a resistance, it could decline 5% to revisit its daily support at $52,266.
The Relative Strength Index (RSI) and the Awesome Oscillator (AO) on the daily chart support this bearish thesis, as both indicators are below their respective neutral levels of 50 and zero. This suggests continued momentum favoring bears, potentially leading to a further decline in the Bitcoin price.
Additionally, if the bears are aggressive and the overall crypto market outlook is negative, BTC could extend an additional decline of 3.3% to retest its February 23 low of $50,521.
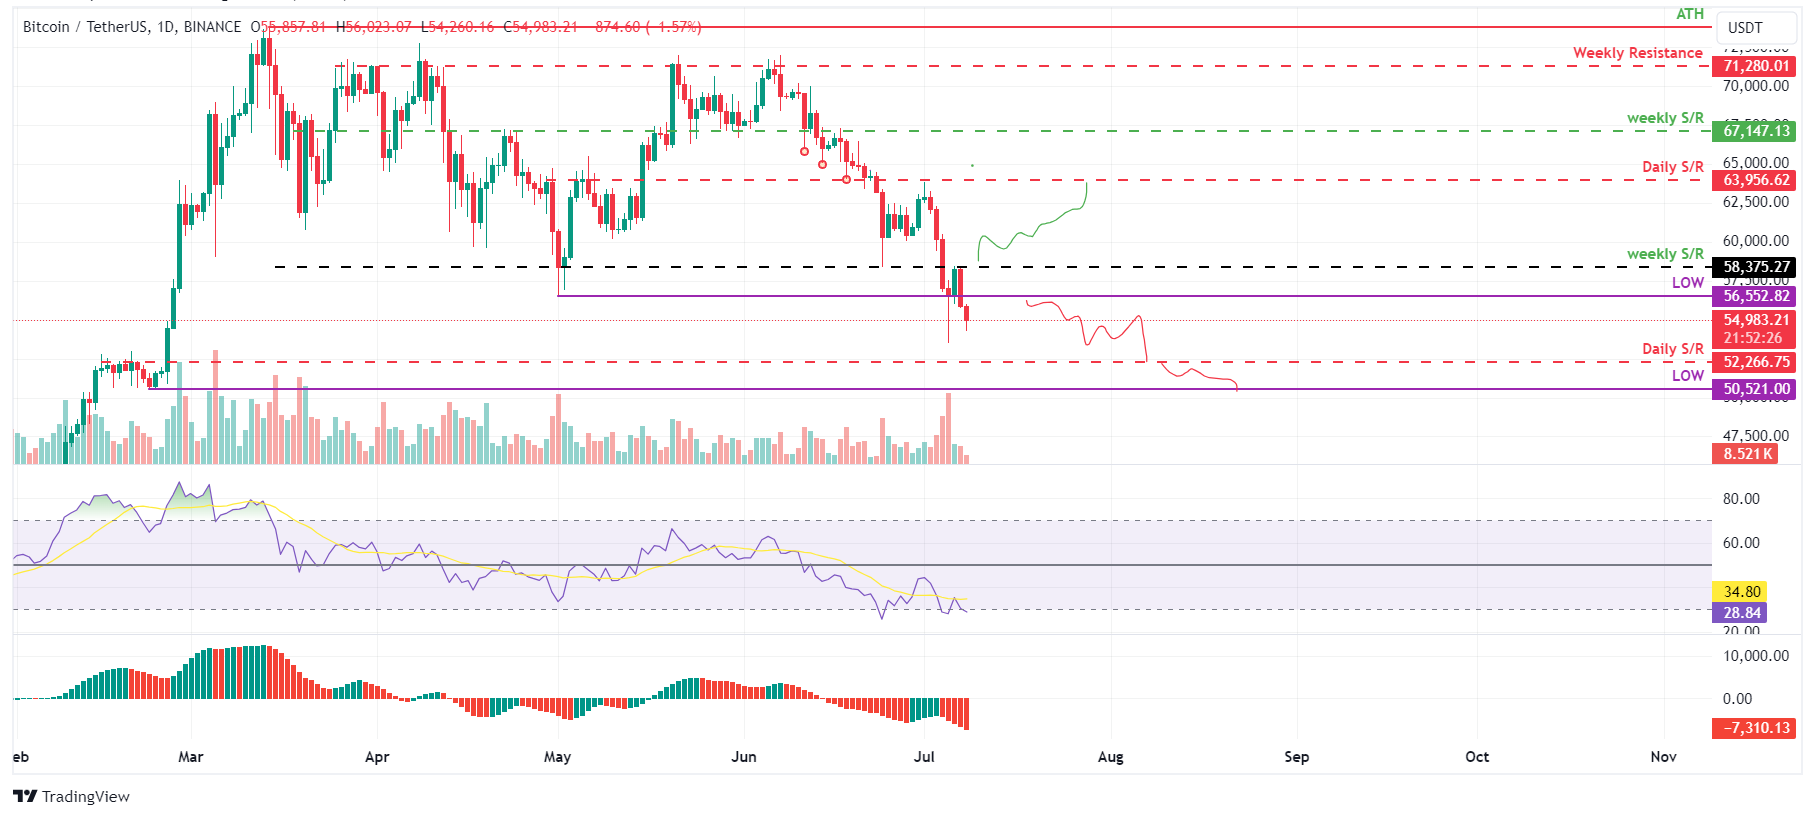
BTC/USDT daily chart
However, if BTC closes above the $58,375 weekly resistance level and forms a higher high in the daily time frame, it could indicate that bullish sentiment persists. Such a development may trigger a 9.7% rise in Bitcoin's price to revisit its next daily resistance at $63,956.
Ethereum price is poised to decline shortly
Ethereum's price retested the May 1 low of $2,817 on Friday, bouncing 3.35% on Saturday.
However, this Sunday, it fell 4.5%, and at the time of writing, it is again revisiting that low.
If ETH's price closes below its May 1 low of $2,817, it could decline 6.5% to revisit its daily support at $2,621.
The Relative Strength Index (RSI) and the Awesome Oscillator (AO) on the daily chart support this bearish thesis, as both indicators are below their respective neutral levels of 50 and zero. This suggests continued momentum favoring bears, potentially leading to a further decline in the Ethereum price.
However, if ETH's price closes below $2,621, it could extend an additional decline of 9.5% to retest its next daily support at $2,376.
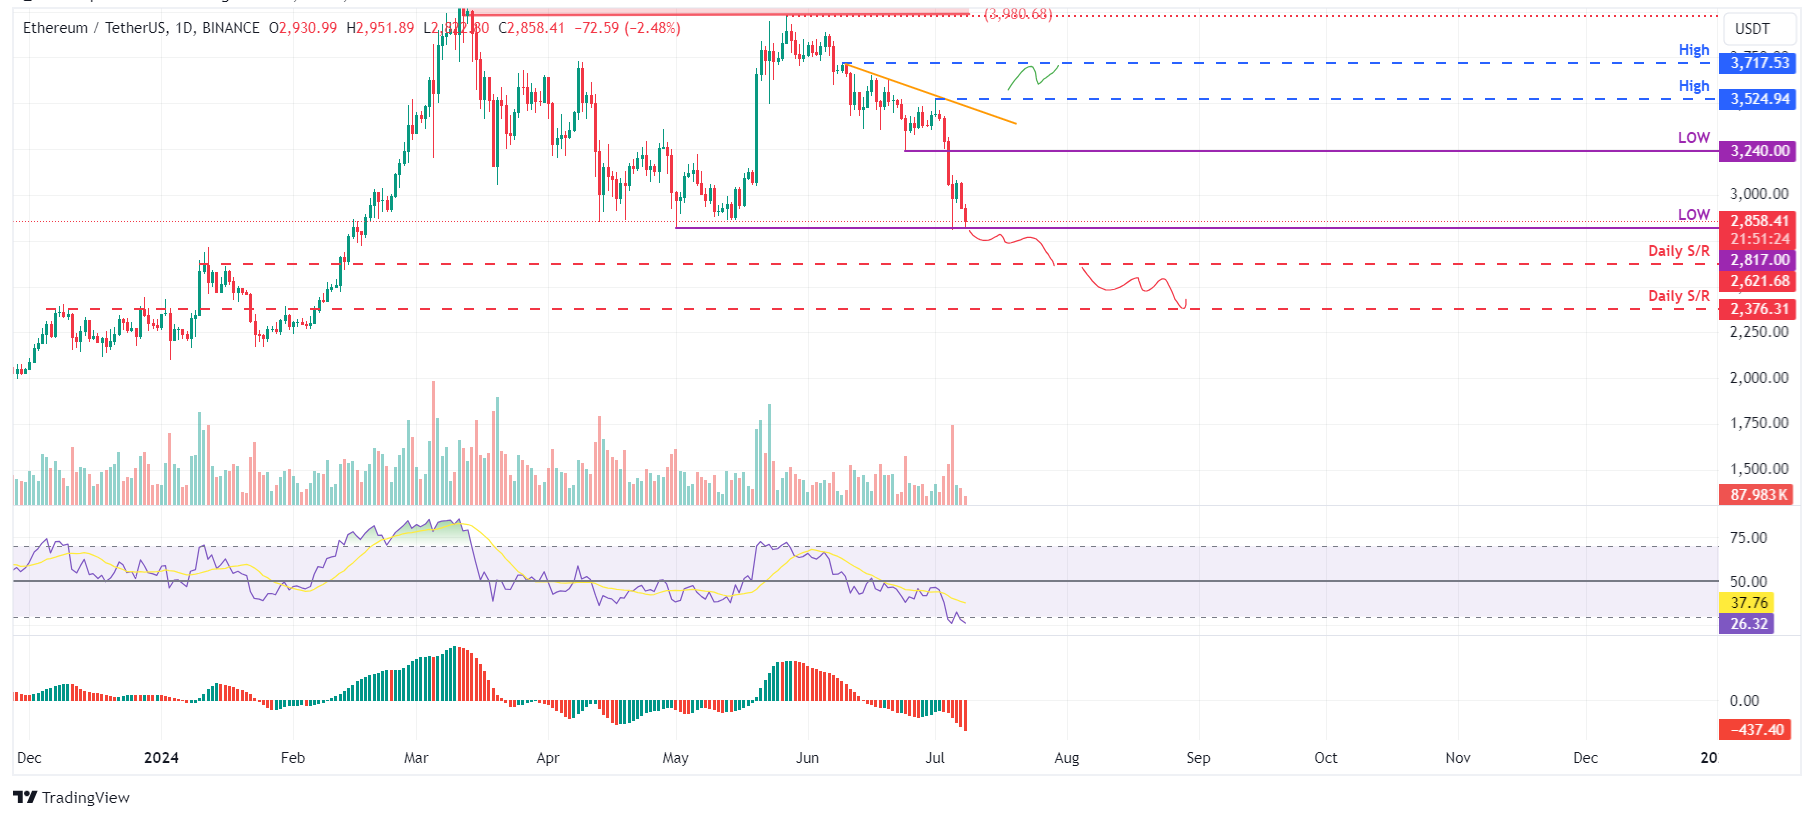
ETH/USDT daily chart
On the other hand, if Ethereum's daily candlestick price closes above $3,524, forming a higher high in the daily time frame, it could indicate that bullish sentiment persists. Such a development may trigger a 5.6% rise in Ethereum's price to revisit its high of June 9 at $3,717.
Ripple price outlook suggests a downward trajectory
Ripple price finds support around the weekly level of $0.413.At the time of writing, it trades 1% down at $0.414.
If XRP’s daily closes below $0.413, it could crash 15% to revisit its March 12, 2023 low of $0.347.
The Relative Strength Index (RSI) and the Awesome Oscillator (AO) on the daily chart support this bearish thesis, as both indicators are below their respective neutral levels of 50 and zero. This suggests continued momentum favoring bears, potentially leading to a further decline in the Ripple price.
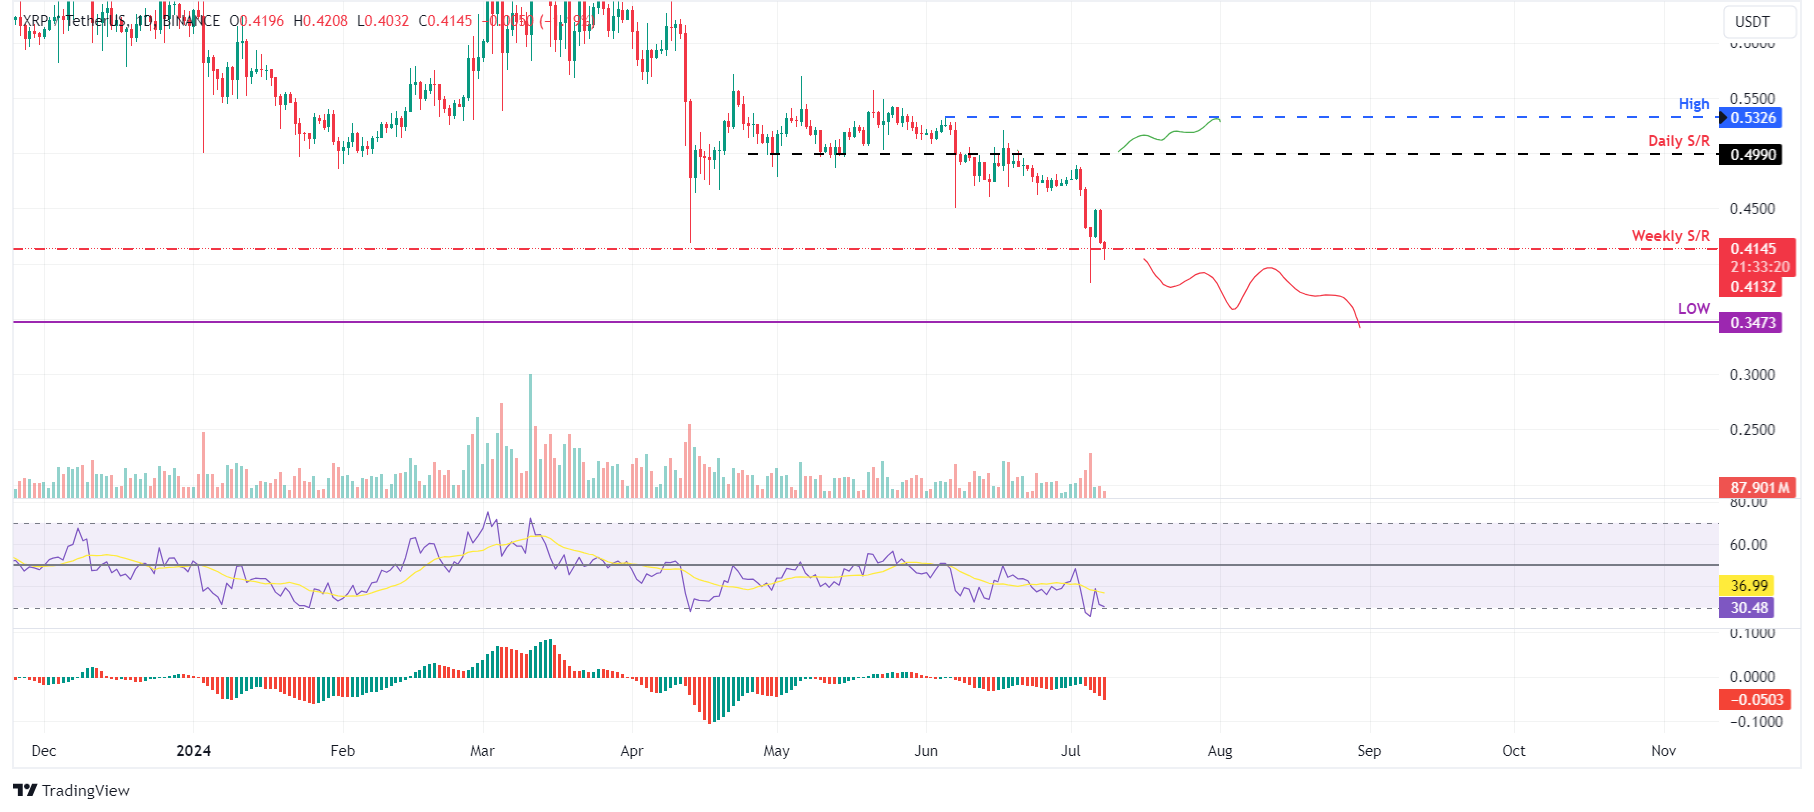
XRP/USDT daily chart
Conversely, if the Ripple price daily candlestick closes above $0.499 and forms a higher high in the daily time frame, it could indicate that bullish sentiment persists. Such a development may trigger a 6% rise in Ripple's price to revisit its high of June 5 at $0.532.
Author

Manish Chhetri
FXStreet
Manish Chhetri is a crypto specialist with over four years of experience in the cryptocurrency industry.



