Top 3 Price Prediction Bitcoin, Ethereum, Ripple: Bears push the market into the abyss
- Bitcoin returns to the previous down scenario and risks everything gained.
- King Bitcoin takes the lead in the fight for dominance.
- Ripple is at risk and could seek support below the $0.18 level.

The technical supports have finally given way and this week starts with critical falls. After several weeks lurking at resistance levels, the market takes a break and looks for lower prices where to find new money to fuel future gains.
The impact on the price is minimum at the moment, but we can already assume that the changes in the technical level scenario are far-reaching and could have consequences in the medium term.
As we will see in the BTC/USD analysis, the structural damage is critical, with a support break that puts the BTC/USD price back into the long-term bear channel.
The market reaction has been swift and Altcoins are suffering from the flow of capital flying into Bitcoin, USDT and the like.
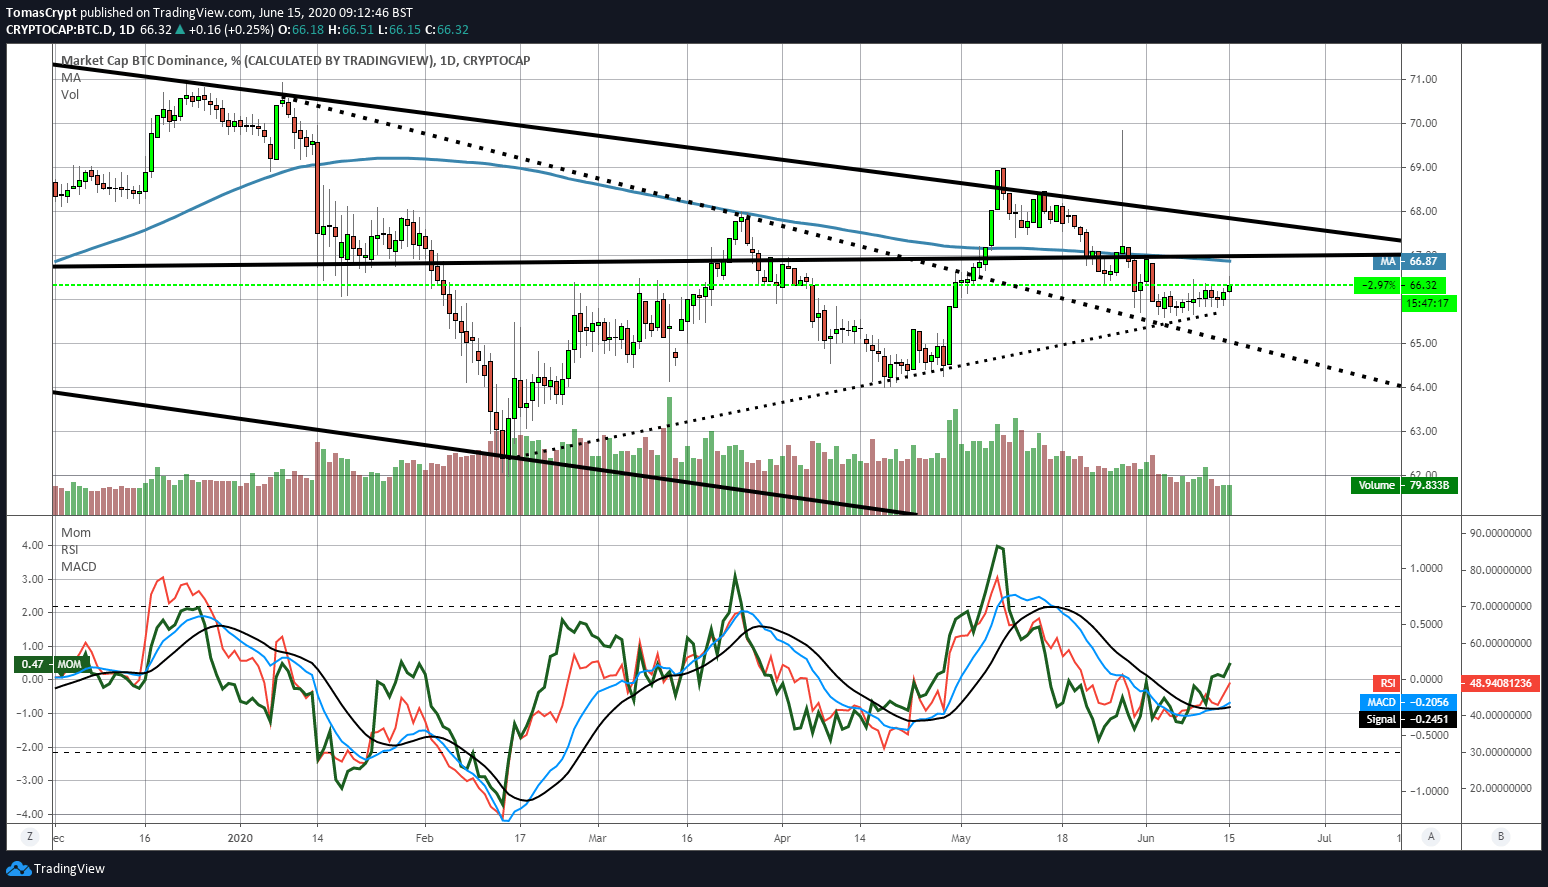
The dominance charts confirm this change in trend. The Bitcoin Dominance chart shows an upward shift with a first clear target at the 66.87% dominance level extending to 67%. The critical resistance of the scenario is at the 67.85% level, above which the Bitcoin would drain the crypto board of liquidity.
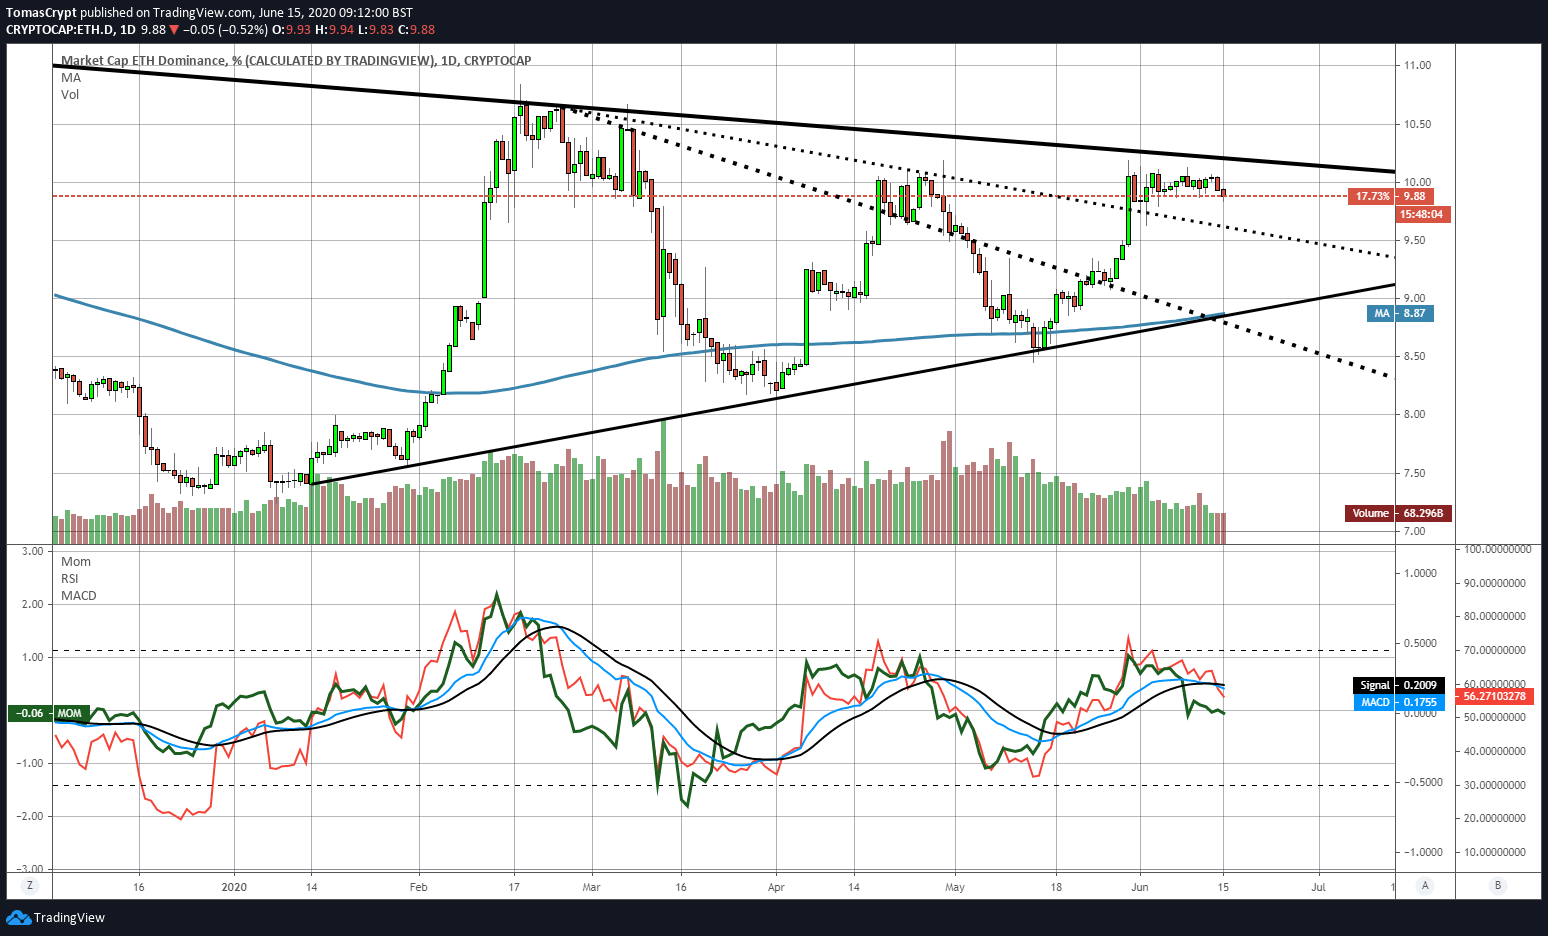
Ethereum is driven down by the momentum of King Bitcoin and has lost the support of the 10% market share level. The first support level is at 9.65% below which the fall would accelerate looking for support in the 8.87% area.
The market sentiment indicator built by the alternative.me site doesn't reflect today's drop, but since Friday it entered fear levels, the same that it repeats today after a slight rally over the weekend.

Ripple, the third component of the Top 3 is currently playing against support at $0.183, a pivotal event to avoid a quick trip to the $0.16 and $0.14 area.
ETH/BTC Daily Chart
The ETH/BTC pair is currently trading at the price level of 0.0246, clearly breaking through price congestion support at 0.0248 and heading to the next support level at 0.0235.
Above the current price, the first resistance level is at 0.0248, then the second at 0.0253 and the third one at 0.0259.
Below the current price, the first support level is at 0.0236, then the second at 0.0225 and the third one at 0.0221.
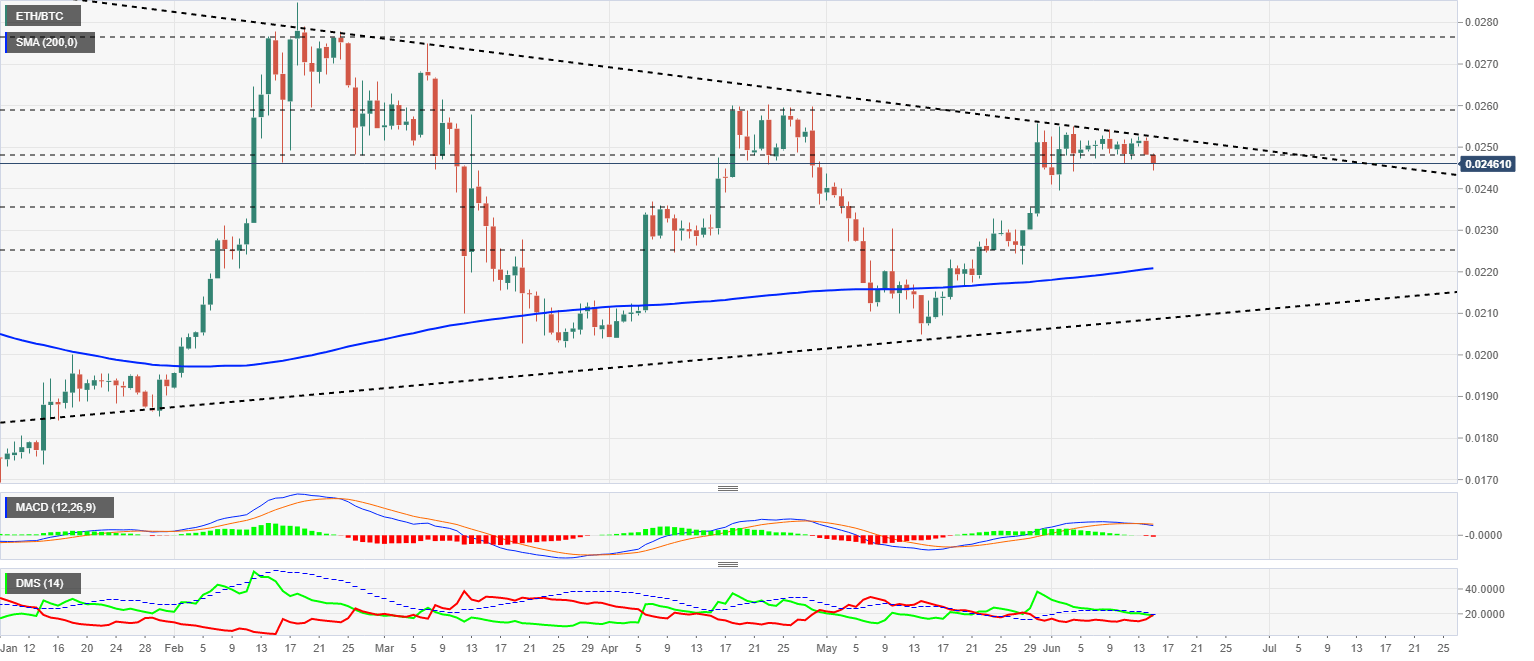
The MACD on the daily chart shows a complete but still very recent bearish cross. The ETH/BTC pair is entering a bearish trend at the moment.
The DMI on the daily chart shows the bears taking the lead in the pair, although they have not yet managed to break the ADX line and activate the short-term bearish pattern.
BTC/USD Daily Chart
The BTC/USD pair is currently trading at the price level of $9099 and is exiting the bullish quadrant of the chart to move directly into the bearish scenario within the long-term downward channel. Only a close above the $9150 level would avoid the danger and leave the BTC/USD price in the middle quadrant.
Above the current price, the first resistance level is at $9150, then the second at $9500 and the third one at $10450.
Below the current price, the first support level is at $8700, then the second at $8250 and the third one at $7800.
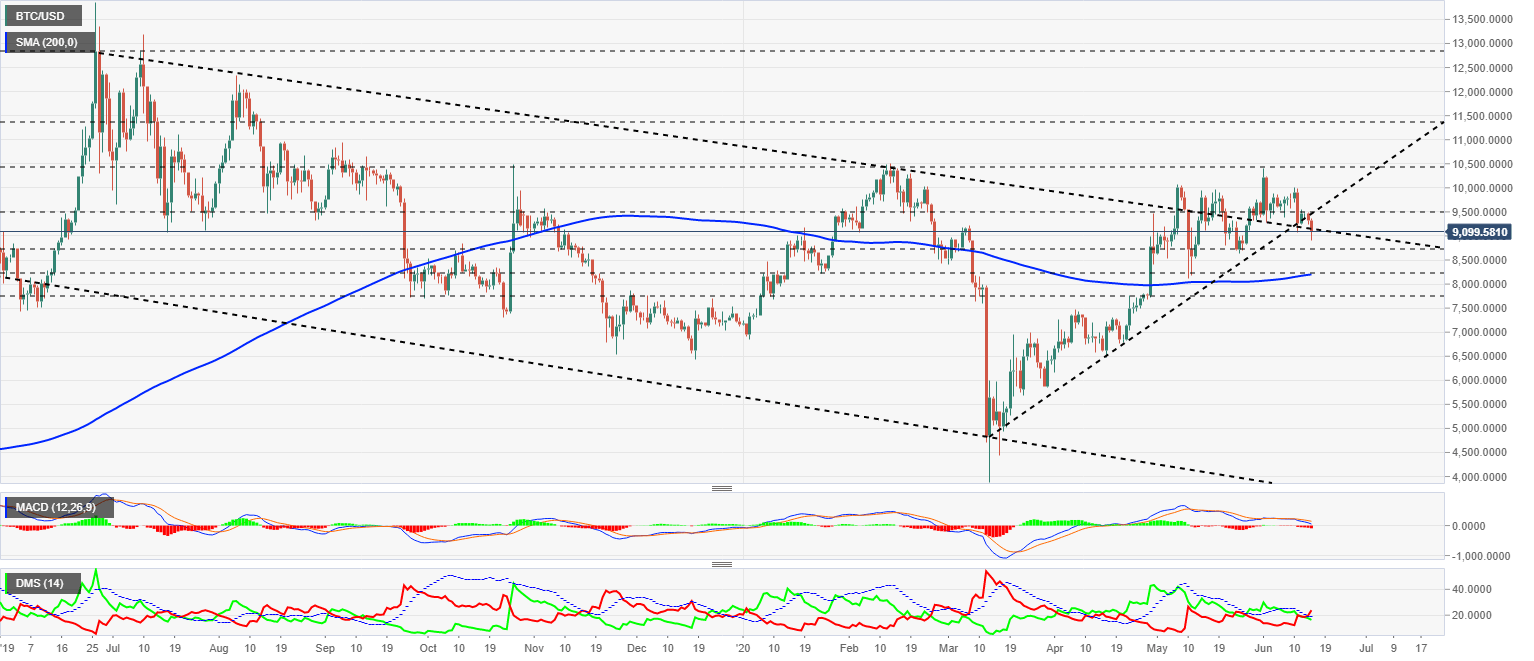
The MACD on the daily chart looks for support at the neutral level of the indicator, a position that reinforces a possible close above the price level of $9150.
The DMI on the daily chart shows bears crossing the ADX line higher, triggering the short-term bearish pattern.
ETH/USD Daily Chart
The ETH/USD pair is currently trading at the $224 price level and is regaining the $220 price support it had lost at the start of the session.
Above the current price, the first resistance level is at $235, then the second at $247 and the third one at $265.
Below the current price, the first support level is at $220, then the second at $200 and the third one at $185.
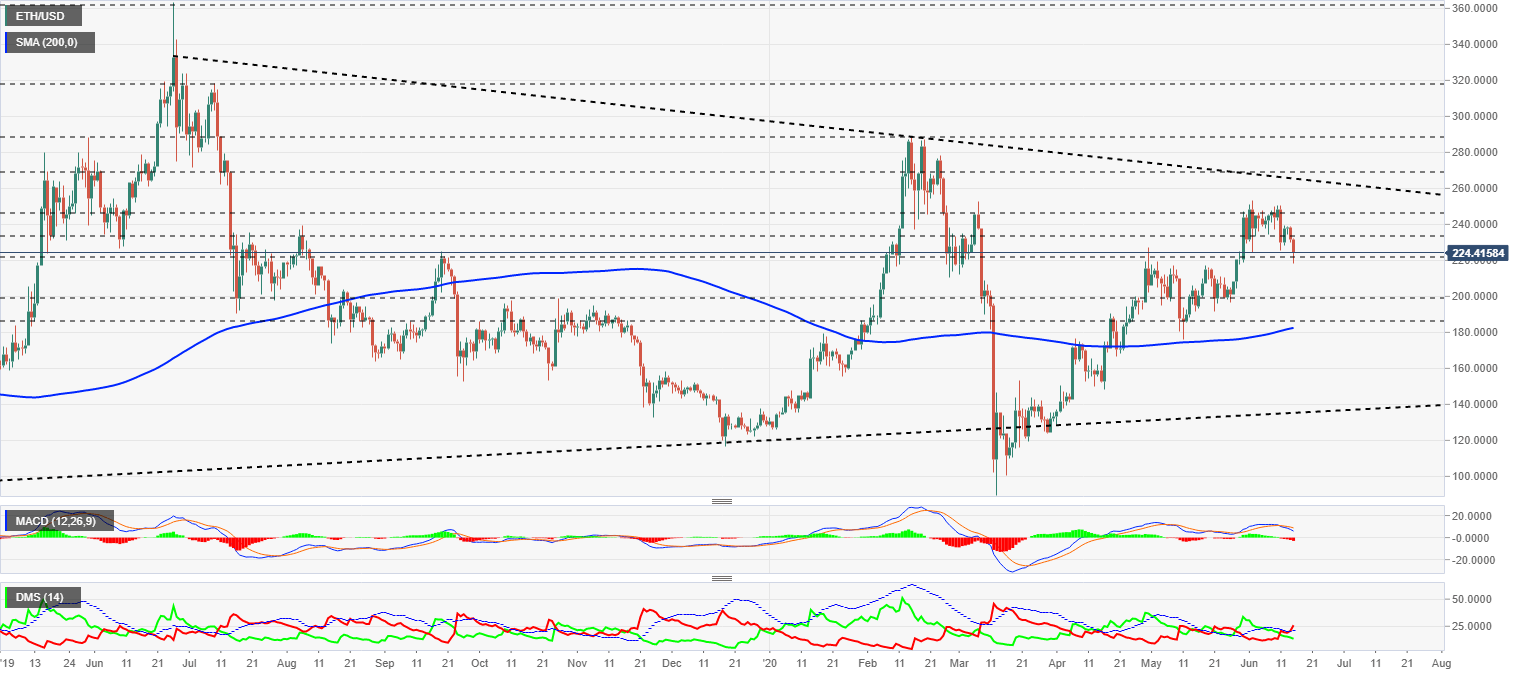
The MACD on the daily chart increases the downward slope and the opening between the lines. The downward trend is accelerating in the short term.
The DMI on the daily chart shows bears breaking through the ADX line and triggering a short-term bearish pattern.
XRP/USD Daily Chart
The XRP/USD pair is currently trading at the price level of $0.184 while playing dangerously close to the lower trend line that emerges from the March lows.
Above the current price, the first resistance level is at $0.20, then the second at $0.212 and the third one at $0.237.
Below the current price, the first support level is at $0.185, then the second at $0.18 and the third one at $0.163.
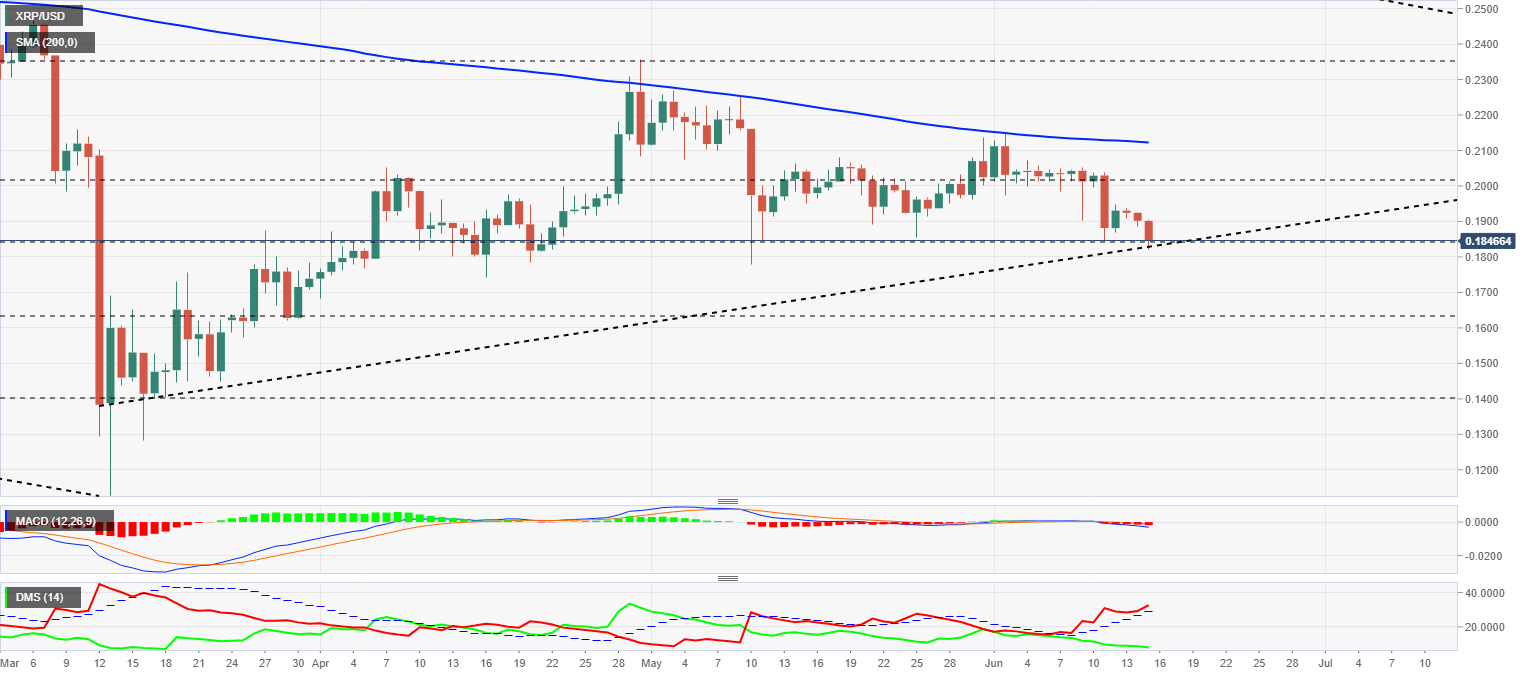
The MACD on the daily chart finally breaks the flat profile of the last weeks and moves below the neutral zone of the indicator. Neither the downward slope nor the opening between the lines is excessive, a decisive factor in the short term.
The DMI on the daily chart shows the bears are extremely close to control of the pair. A short-term bullish reaction may occur in the form of a short-term rebound.
Author

Tomas Salles
FXStreet
Tomàs Sallés was born in Barcelona in 1972, he is a certified technical analyst after having completing specialized courses in Spain and Switzerland. He expanded his technical training following the guidance of great experts on the financial markets.


