Top 3 Price Prediction Bitcoin, Ethereum, Ripple: Altcoins push hard not waiting for a Bitcoin reaction
- ETH/BTC is trading at recent highs and is looking to break out of the current range.
- Bitcoin continues in pause mode and could wait for a pause in the upward trend of the Altcoin segment.
- XRP is struggling to stay in the high price range and is disengaging from the strength demonstrated by the Altcoins.

The Altcoin market has only needed one business day to see prices rise sharply again. Bitcoin, still, has adopted the anchor function and for the moment is giving up the battle for the $10000.
The new week adds a candlestick to the weekly chart and allows us to plot the possible scenarios before us.
The main assets of the Altcoin segment are already moving above the short moving average – EMA 50 – and now have the SMA200 as their main target at 0.040 price level.
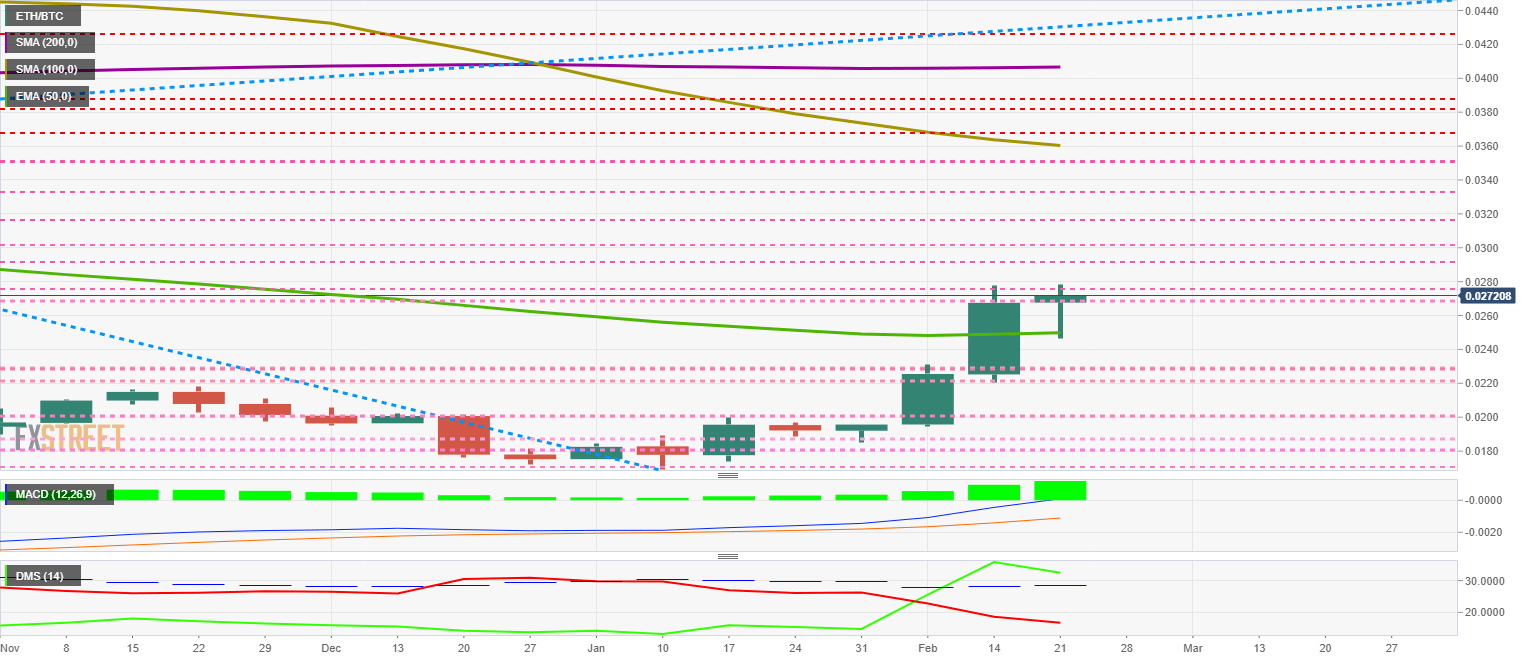
The distances to this medium-term moving average allow us to venture that altcoins can reach this level in 4-6 weeks. The market will likely slow down due to the importance of the SMA200 as a resistance. Will that be the time to see Bitcoin rise? Possibly.
The master pair in the Bitcoin vs Altcoin ratio, the ETH/BTC pair, shows significant strength and is battling against the 0.0275 resistance. If brokes this resistance level, we could see a robust bullish explosion in the Altcoin segment.
ETH/BTC Daily Chart
The ETH/BTC pair is currently trading at the price level of 0.02708. The bullish strength shown so far by Ether against Bitcoin is attracting a lot of attention from traders looking for Beta against the BTC.
Above the current price, the first resistance level is at 0.029, then the second at 0.030 and the third one at 0.0315.
Below the current price, the first support level is at 0.027, then the second at 0.023 and the third one at 0.022.
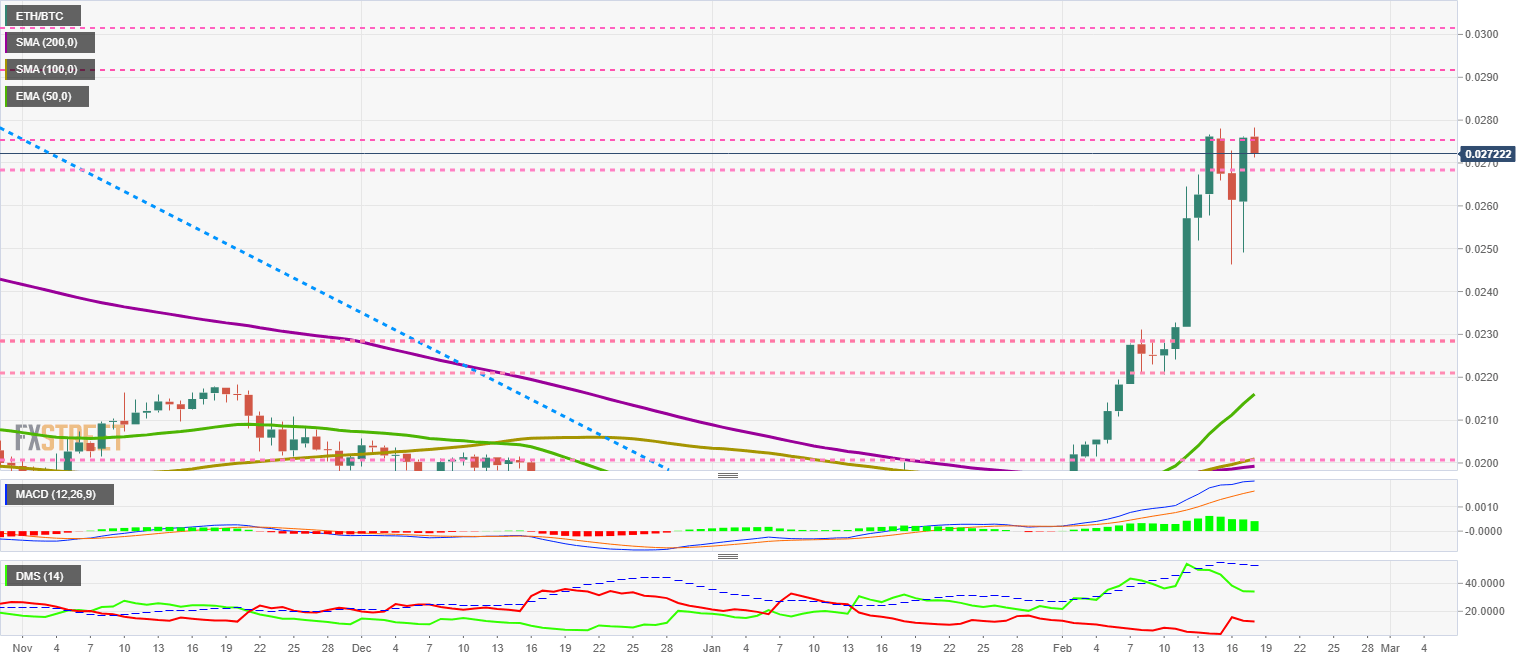
The DMI on the daily chart shows the bulls losing momentum, while the bears are also losing momentum and moving away from the area controlled by the buy-side.
BTC/USD Daily Chart
BTC/USD is trading at the $9691 price level after finding support at the $9750 level.
Above the current price, the first resistance level is at $10500, then the second at $11500 and the third one at $13861.
Below the current price, the first support level is at $9750, then the second at $9150 and the third one at $8850.
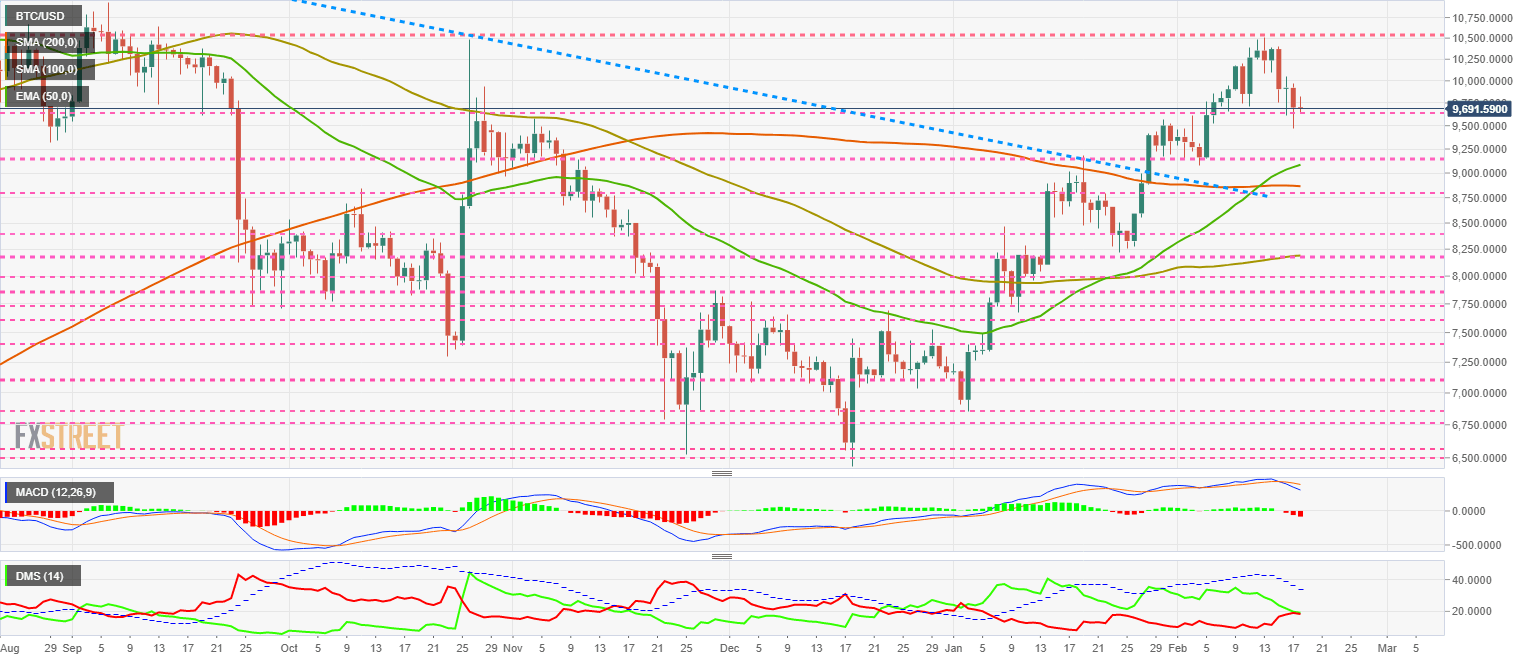
The DMI on the daily chart shows the two sides of the market-facing each other, placing the BTC/USD pair at a crossroads for which we don't know the resolution.
ETH/USD Daily Chart
ETH/USD is currently trading at the price level of $266 after recovering yesterday's support level of $250.
Above the current price, the first resistance level is at $290, then the second at $308.
Below the current price, the first support level is at $260, then the second at $250 and the third one at $238.
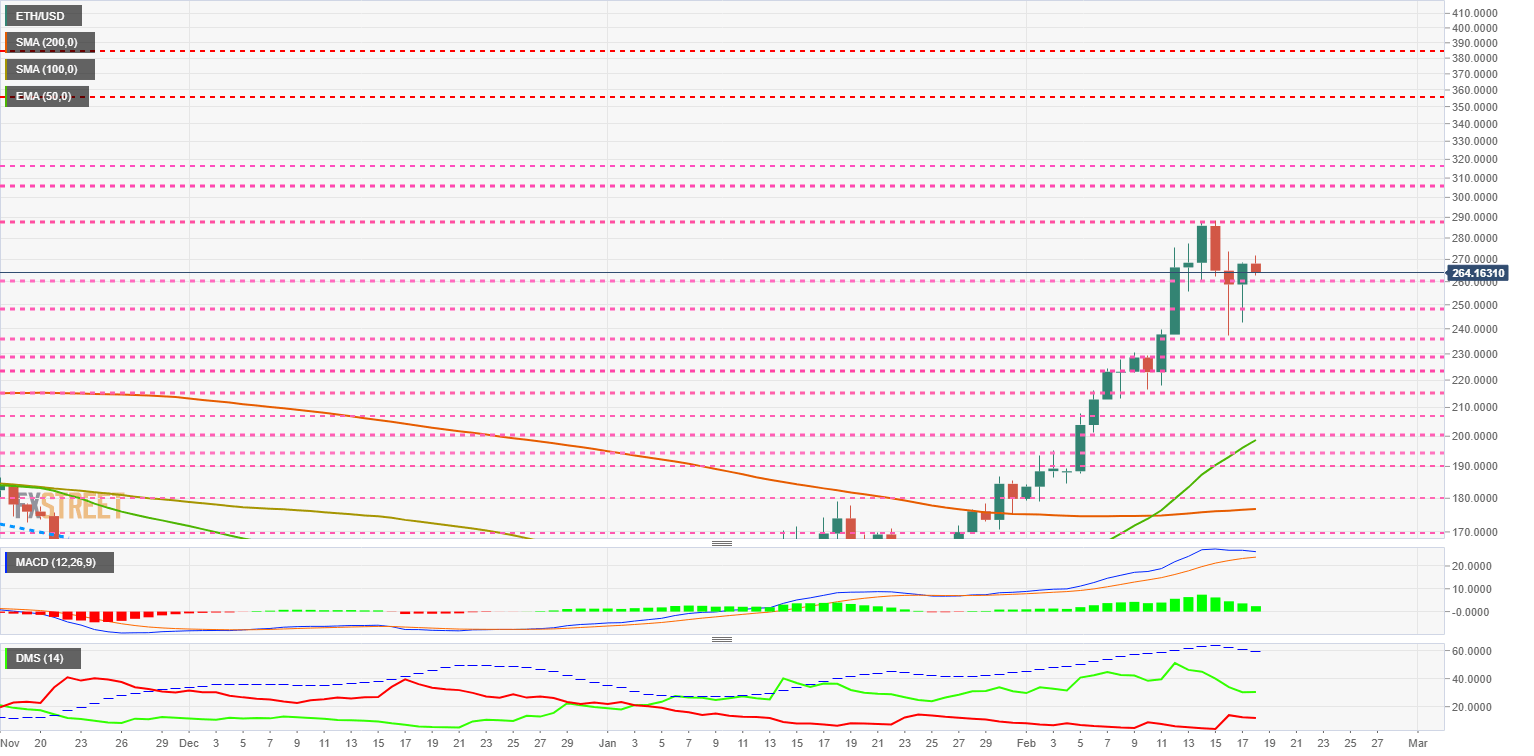
The MACD on the daily chart shows a profile before a downward cross in the next few days. If the price breaks through the resistance at $290, the indicator may renew its upward momentum.
The DMI on the daily chart shows that bulls are stopping the downtrend while bears are stopping the increase in trend strength.
XRP/USD Daily Chart
XRP/USD is currently trading at the price level of $0.284 and is seeking support at the previous consolidation level of $0.283.
Above the current price, the first resistance level is at $0.29, then the second at $0.30 and the third one at $0.32.
Below the current price, the first support level is at $0.283, then the second at $0.267 and the third one at $0.255.
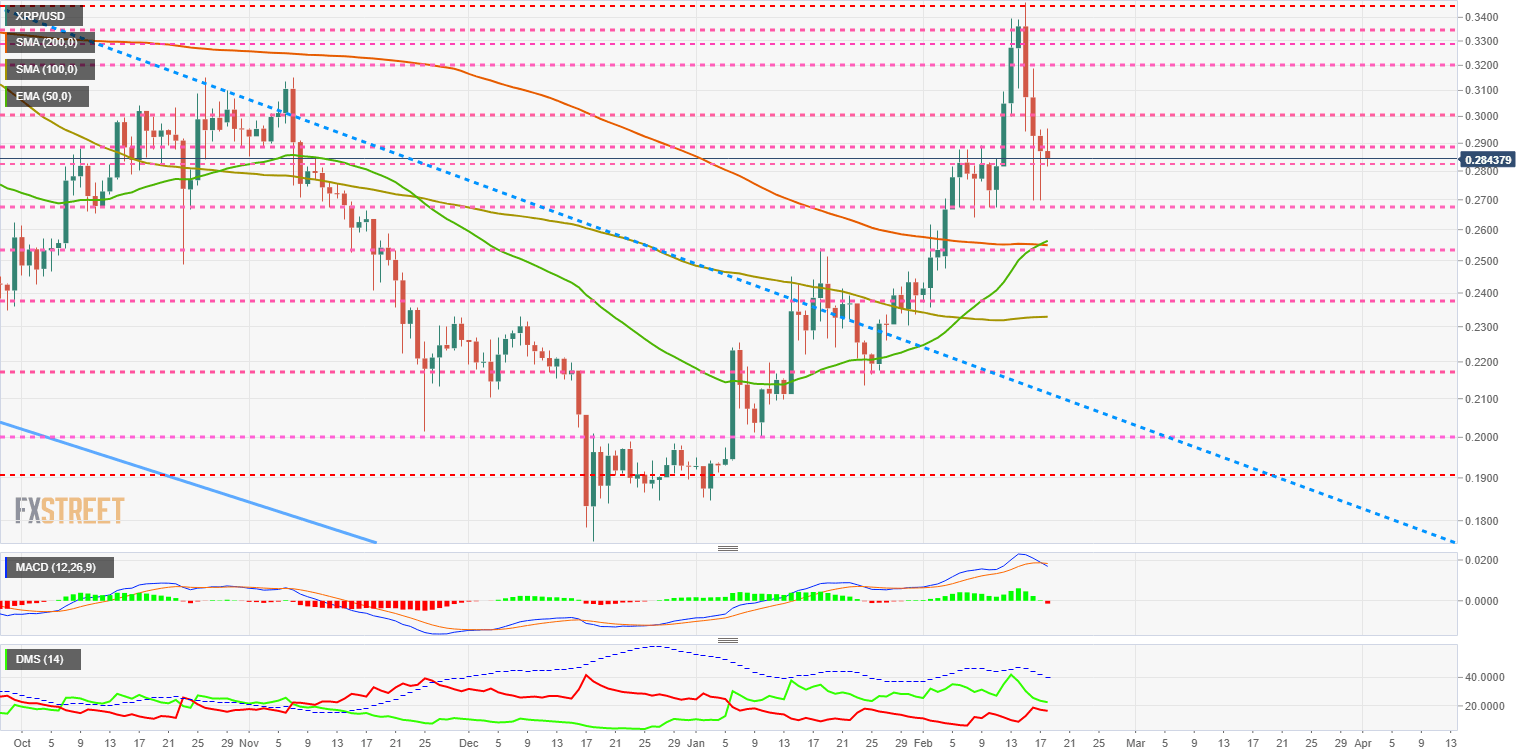
The DMI on the daily chart shows the bulls losing strength quickly. The bears have also lost momentum in the last few hours.
Get 24/7 Crypto updates in our social media channels: Give us a follow at @FXSCrypto and our FXStreet Crypto Trading Telegram channel
Author

Tomas Salles
FXStreet
Tomàs Sallés was born in Barcelona in 1972, he is a certified technical analyst after having completing specialized courses in Spain and Switzerland. He expanded his technical training following the guidance of great experts on the financial markets.


