Top 3 Price Prediction Bitcoin, Ethereum, Ripple: Altcoin offensive for market share
- Ethereum could be supported by XRP in its war for dominance against Bitcoin.
- Ripple has been losing market share since 2017 and has a new opportunity for a change of scenery.
- Main indicators show a high probability that the price will slide down in the next few days.

The war for crypto market dominance between Bitcoin and Ethereum continues. Ether follows its offensive, and after yesterday's small setback, today it renews its assault and moves quickly upwards looking for the first target at the 9.7% market share level.
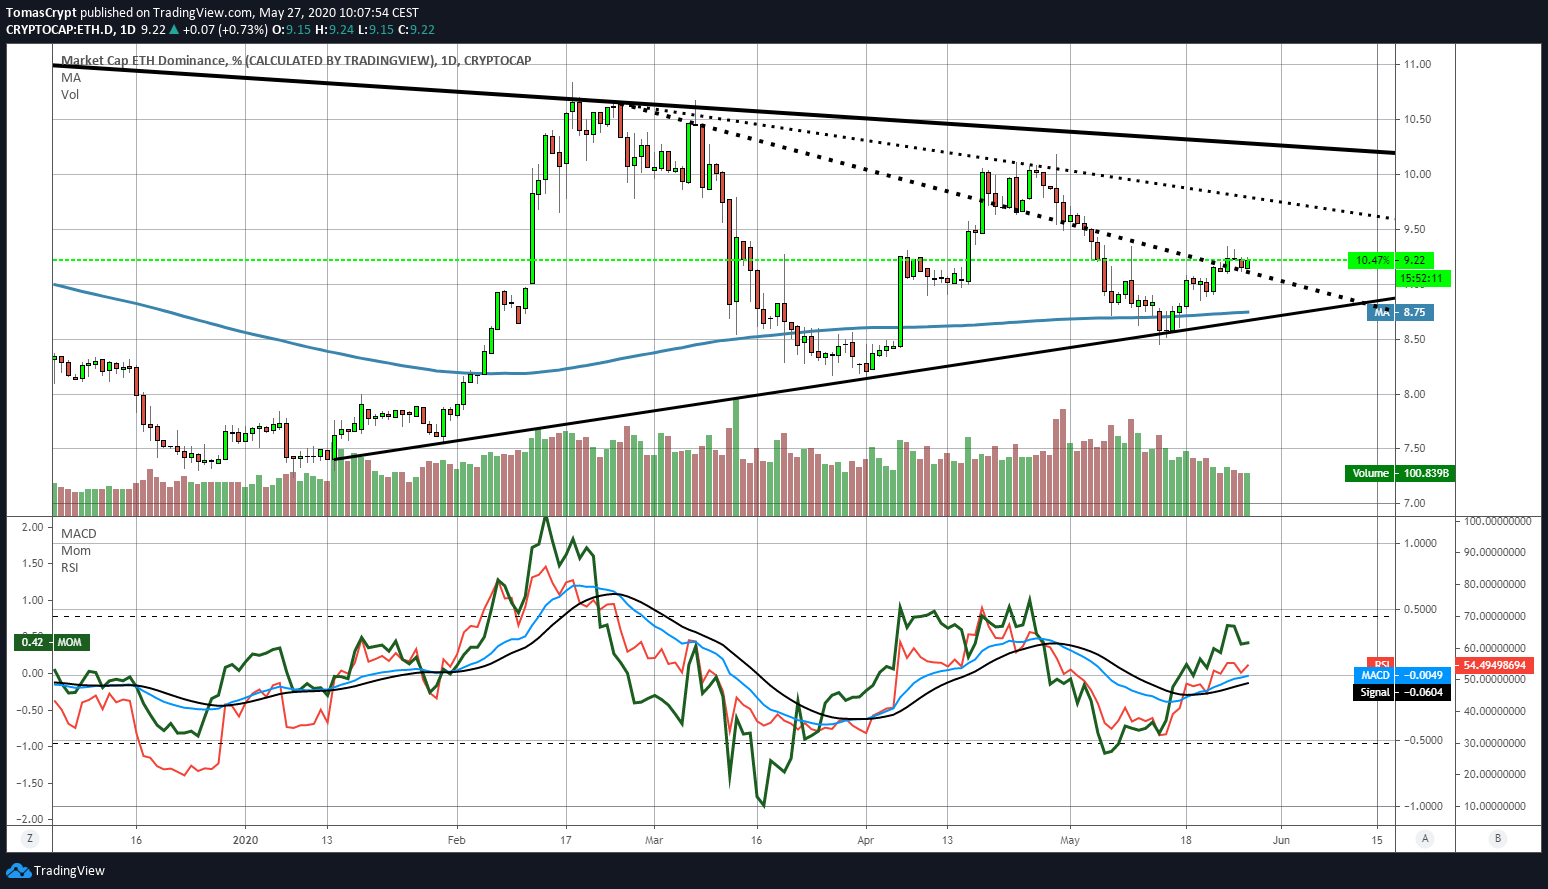
Ripple, which is now being challenged by the loss of the third position in market capitalization against the US Tether, shows an intention to accompany Ethereum in the fray and could exceed its long-term downward trend line today.
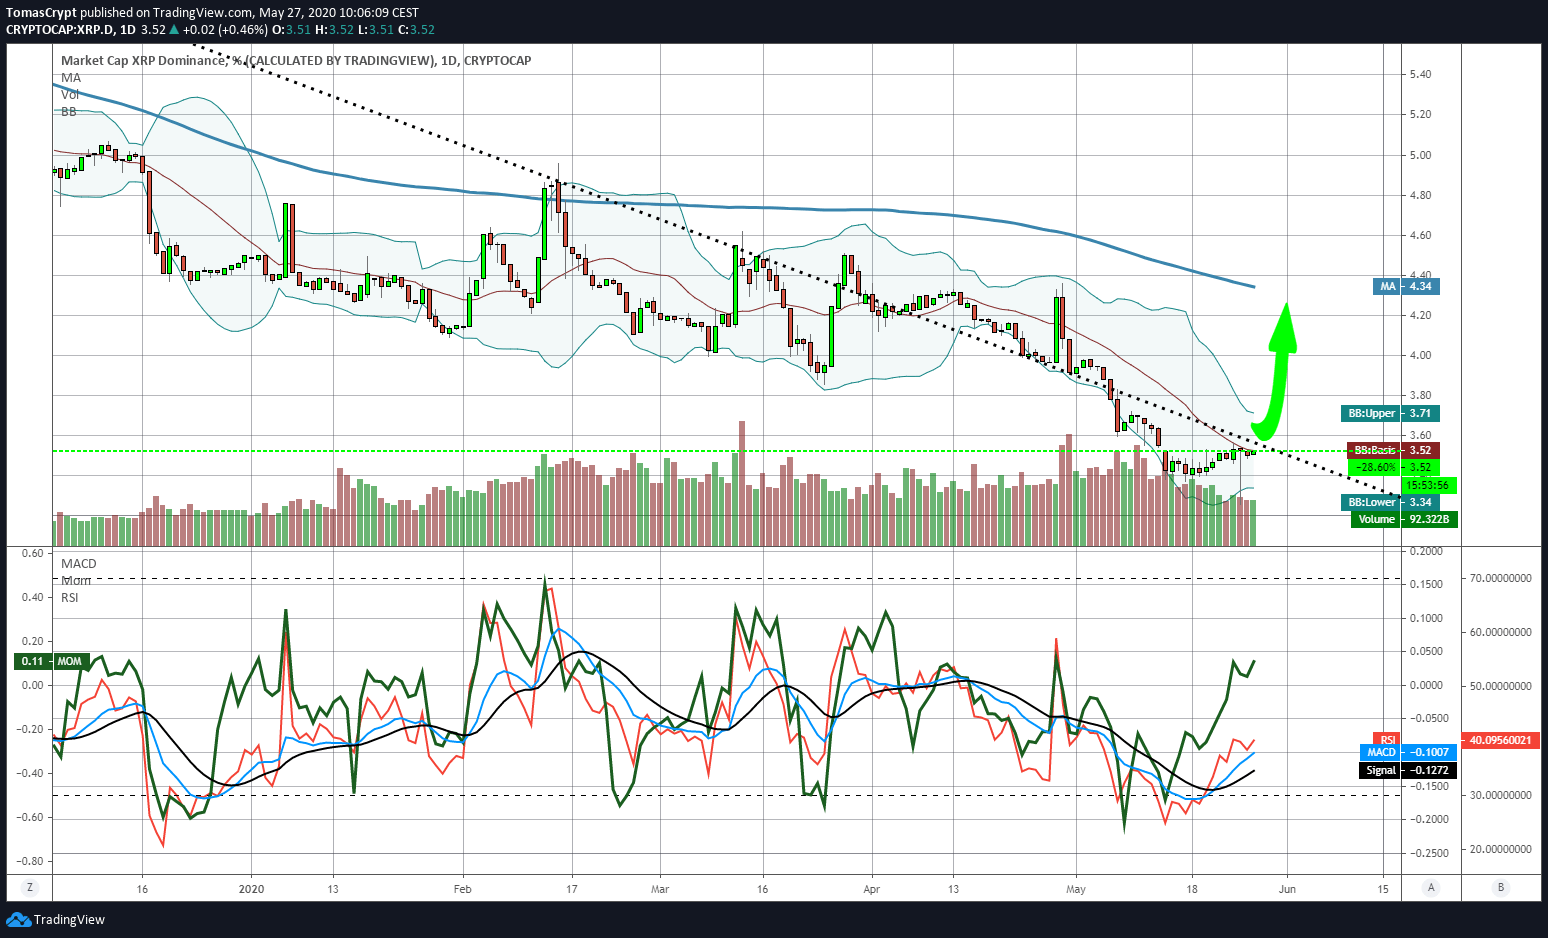
XRP has been losing market share since the spring of 2017, and if it does not manage to change this scenario and start to recover ground, it will have a terrible future.
The technical objective that would confirm this radical change of scenario is in the price level of 4.34%, where the simple moving average of 200 days is now.
ETH/BTC Daily Chart
The ETH/BTC pair is currently trading at the price level of 0.0229, trapped between the 100-day simple moving average and the 50-day exponential.
Above the current price, the first resistance level is at 0.0235, then the second at 0.0248 and the third one at 0.0258.
Below the current price, the first support level is at 0.0226, then the second at 0.022 and the third one at 0.0217.
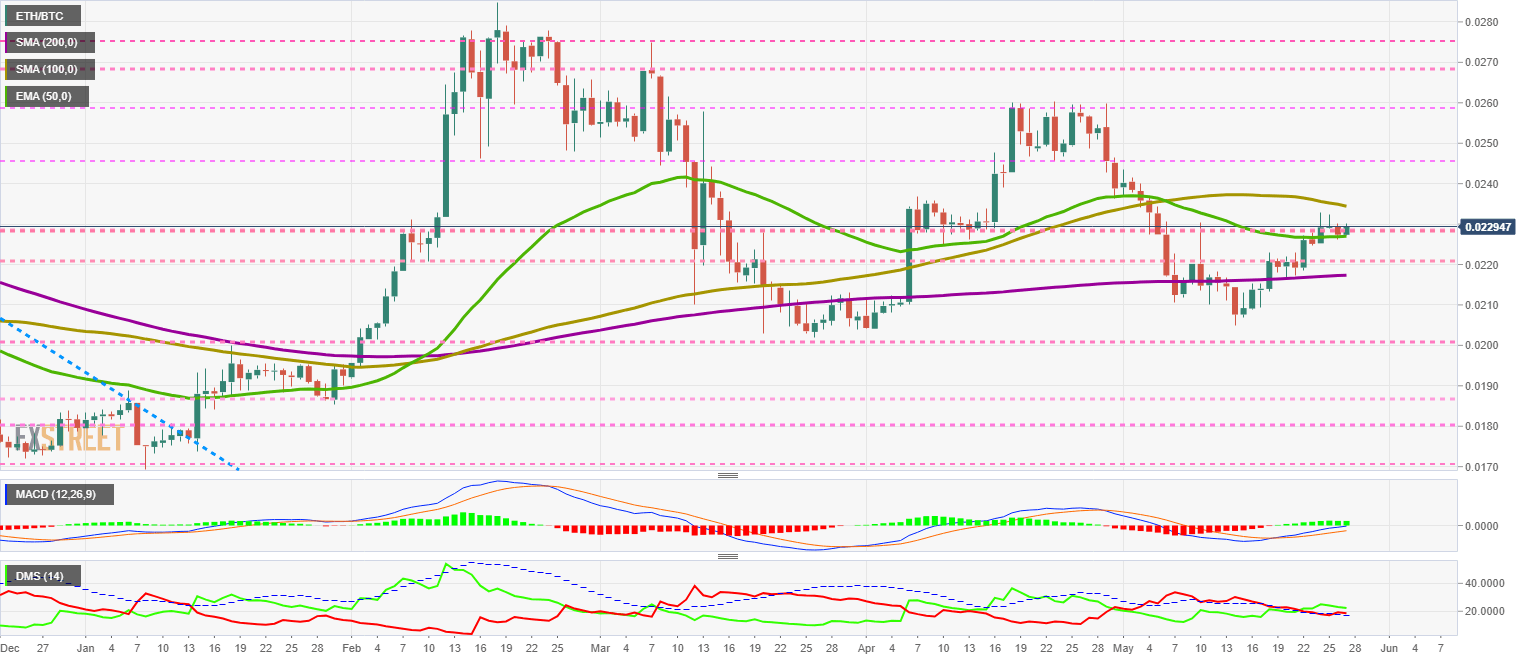
The MACD on the daily chart is just below the neutral level of the indicator exercising resistance. The way the ETH/BTC resolves this obstacle will serve as a benchmark for the health of the bullish trend.
The DMI on the daily chart shows bears losing strength and testing the support of the ADX line. The bulls are still leading the ETH/BTC pair but have not gained an advantage that would allow them to be optimistic.
BTC/USD Daily Chart
The BTC/USD pair is currently trading at the $8869 price level after yesterday's failed attempt to break above the psychological level of $9000. The main mid and long-term moving averages are moving up today but still on a downward lateral trajectory.
Above the current price, the first resistance level is at $9000, then the second at $9200 and the third one at $9650.
Below the current price, the first support level is at $8800, then the second at $8585 and the third one at $8400.
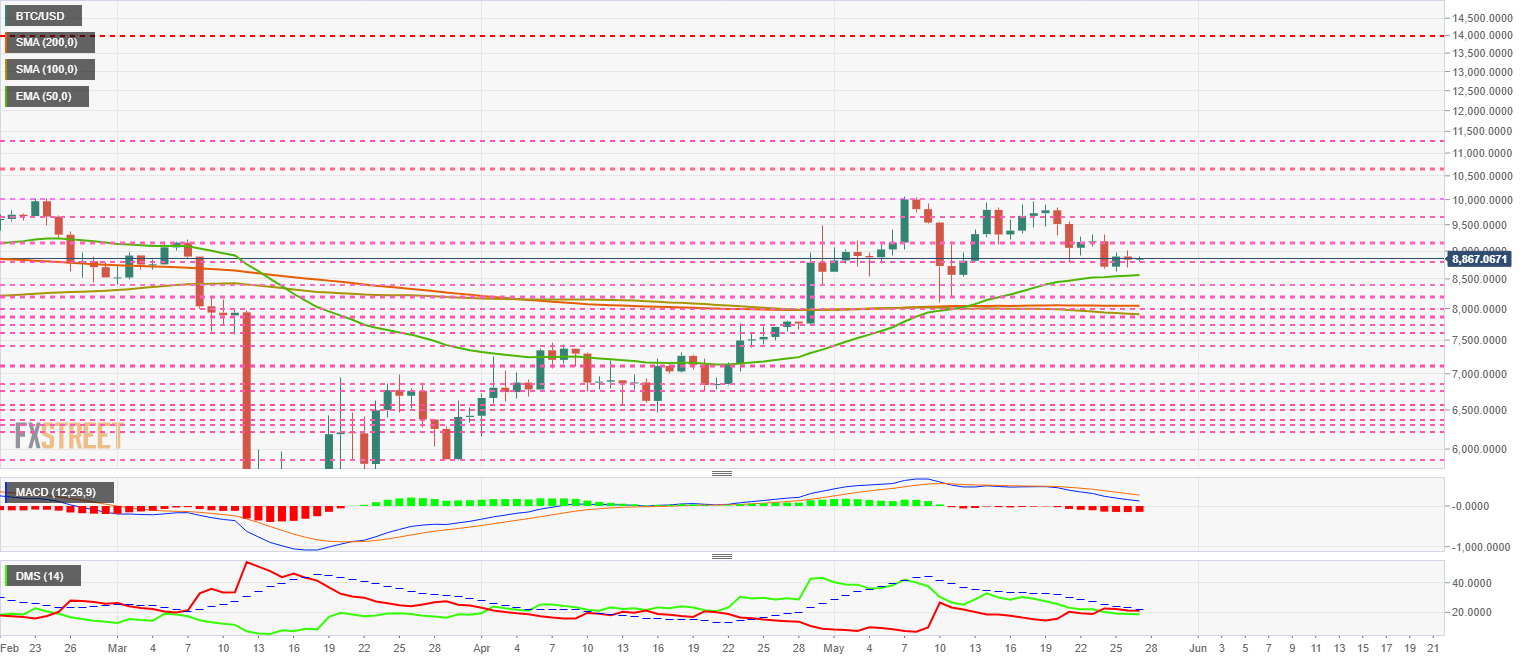
The MACD on the daily chart continues with the consolidation structure of the last few days. The neutral level of the indicator that would act as support is already very close and could support the Bitcoin price in the next sessions.
The DMI on the daily chart shows both sides of the market at similar price levels and both below the ADX line. The first one to cross this bullish trend indicator will have an advantage in consolidating as the leader of the BTC/USD pair.
ETH/USD Daily Chart
The ETH/USD pair is currently trading at $203.3 and is resisting attempts to bring it below $200 at the daily close. Ethereum is under bear control at the moment but shows significant underlying strength.
Above the current price, the first resistance level is at $208, then the second at $218 and the third one at $225.
Below the current price, the first support level is at $200, then the second at $195 and the third one at $190.
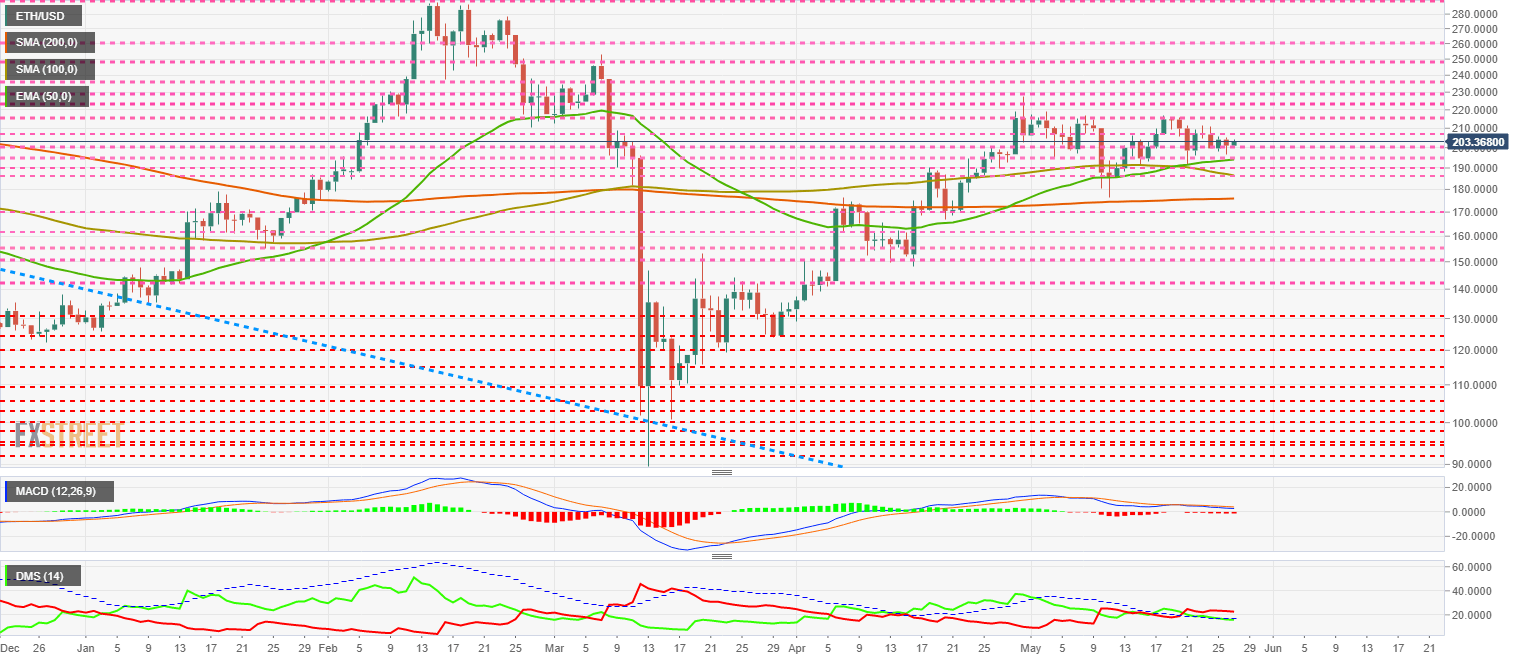
The MACD on the daily chart persists in showing a wholly flat and undirected profile. The current structure does not convey any information beyond following the positive zone of the indicator.
The DMI on the daily chart shows bulls drilling down the ADX line, which if confirmed at the daily close could lead to significant price declines in ETH/USD.
XRP/USD Daily Chart
The XRP/USD pair is currently trading at the price level of $0.1953 and confirms the narrow range between $0.195 and $0.20 as the most common one since late 2019. Major moving averages are accelerating downwards and announce possible visits to the $0.16-$0.18 zone in the coming weeks,
Above the current price, the first resistance level is at $0.20, then the second at $0.22 and the third one at $0.237.
Below the current price, the first support level is at $0.19, then the second at $0.18 and the third one at $0.163.
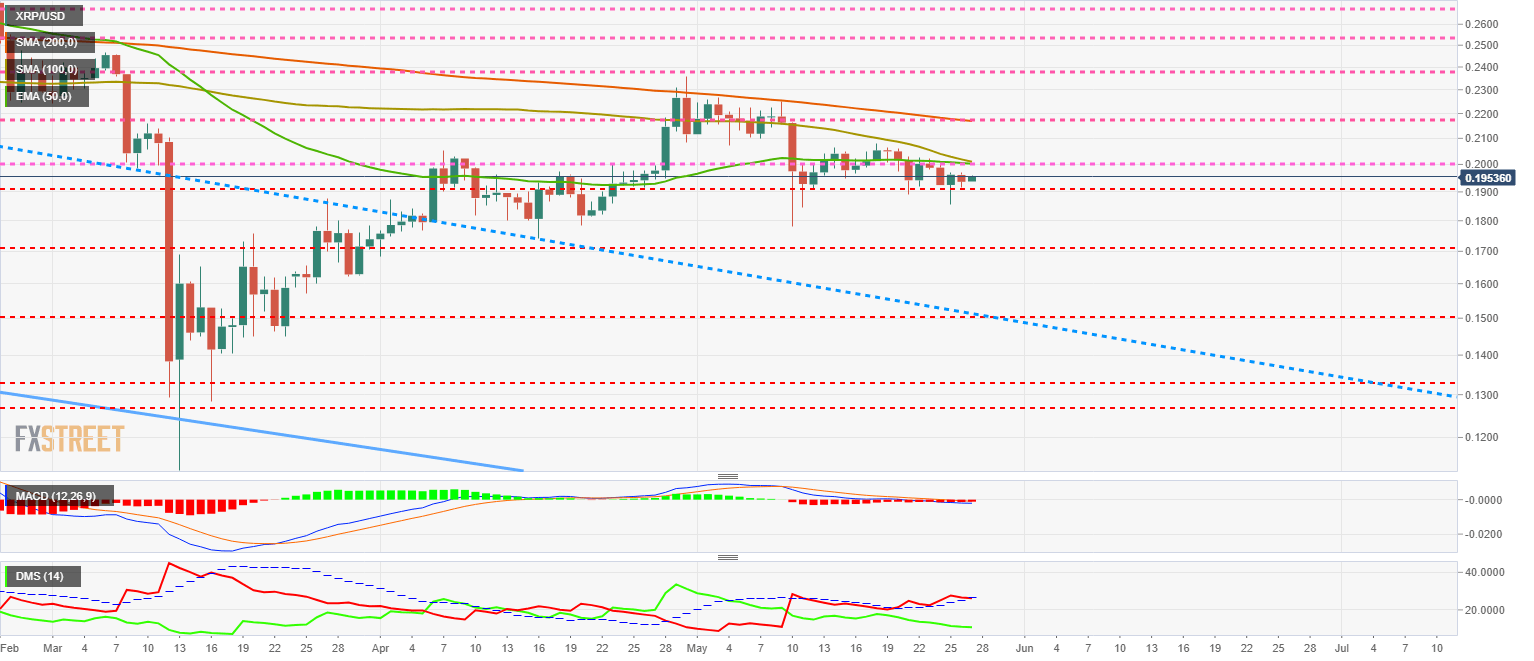
The MACD on the daily chart is already moving in the negative territory of the indicator. The moving averages are increasing their bearish profile.
The DMI on the daily chart shows bears supported by the ADX line. How this situation is resolved in the next few hours will determine the price development of the XRP/USD pair for the next few days. The bulls do not see it as a bullish move and continue with the bearish trend.
Author

Tomas Salles
FXStreet
Tomàs Sallés was born in Barcelona in 1972, he is a certified technical analyst after having completing specialized courses in Spain and Switzerland. He expanded his technical training following the guidance of great experts on the financial markets.




