Top 3 meme coins to watch for portfolio recovery after inflation sell-off
- Dogecoin holds above the 50-day, 100-day and 200-day EMAs, signaling a potential rebound.
- Bonk defends the Cup-and-Handle pattern’s neckline, increasing recovery probability.
- SPX6900 edges lower as the RSI approaches overbought territory, hinting at a potential rebound.

The cryptocurrency market faced a sudden volatility surge on Thursday, reflecting the change in sentiment following the release of the US Producer Price Index (PPI) data by the Bureau of Labor Statistics (BLS) earlier in the day. Bitcoin (BTC) led the flash sell-off, testing support at around $117,000 after hitting a new record high of $124,474.
According to the PPI data, wholesale prices of goods and services rose significantly in July, indicating that consumers are likely to pay more in the coming months. This is of utmost concern to to many investors in risk assets, who are worried that the Federal Reserve (Fed) might reconsider cutting rates for the first time this year in September. If inflation continues to tick up ahead of the Federal Open Market Committee (FOMC) meeting, the probability of rate cuts would decline, impacting the performance of risk assets such as Bitcoin and altcoins.
The prices of cryptocurrencies hint at short-term stability following the intraday pullback. Hence, there’s a need for investors to choose digital assets that could boost portfolio recovery. Tokens that could be of interest for investors include Dogecoin (DOGE), Bonk (BONK) and SPX6900.
Dogecoin could lead meme coin recovery
Dogecoin holds above key moving averages, including the 50-day Exponential Moving Average (EMA) at $0.2131, the 200-day EMA at $0.2091 and the 100-day EMA at $0.2069. These levels will serve as tentative support if the decline extends below the short-term support at $0.2200, tested July 25.
If Dogecoin recovers from immediate support, traders will shift their attention to higher levels such as the hurdle at $0.25, tested on Wednesday, and the July peak of $0.28.
Still, the downward trend of the Relative Strength Index (RSI) near the midline indicates a reduction in buying pressure, which could subdue recovery in the short term.
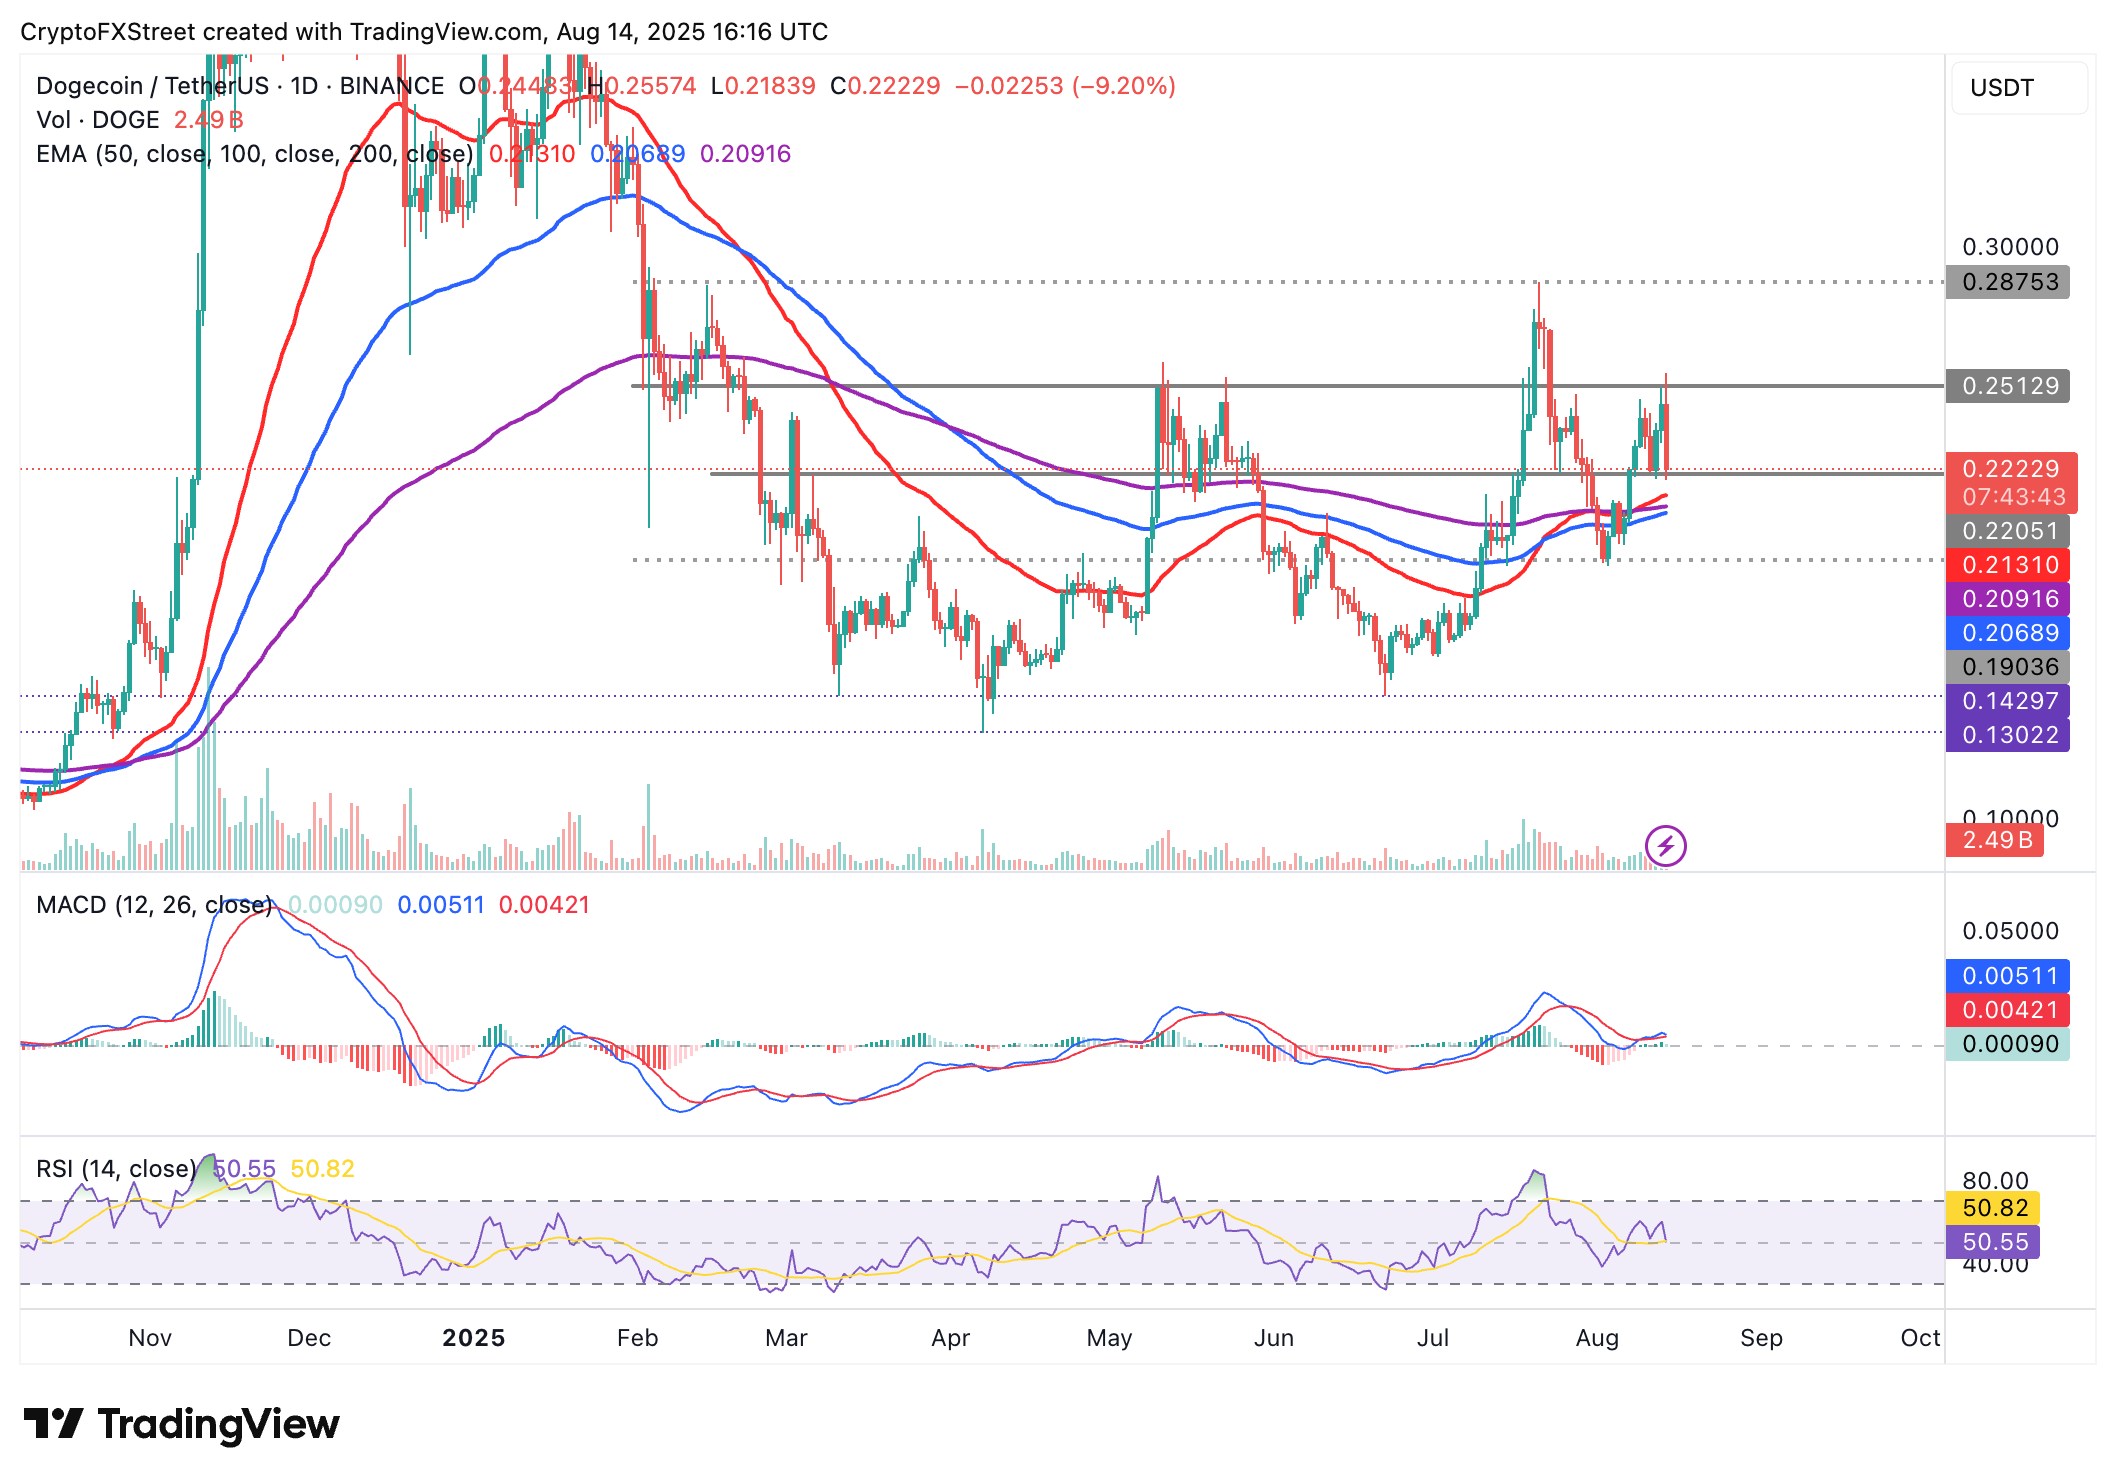
DOGE/USDT daily chart
Bonk defends key support
Bonk price is down over 12% on the day, trading at around $0.000026 at the time of writing. The meme coin also holds above a Cup-and-Handle pattern’s neckline resistance-turned-support around $0.000025.
The 100-day EMA at $0.000023 is in line to absorb selling pressure if the decline accelerates below the neckline.
At the same time, traders should be on the lookout for a buy signal from the Moving Average Convergence Divergence (MACD) indicator. Such a signal, calling on investors to increase exposure, manifests with the blue MACD line crossing above the red signal line. A trend reversal from the immediate support would increase the chances of the Solana-based meme coin rallying to tag the July peak of $0.00004074.
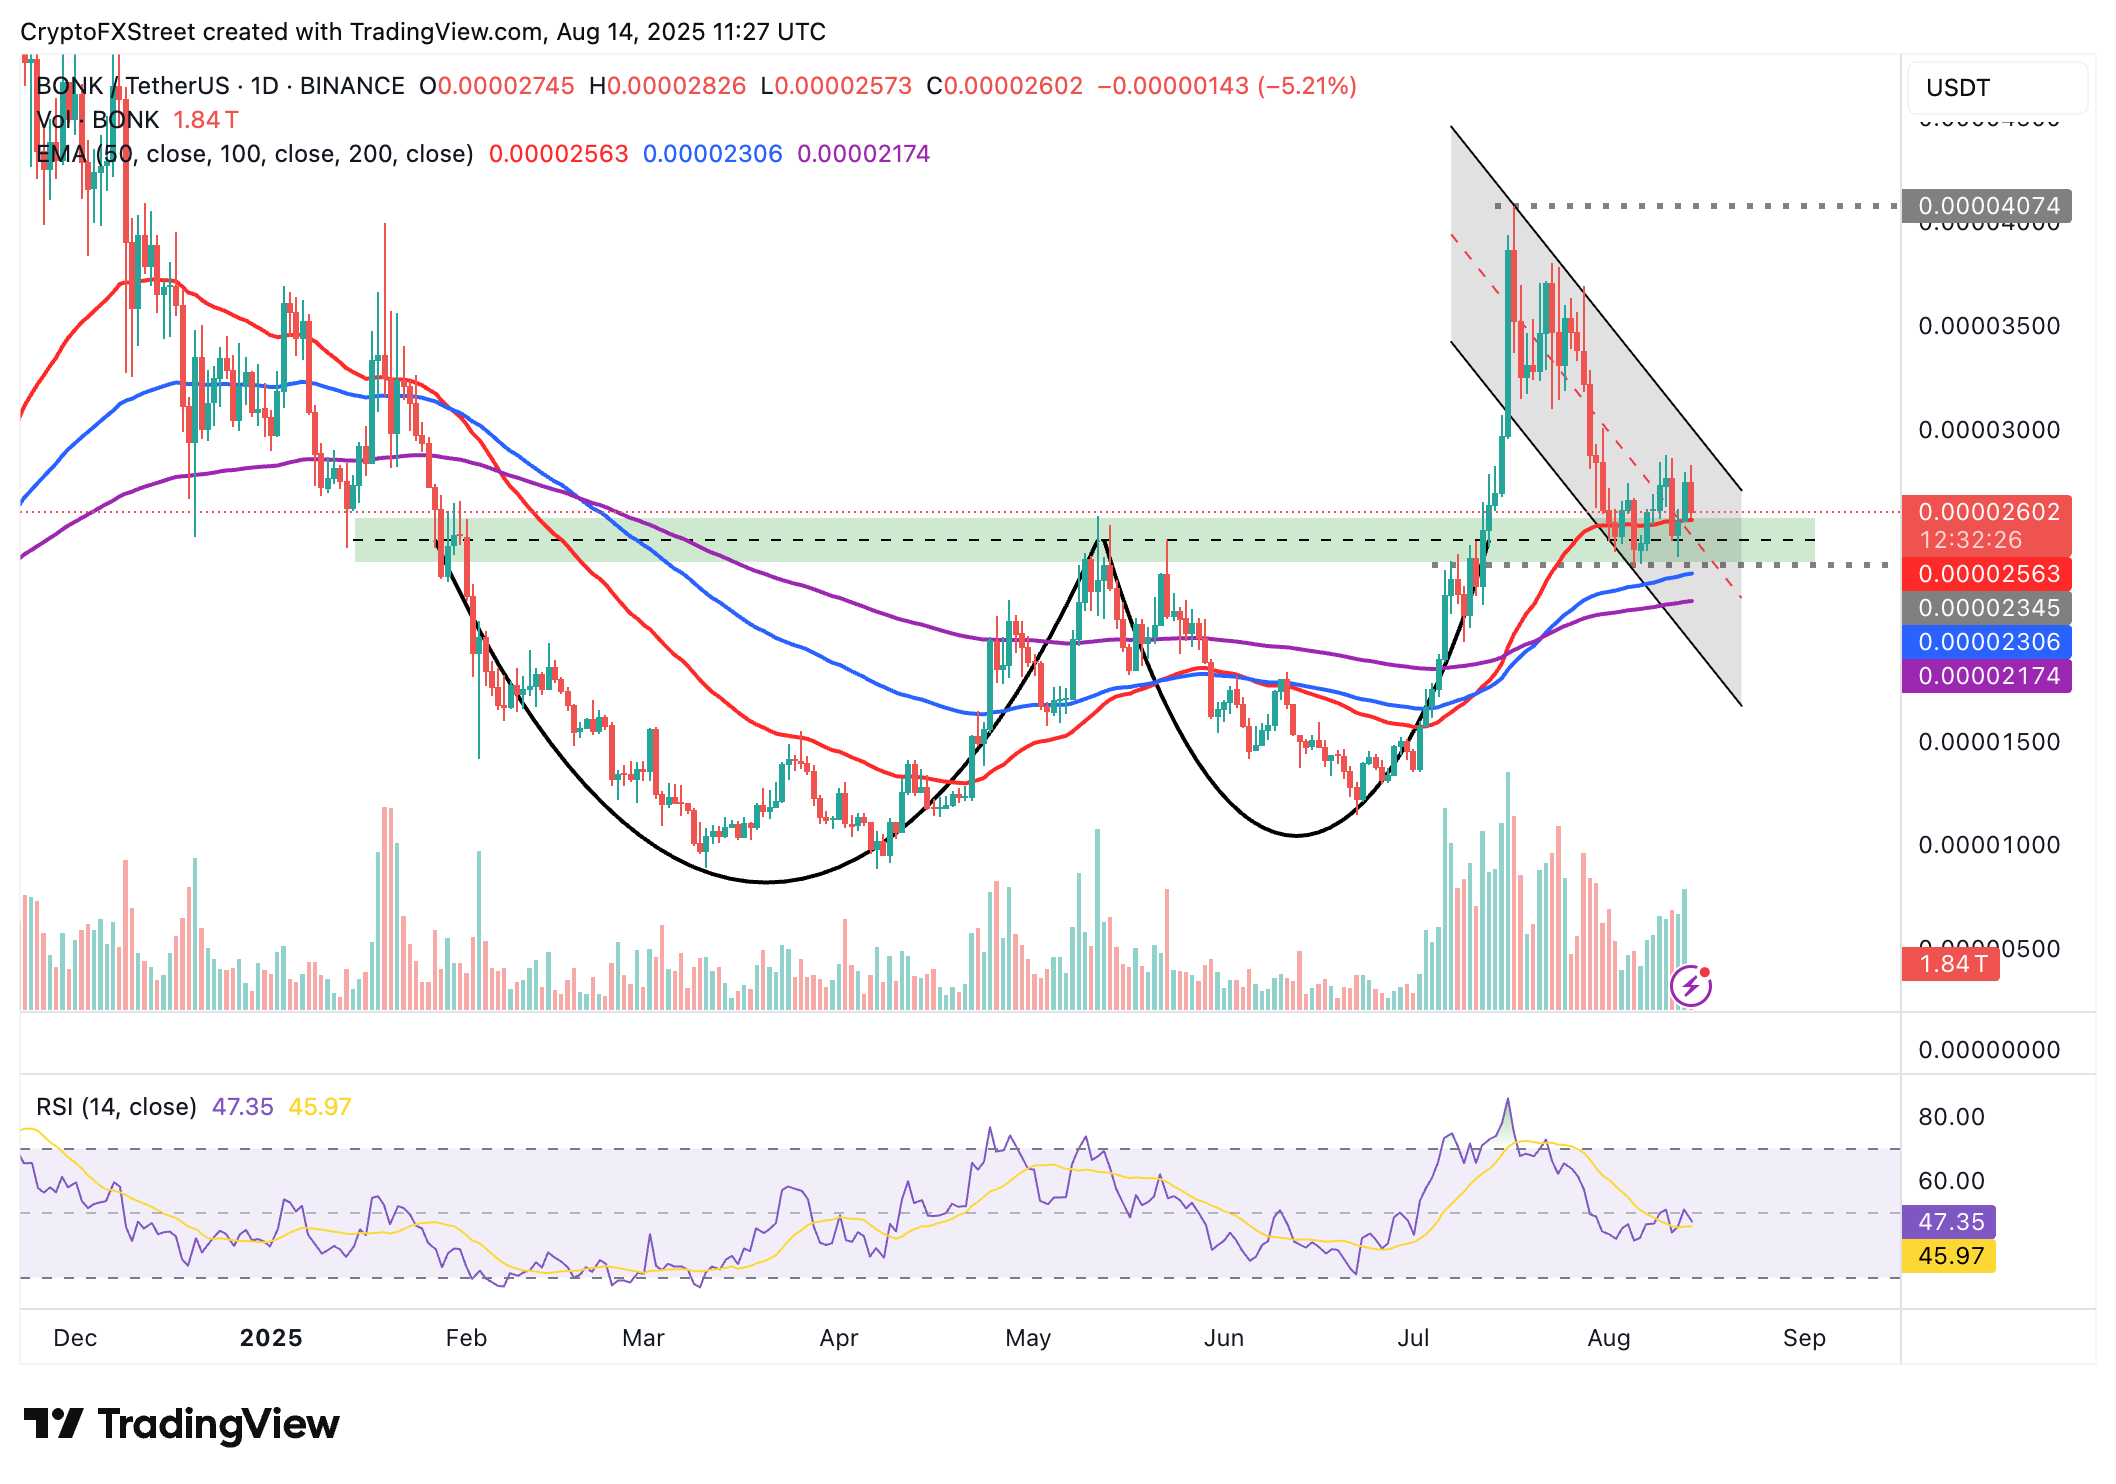
BONK/USDT daily chart
As for SPX6900, the path of least resistance is downward, backed by the RSI’s decline near oversold territory on the 4-hour chart. The MACD also dons a sell signal likely to uphold the bearish bias. If the decline extends, traders may want to prepare for potential support at around $1.40, tested in early August and mid-July.
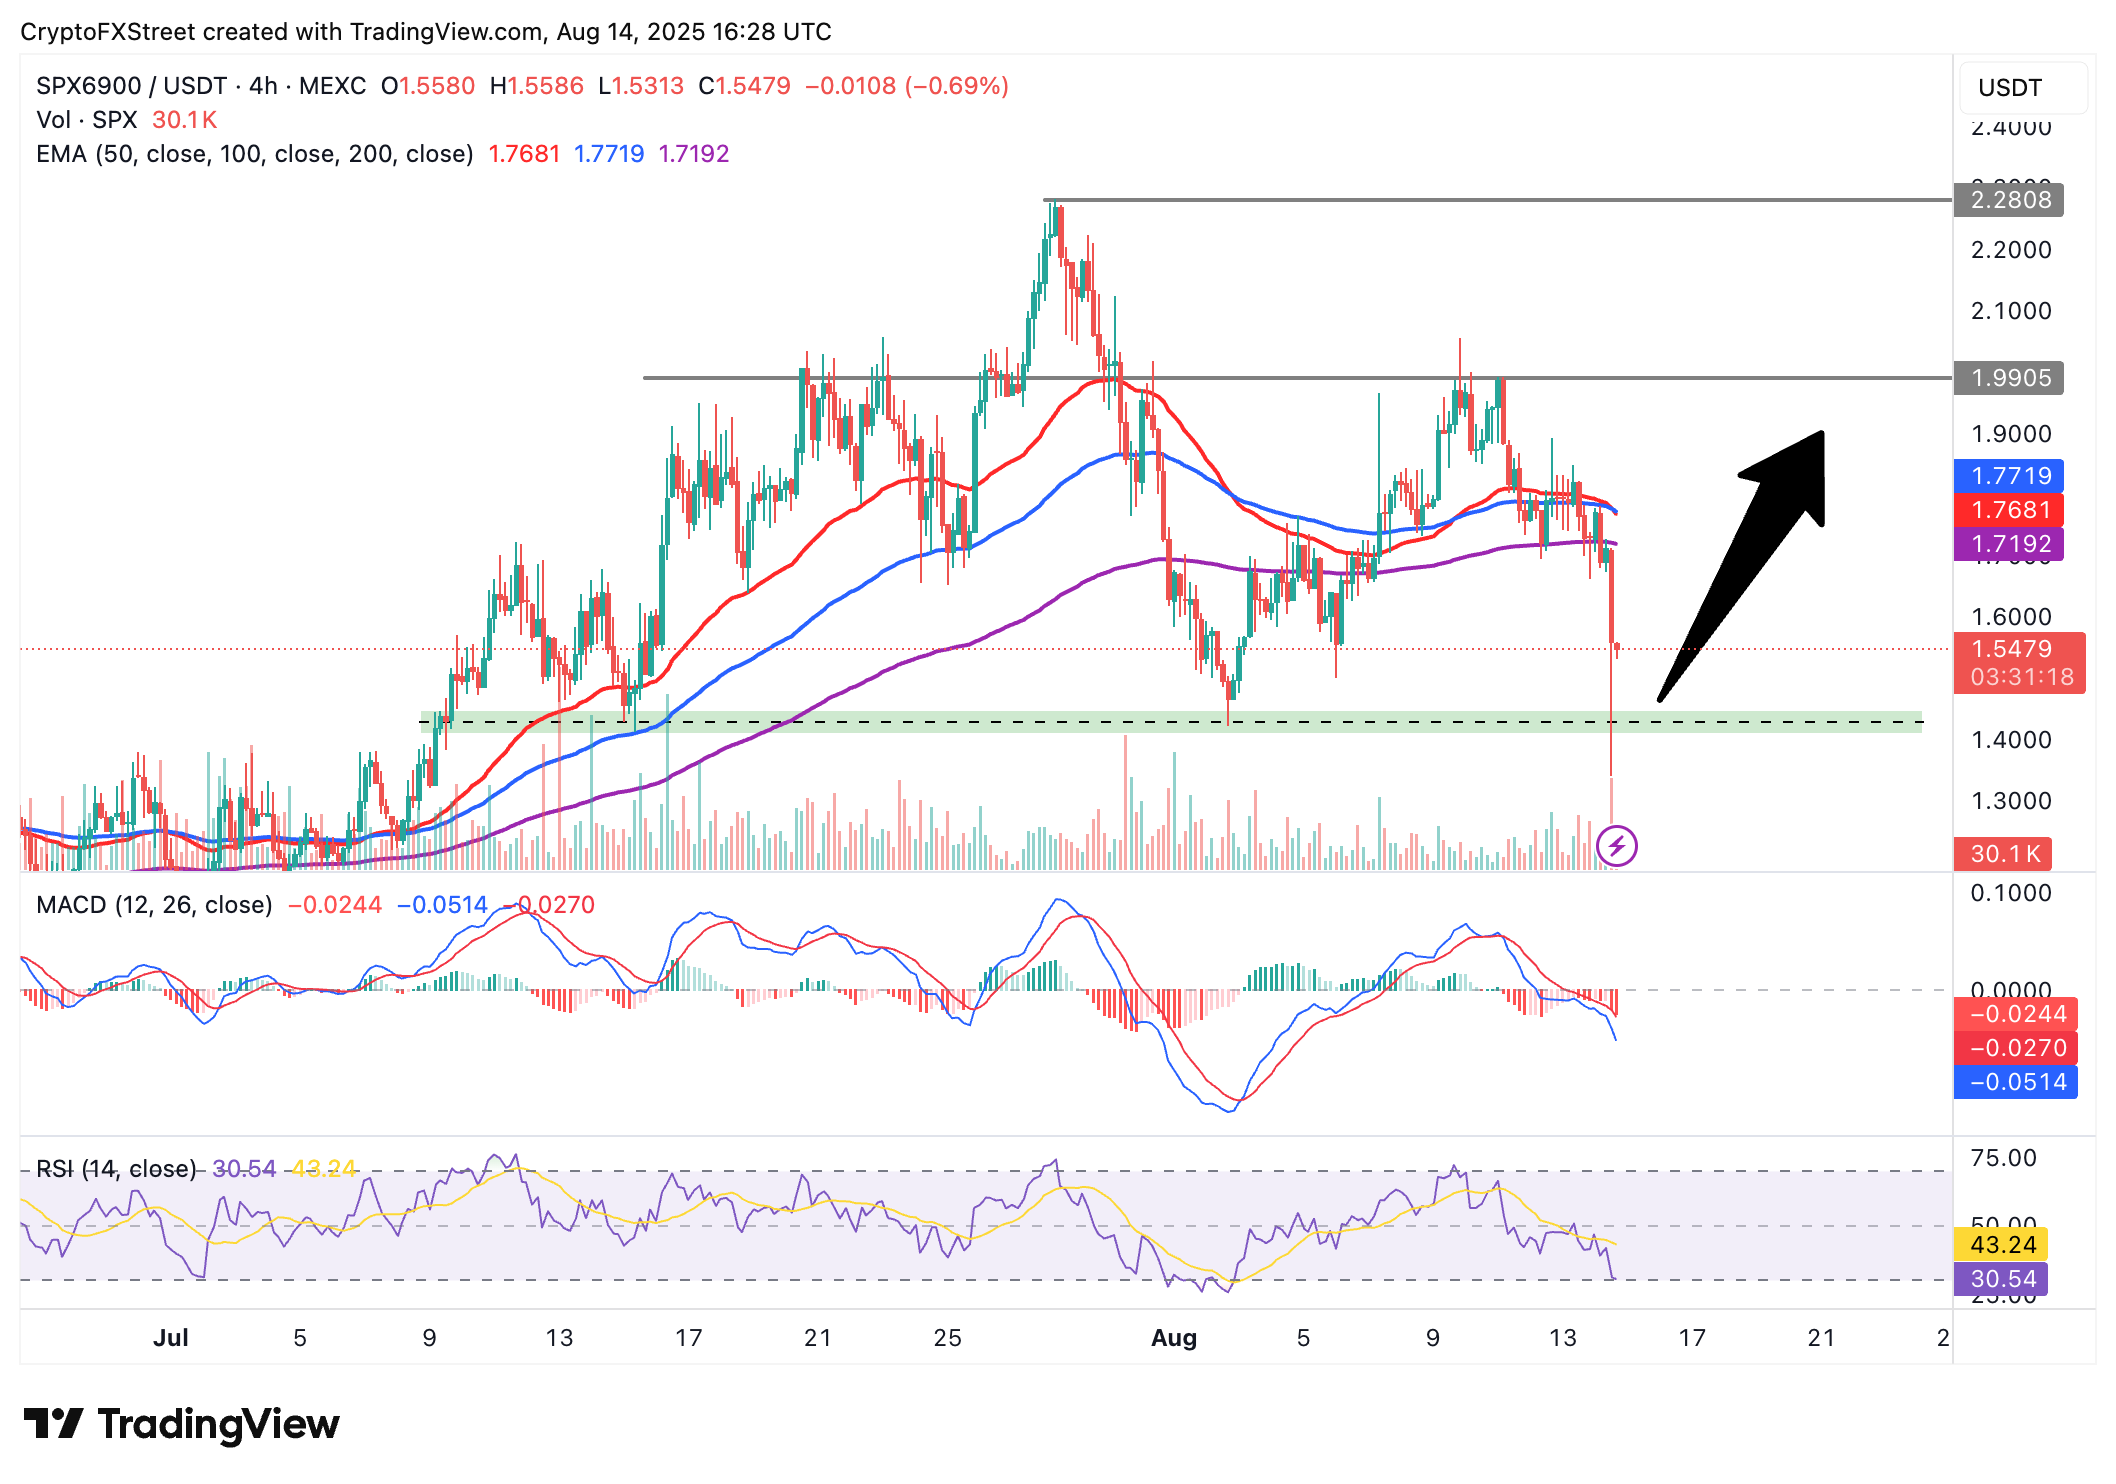
SPX/USDT 4-hour chart
Still, a recovery could ensue from $1.55, SPX’s current level, especially with the RSI entering oversold territory. Key targets on the upside range from the 200-period EMA at $1.71, the seller congestion at $2.00 and SPX’s July peak of $2.28.
Cryptocurrency prices FAQs
Token launches influence demand and adoption among market participants. Listings on crypto exchanges deepen the liquidity for an asset and add new participants to an asset’s network. This is typically bullish for a digital asset.
A hack is an event in which an attacker captures a large volume of the asset from a DeFi bridge or hot wallet of an exchange or any other crypto platform via exploits, bugs or other methods. The exploiter then transfers these tokens out of the exchange platforms to ultimately sell or swap the assets for other cryptocurrencies or stablecoins. Such events often involve an en masse panic triggering a sell-off in the affected assets.
Macroeconomic events like the US Federal Reserve’s decision on interest rates influence crypto assets mainly through the direct impact they have on the US Dollar. An increase in interest rate typically negatively influences Bitcoin and altcoin prices, and vice versa. If the US Dollar index declines, risk assets and associated leverage for trading gets cheaper, in turn driving crypto prices higher.
Halvings are typically considered bullish events as they slash the block reward in half for miners, constricting the supply of the asset. At consistent demand if the supply reduces, the asset’s price climbs.
Author

John Isige
FXStreet
John Isige is a seasoned cryptocurrency journalist and markets analyst committed to delivering high-quality, actionable insights tailored to traders, investors, and crypto enthusiasts. He enjoys deep dives into emerging Web3 tren


