Top 3 Gainers Fartcoin, Dogwifhat, Popcat: Meme coins lead altcoins rally exploding alongside Bitcoin
- Bitcoin hits new all-time highs above $111,000, driven by increasing concerns about US debt sustainability.
- Fartcoin flips key resistance around $1.20 into support as bulls aim for all-time highs at approximately $2.73.
- Dogwifhat extends bull flag pattern breakout targeting highs around $1.74.
- Popcat’s rally follows a descending triangle pattern’s breakout with a 29% target, supported by increasing volume.

Cryptocurrencies broadly extend gains on Thursday, propelled by Bitcoin’s (BTC) surge to new all-time highs at around $111,880. Meanwhile, altcoins continue to gain strength, with Bitcoin dominance (BTC.D) sliding to approximately 63.84%, buoyed by significant rallies in meme coins such as Fartcoin (FARTCOIN), Dogwifhat (WIF) and Popcat (POPCAT).
Bitcoin’s bullish momentum builds on the Digital Gold narrative
The remarkable uptick in Bitcoin’s price has been driven by increasing concerns about the sustainability of the United States (US) debt. Moody’s exacerbated the concerns after stripping the US of its top credit rating on May 16, amid soaring debt levels and an expanding deficit. The ratings agency brought down the world’s largest economy’s “Aaa” rating to “Aa1” for the first time since 1919.
This downgrade echoes earlier actions by the other major ratings agencies: S&P stripped the US of its triple-A rating in August 2011, followed by Fitch in August 2023.
Moreover, the downgrade signals the increasing risk of US Treasury securities, conventionally seen as the world’s safest asset. Meanwhile, Bitcoin is emerging as a hedge against perceived instability in the traditional finance sector. Gold and Bitcoin are expected to gain momentum amid growing concerns about the value of the US dollar (USD) as well as Bond prices.
Bitcoin’s capped supply of 21 million coins positions it as a compelling choice for investors seeking scarcity-driven value.
In the meantime, BTC’s price hovers at around $110,666 at the time of writing, up nearly 1% on the day. The Moving Average Convergence Divergence (MACD) indicator’s position is significantly above the center line, which supports the bullish outlook.
Still, traders should tread carefully with the Relative Strength Index (RSI) signaling overbought conditions at 76, as such levels often foreshadow a potential pullback.
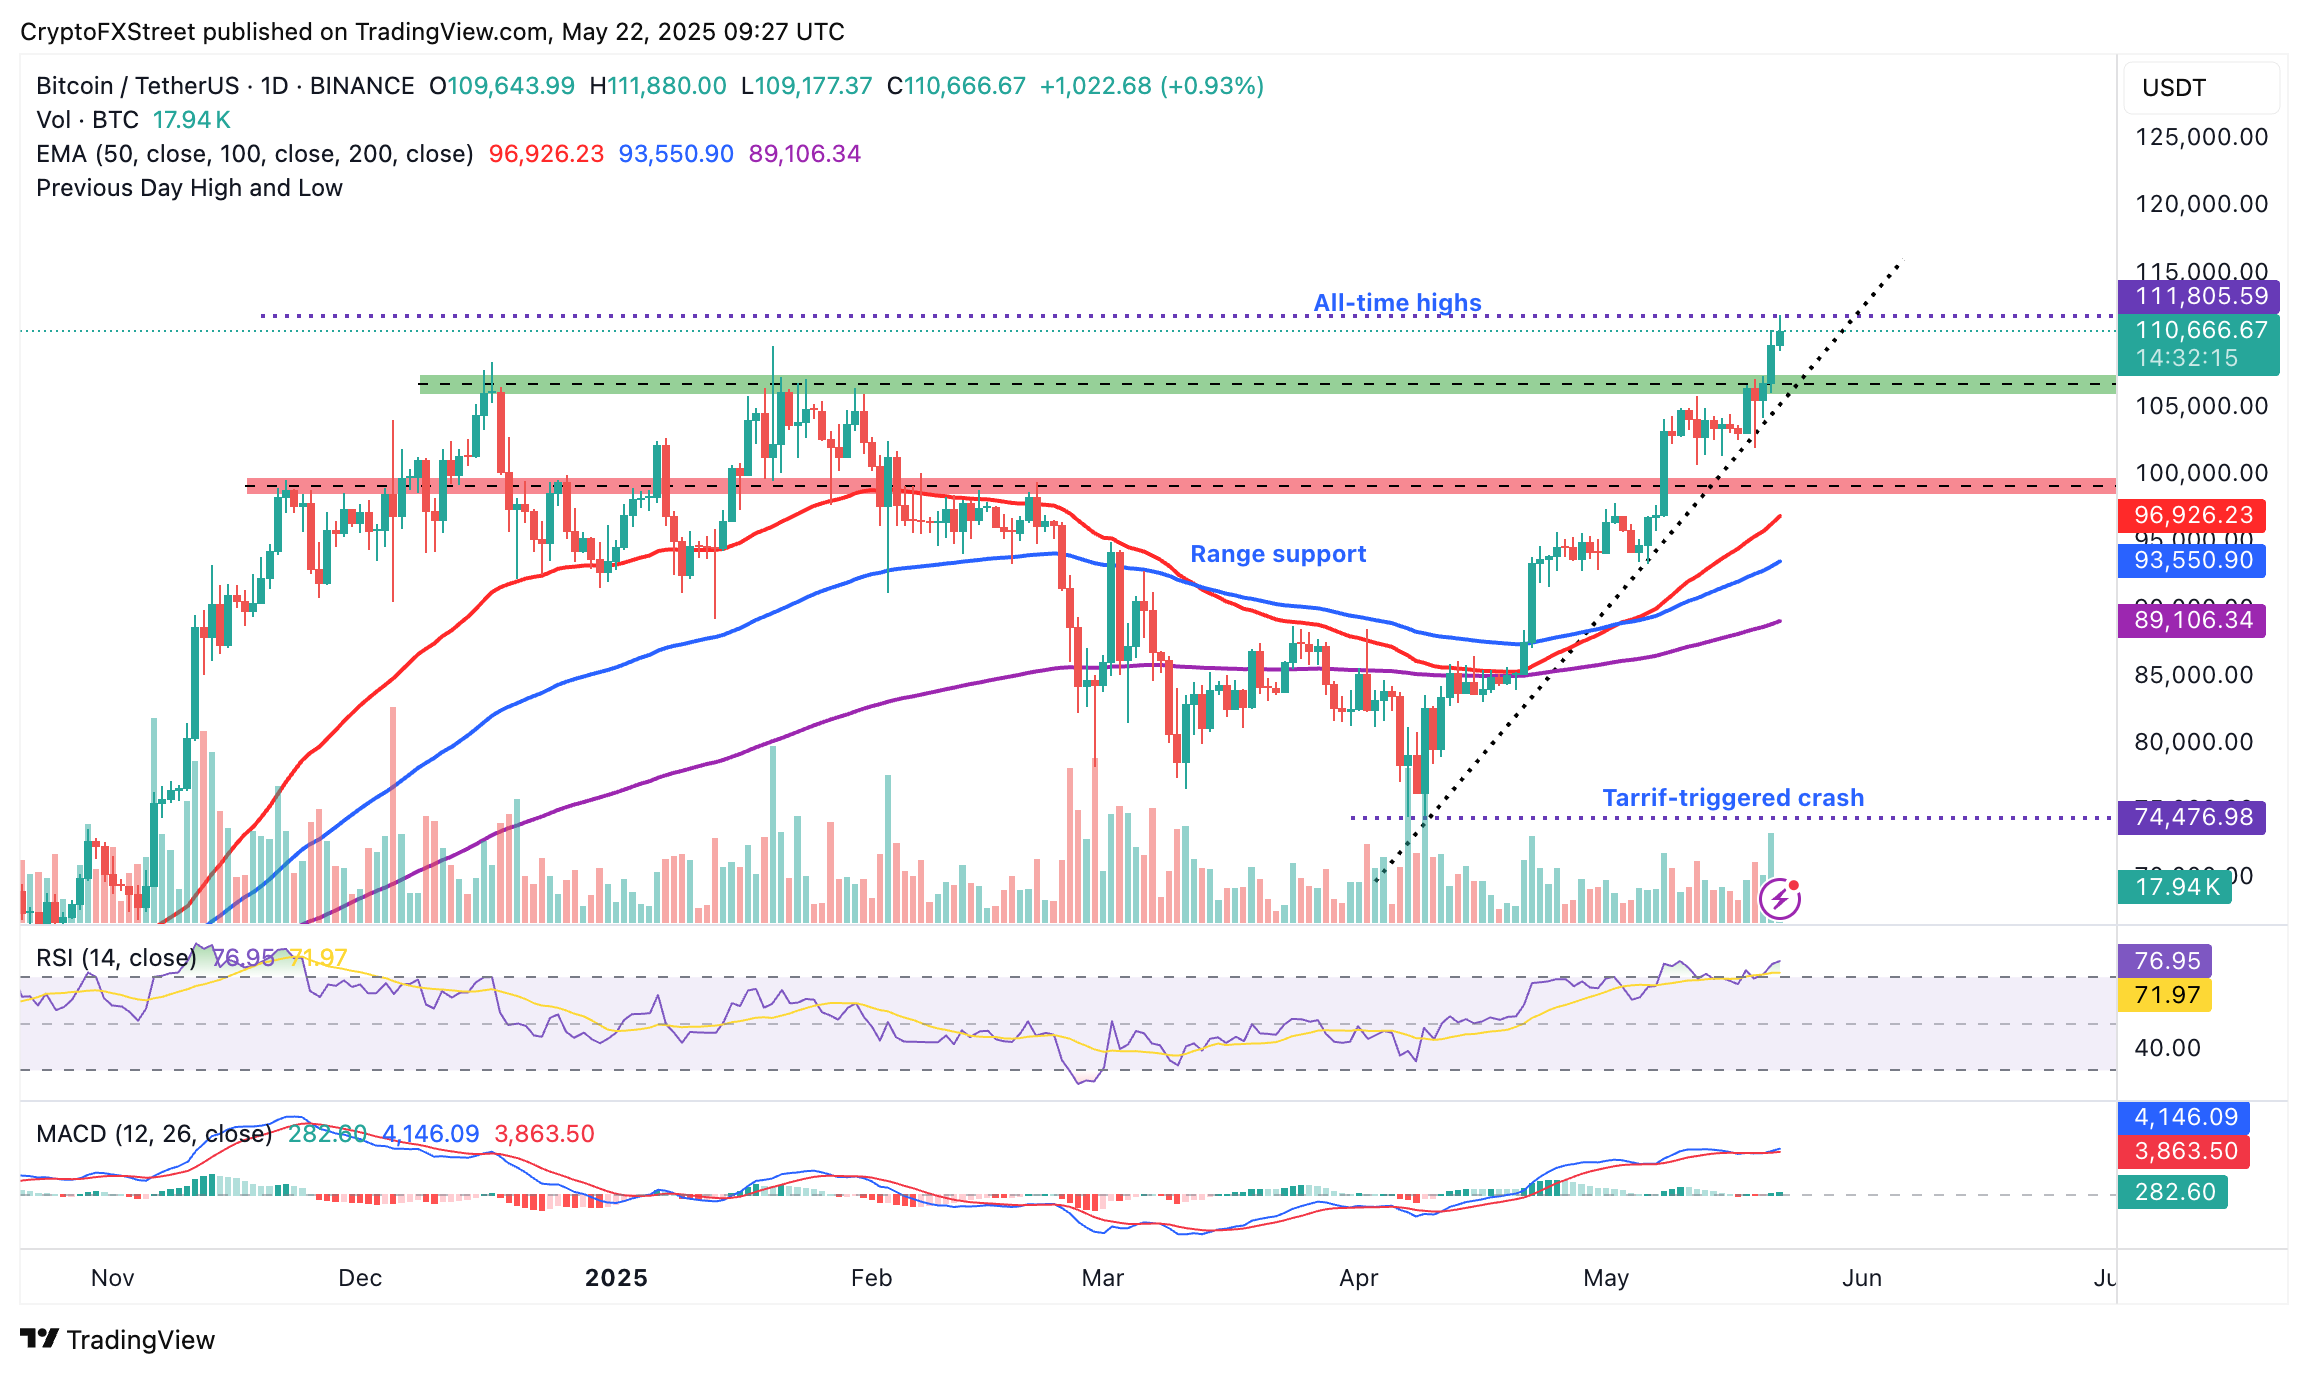
BTC/USDT daily chart
Meme coins rally, posting double-digit gains in 24 hours
Meme coins, including Fartcoin, explored higher highs alongside Bitcoin as sentiment improved in the crypto market. Fartcoin’s price trades at $1.56, up over 10% on the day. The token is testing short-term resistance at around $1.60, which is highlighted in red on the daily chart below.
The path with the least resistance is strongly upward with the RSI at 64 indicating bullish momentum while below the overbought region. Traders will likely continue to buy Fartcoin if the MACD indicator validates a buy signal in the daily time frame. This signal manifests when the MACD line (blue) crosses above the signal line (red).
Beyond the short-term hurdle at $1.60, traders could monitor higher levels at $2.00 and the all-time high at around $2.73, which could act as solid resistance areas.
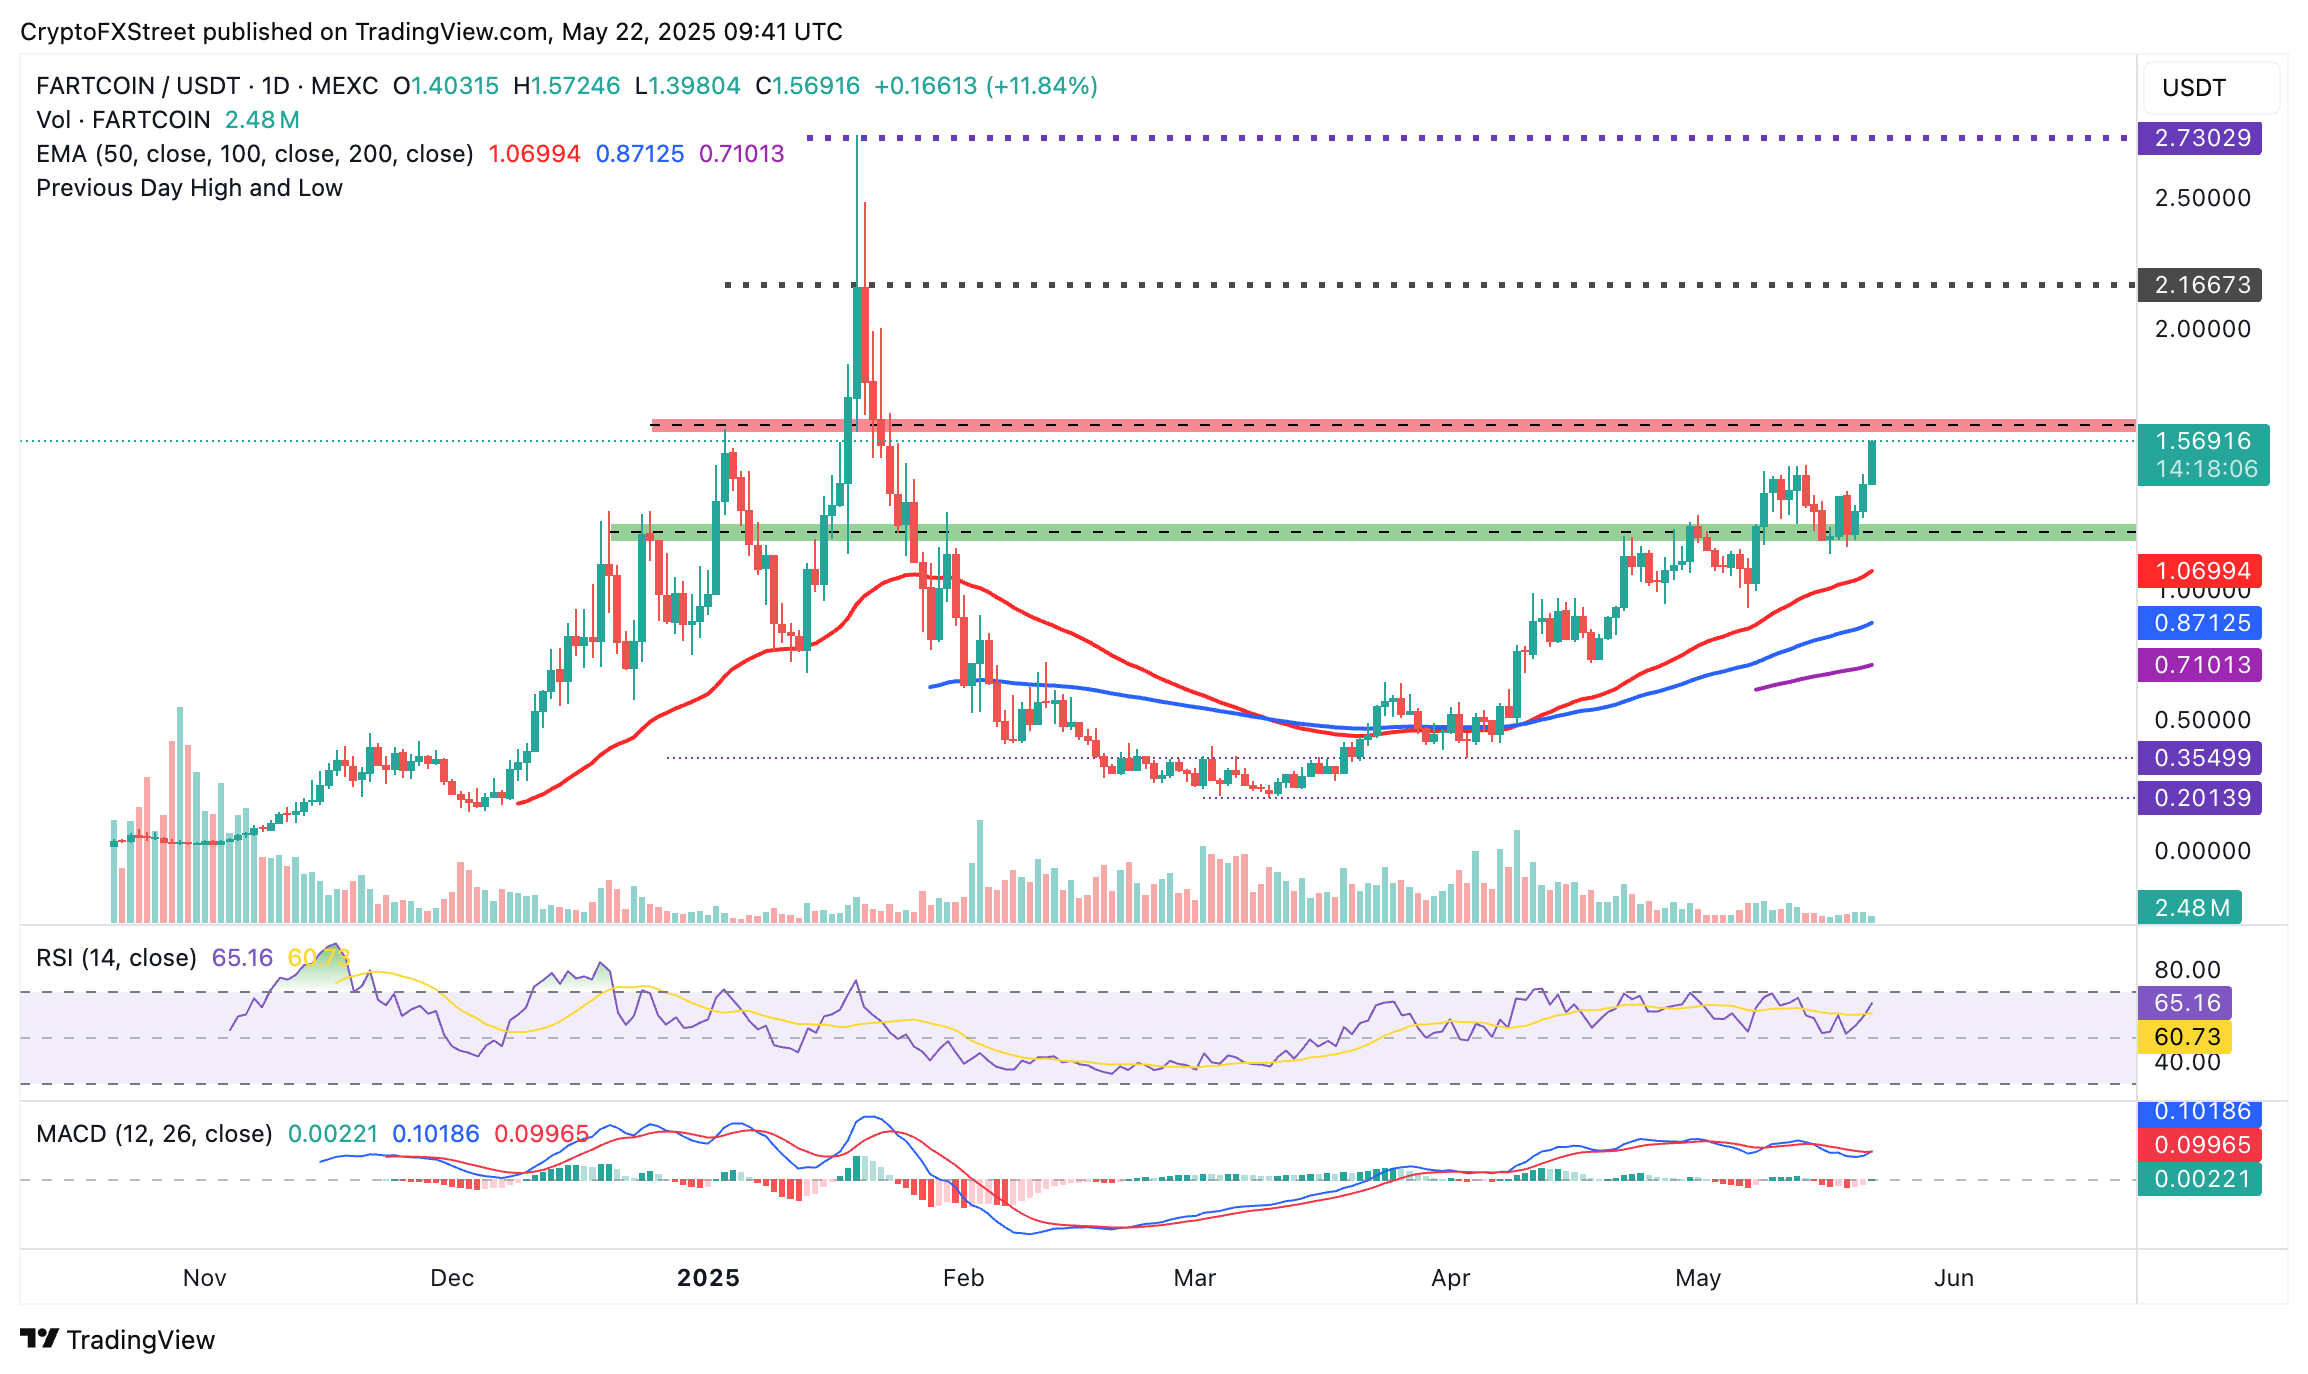
FARTCOIN/USDT daily chart
On the other hand, Dogwifhat flaunts a solid bullish structure, following a breakout from a bull flag pattern illustrated on the 4-hour chart below. The meme coin exchanges hands at around $1.15, with the former resistance at $1.00 acting as the near-term support.
The breakout from the bull flag pattern projects a potential 75% increase in value to $1.74, as discussed on Wednesday. Since the RSI indicator at 63 is not yet overbought, WIF has room to grow, supported by a buy signal from the MACD indicator.
The expanding green histogram bars above the center line signal a strong bullish momentum as bulls exert dominance, increasing the probability of a potential recovery to $1.74.
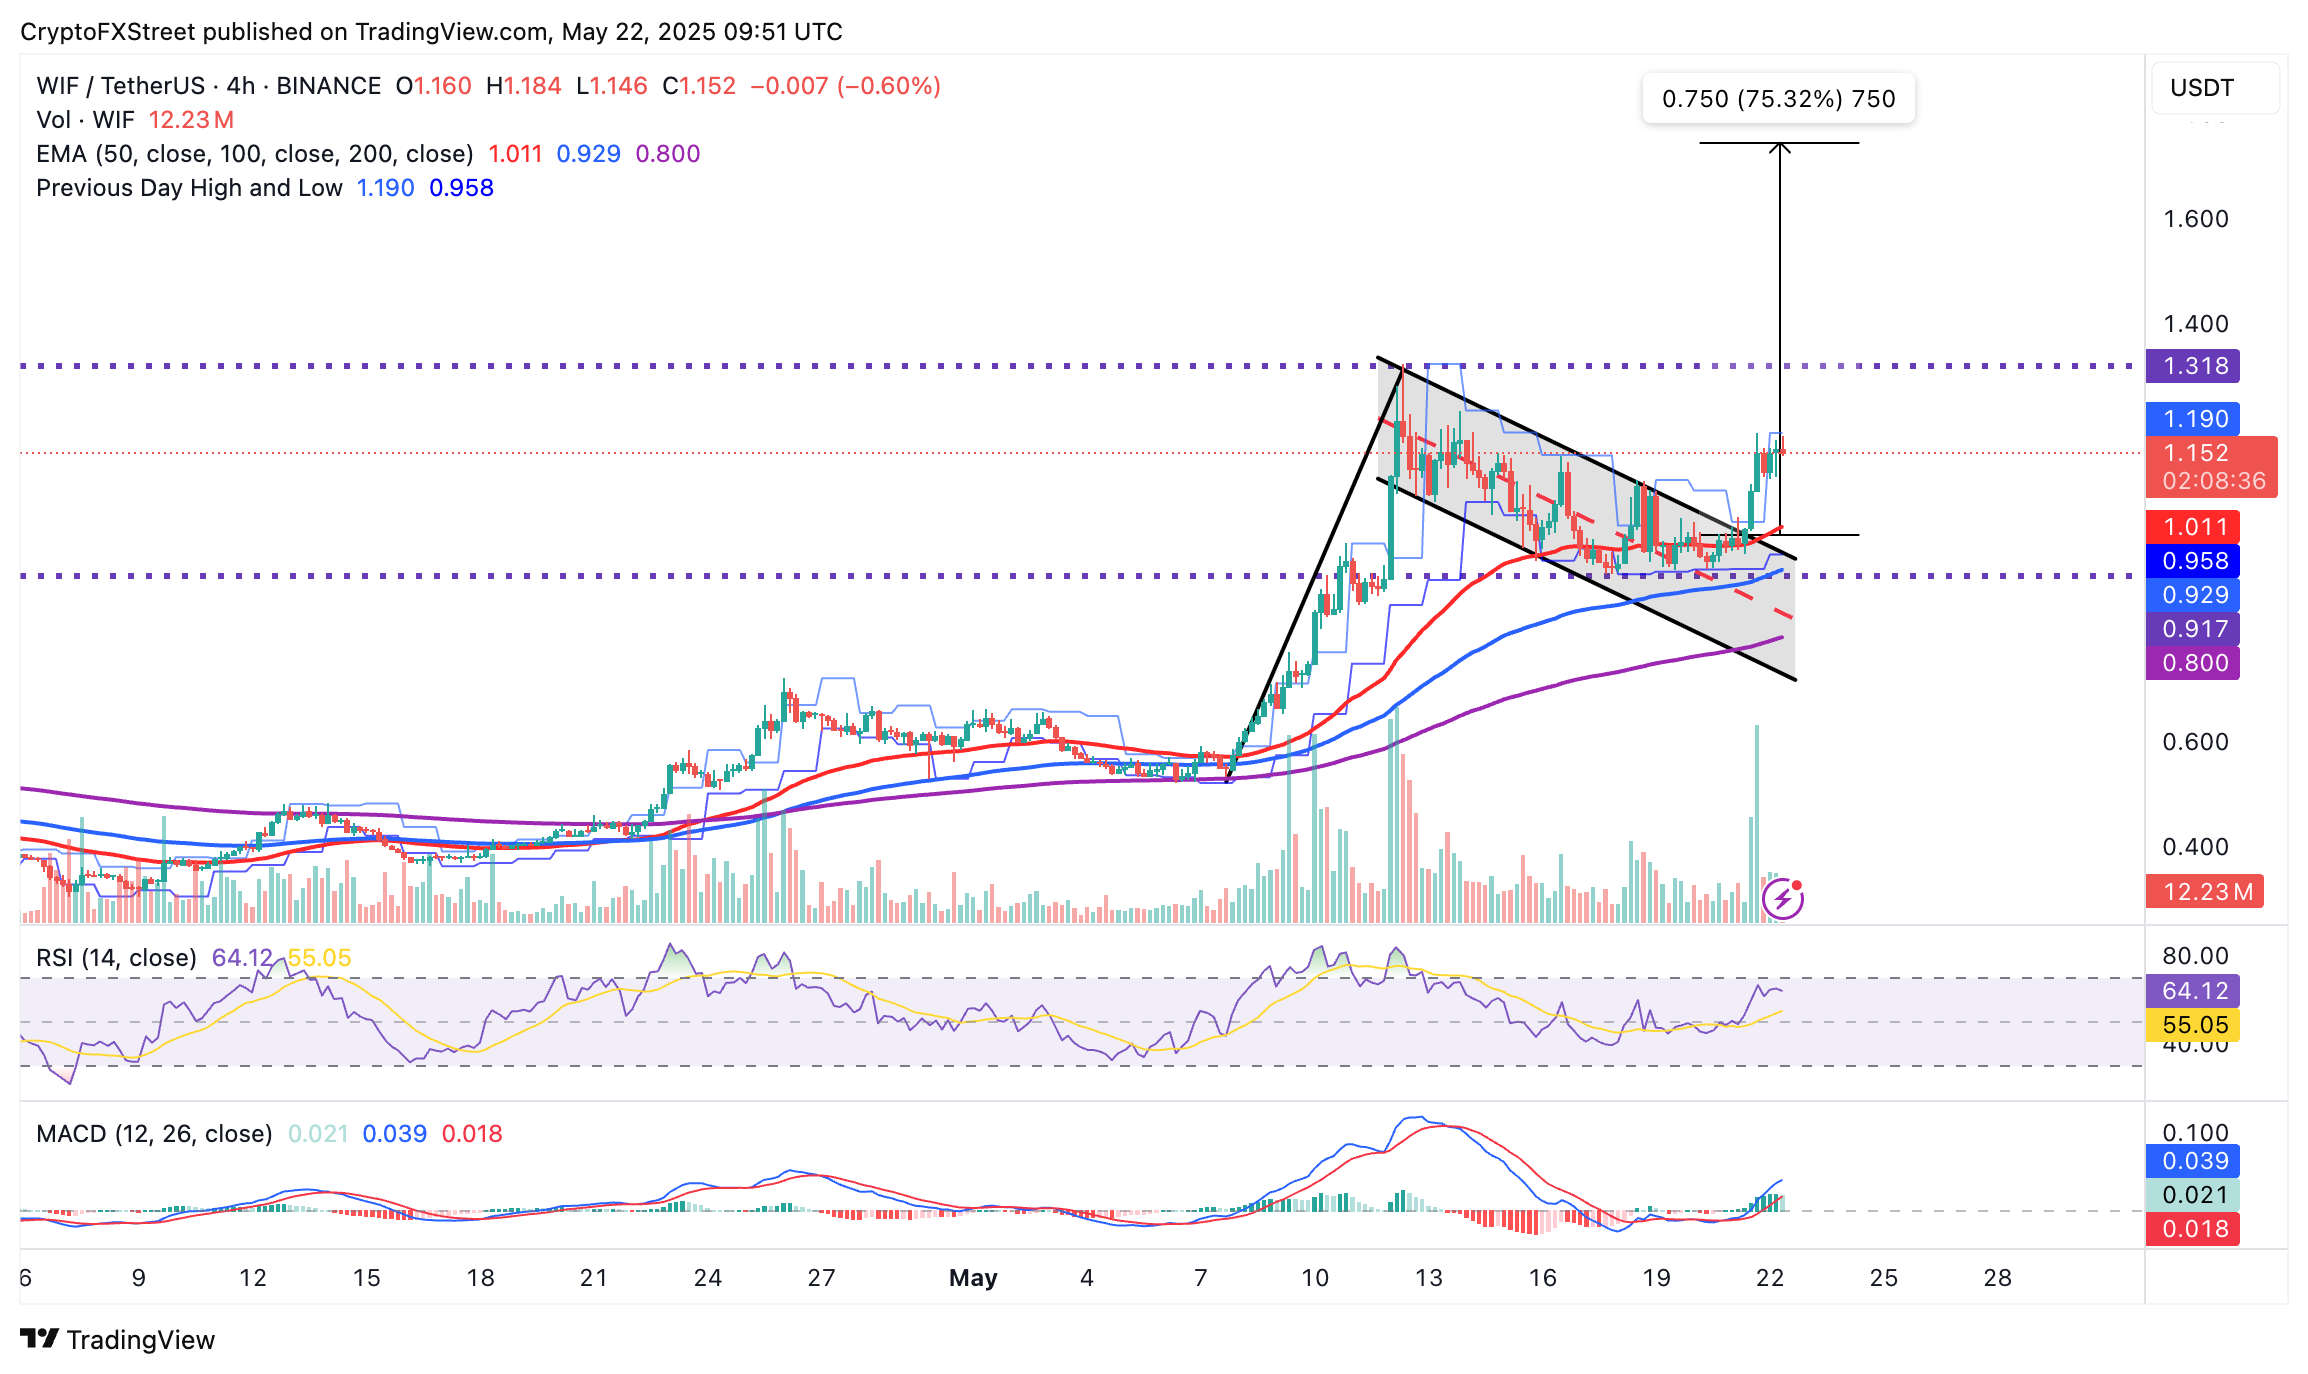
WIF/USDT 4-hour chart
Popcat, like the other two meme coins, has surged by over 10% on the day to $0.54 at the time of writing. A validated falling wedge pattern projects a target at $0.56, calculated by extrapolating the distance between the pattern’s widest points above the upper descending trend line.
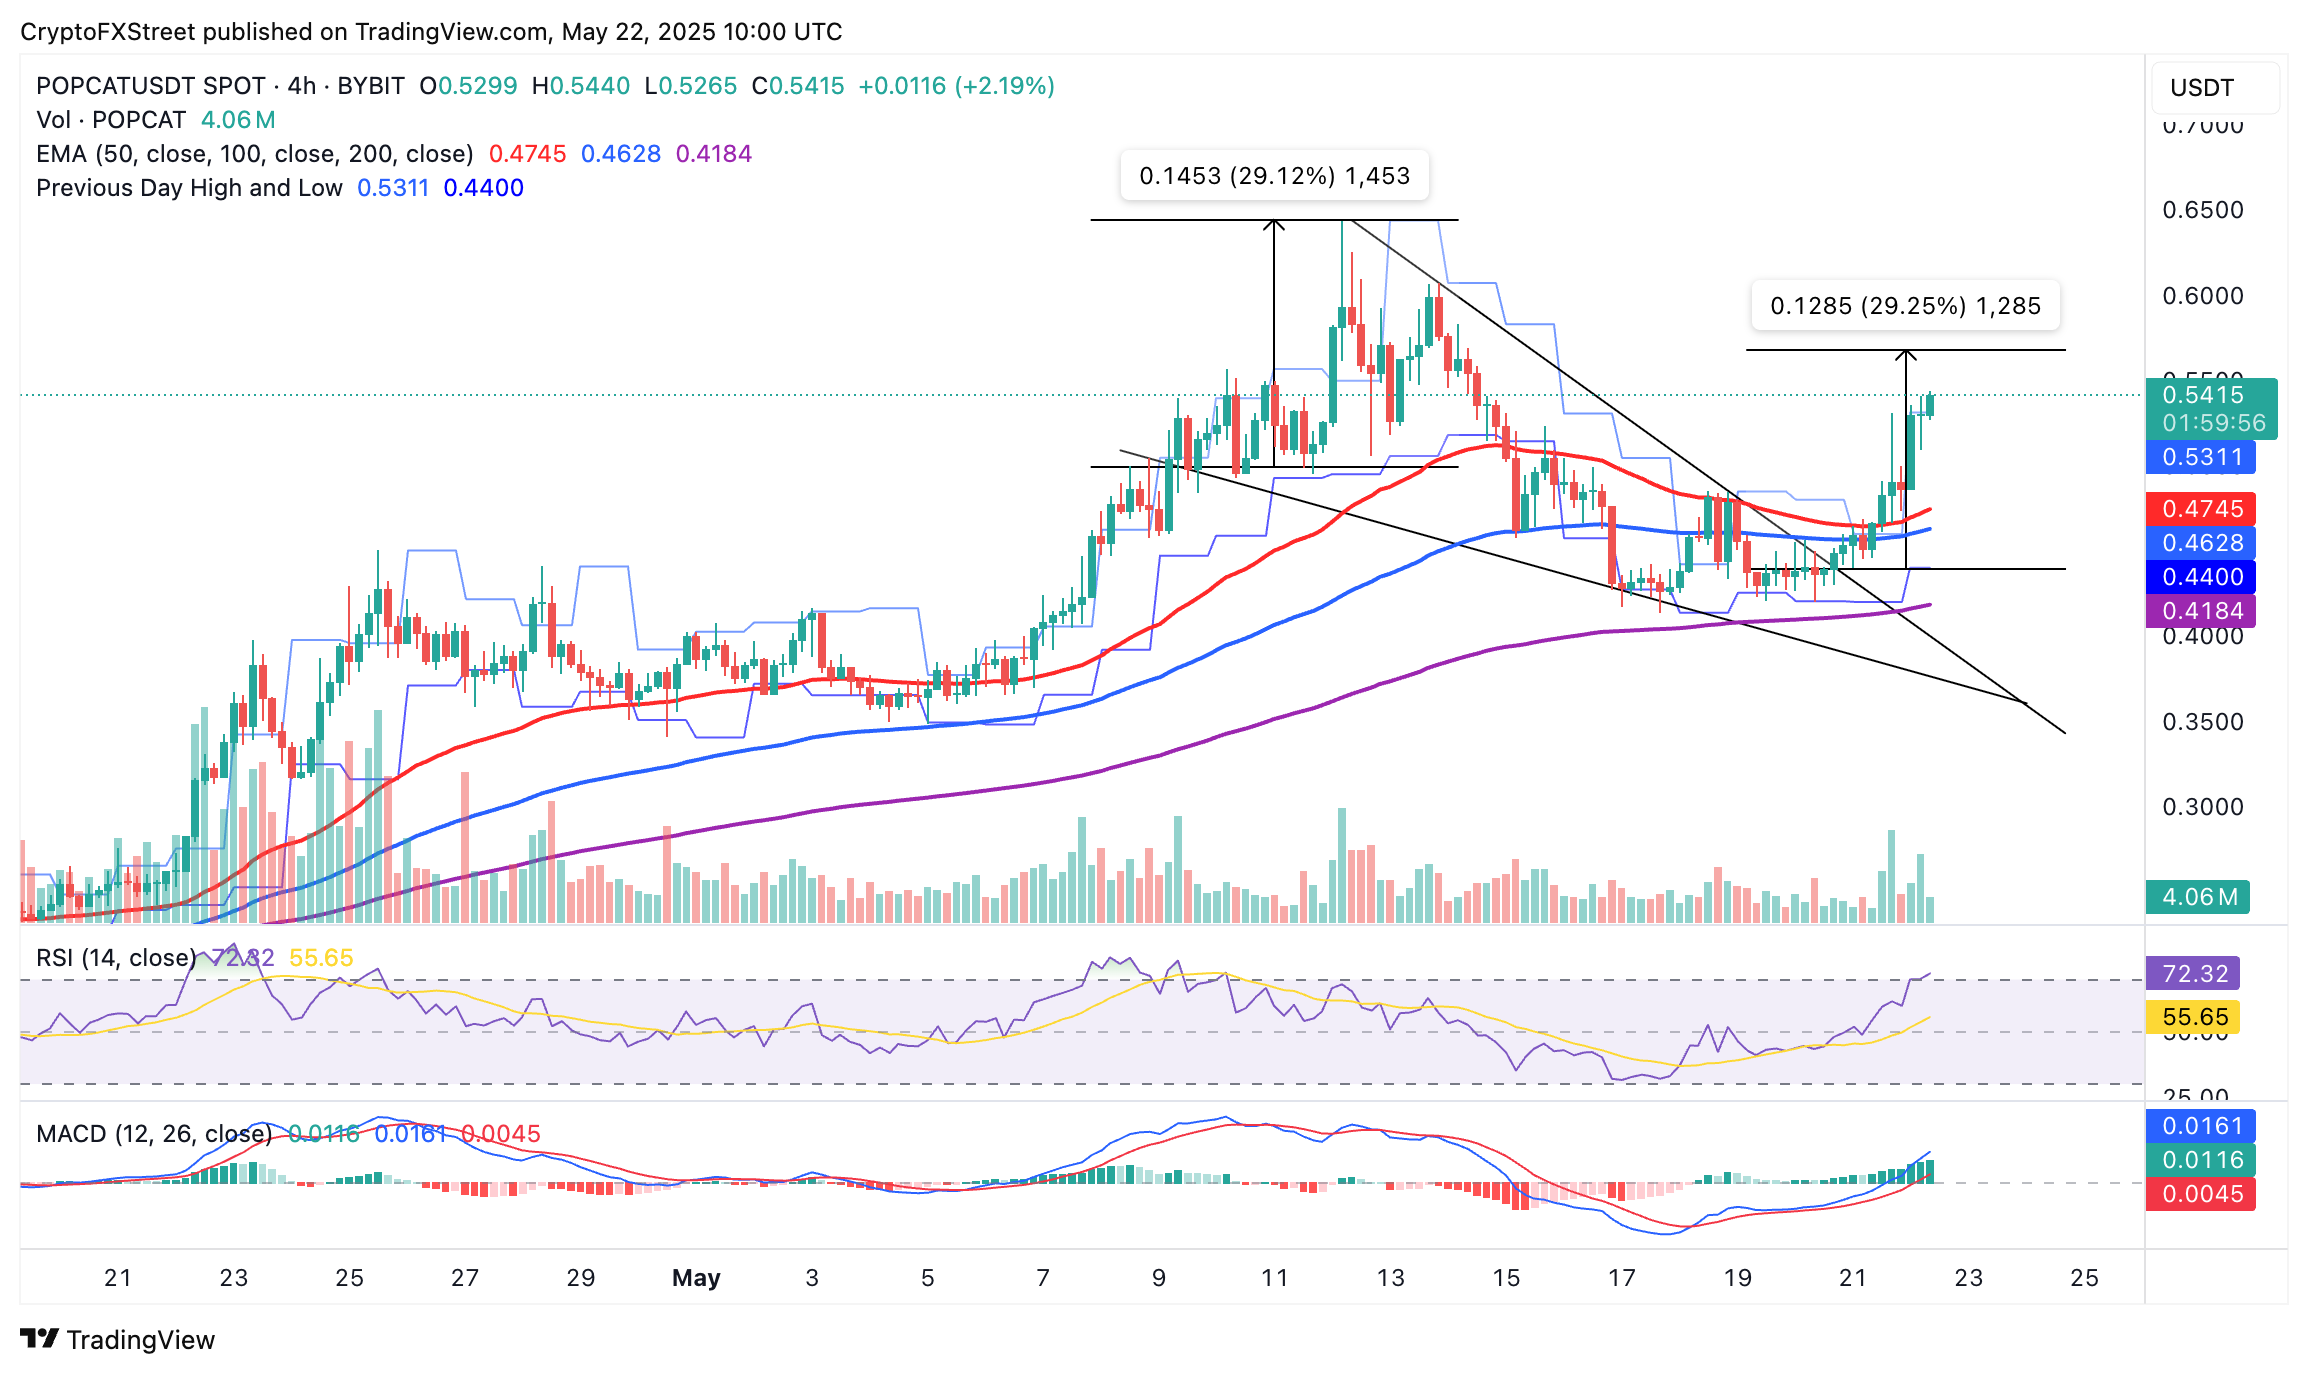
POPCAT/USDT 4-hour chart
The RSI at 72 signals caution as overbought conditions linger, while the MACD indicator’s bullish crossover supports the momentum. Increasing trading volume affirms buying interest in POPCAT. Traders would watch for support at the 50 Exponential Moving Average (EMA) around $0.47 if a pullback occurs.
Cryptocurrency prices FAQs
Token launches influence demand and adoption among market participants. Listings on crypto exchanges deepen the liquidity for an asset and add new participants to an asset’s network. This is typically bullish for a digital asset.
A hack is an event in which an attacker captures a large volume of the asset from a DeFi bridge or hot wallet of an exchange or any other crypto platform via exploits, bugs or other methods. The exploiter then transfers these tokens out of the exchange platforms to ultimately sell or swap the assets for other cryptocurrencies or stablecoins. Such events often involve an en masse panic triggering a sell-off in the affected assets.
Macroeconomic events like the US Federal Reserve’s decision on interest rates influence crypto assets mainly through the direct impact they have on the US Dollar. An increase in interest rate typically negatively influences Bitcoin and altcoin prices, and vice versa. If the US Dollar index declines, risk assets and associated leverage for trading gets cheaper, in turn driving crypto prices higher.
Halvings are typically considered bullish events as they slash the block reward in half for miners, constricting the supply of the asset. At consistent demand if the supply reduces, the asset’s price climbs.
Author

John Isige
FXStreet
John Isige is a seasoned cryptocurrency journalist and markets analyst committed to delivering high-quality, actionable insights tailored to traders, investors, and crypto enthusiasts. He enjoys deep dives into emerging Web3 tren




