Dogwifhat breaks out alongside other meme coins, targeting 75% move to $1.74
- Solana meme coin Dogwifhat resumes the uptrend after testing the $0.92 support.
- Meme coins, including Pepe, TRUMP and Bonk, sustain gains reflecting strong sentiment in the broader market.
- Open interest and trading volume collectively surge, signaling growing trader interest.
- WIF is poised for a major breakout to $1.74, confirmed by a bull flag pattern.

Dogwifhat’s (WIF) price is in the process of reversing the trend upward, trading at around $1.00 on Wednesday. The Solana-based meme coin tested support at $0.92, following a rejection from the supply-rich zone at approximately $1.31 on May 12. WIF’s derivatives market showcases surging Open Interest (OI) and trading volume, signaling growing investor enthusiasm that could sustain the elevated price.
The meme coin sector has been characterised by significant rallies, mirroring the strong sentiment in the broader cryptocurrency market, especially with Bitcoin (BTC) trading very close to its all-time highs.
Crypto’s top meme coin by market capitalization, Dogecoin (DOGE), upheld 3.5% gains accrued over the past 24 hours. Shiba Inu (SHIB) is also in the green, maintaining a 2.4% increase over the same period.
Tokens such as Pepe (PEPE) and Official Trump (TRUMP) recorded the largest upside compared to DOGE and SHIB at roughly 10% and 8%, respectively.
The meme coin sector collectively boasts approximately $75 billion in market share behind tokens in the Decentralised Finance Sector (DeFi) with $115 billion in total market capitalization.
Dogwifhat rally surges past key $1.00 mark
The Dogwifhat derivatives market highlights renewed interest in the meme coin, as Open Interest increases by over 10% in the past 24 hours to approximately $408 million, according to CoinGlass data.
OI represents the number of outstanding contracts that have not been settled, such as futures and options. Increase in OI alongside trading volume, as seen with WIF’s near 10% surge to $1.73 billion, hints at growth in trader interest, influx of fresh money and heightened participation.
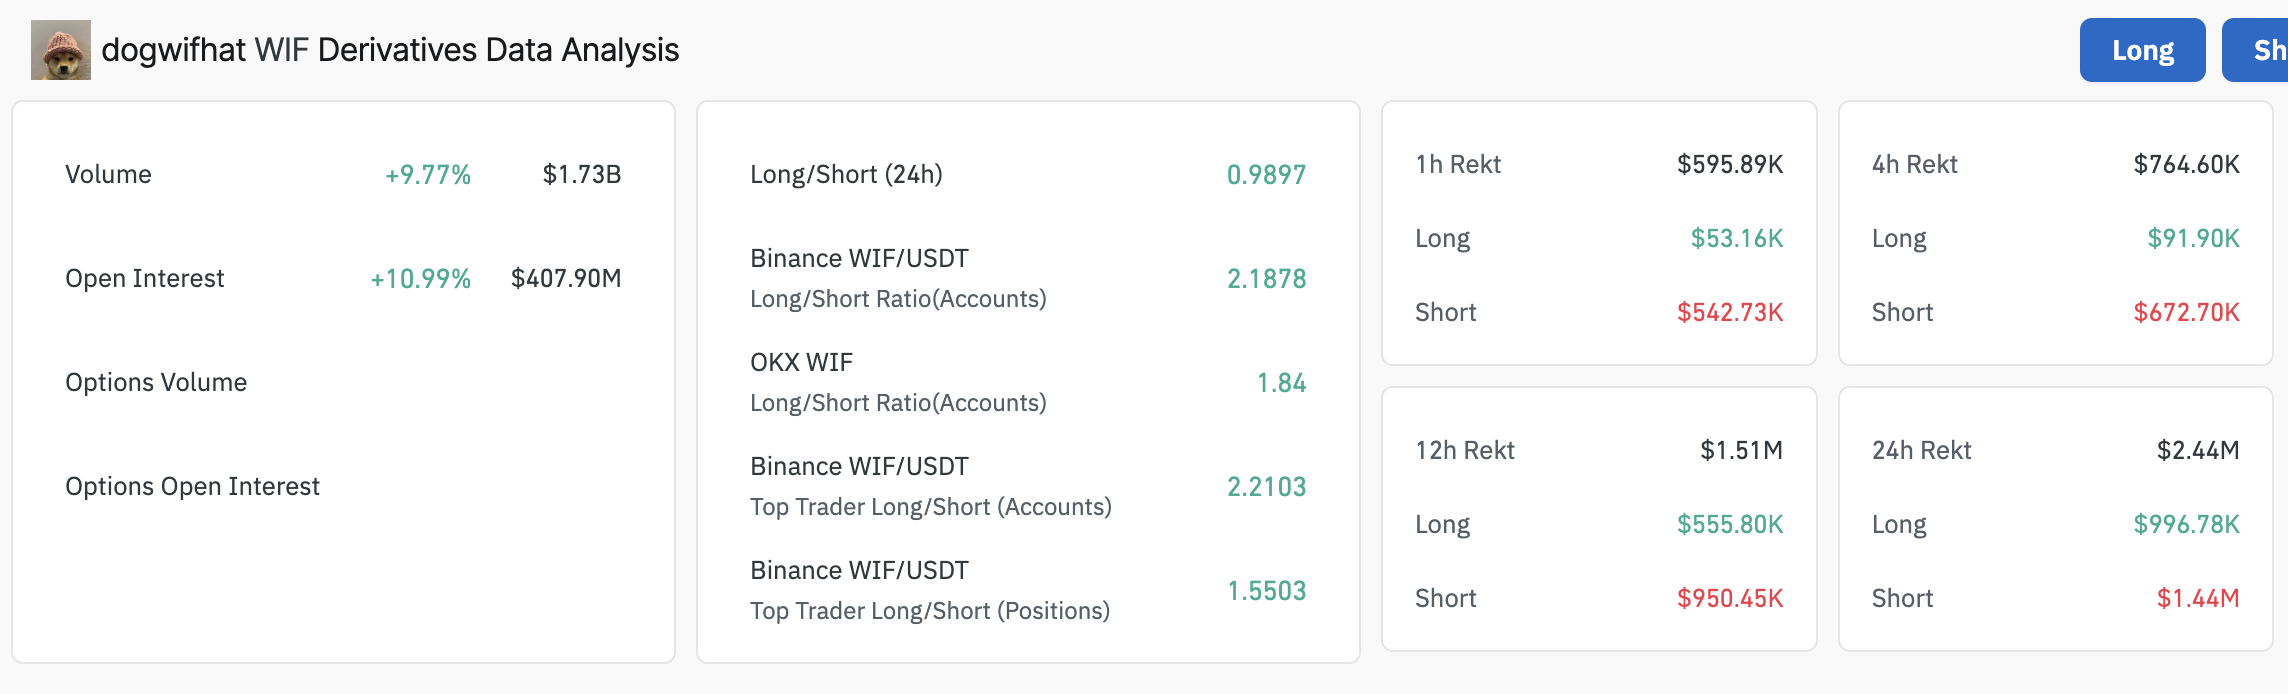
Dogwifhat derivatives data | Source: Coinglass
The surge in short position liquidations to $1.44 million compared to longs at approximately $996,000 over the past 24 hours signals intense market volatility, with bearish traders facing heavier losses as WIF’s price soars past $1.00.
This imbalance, combined with rising OI and trading volume, underscores growing bullish sentiment and potential for further upside.
Dogwifhat confirms bull flag pattern breakout
Dogwifhat’s price hovers slightly above $1.00 at the time of writing, buoyed by a recent break above the bull flag pattern illustrated on the four-hour chart below. The breakout comes after WIF tested support at $0.92, slightly below its current short-term support offered by the 50-day Exponential Moving Average (EMA) at around $0.98.
A bull flag is a bullish continuation pattern that typically forms after a sharp upward price movement, represented by the ‘flagpole’ followed by a consolidation period highlighted by the “flag.”
The 75% breakout target to $1.74 is calculated by measuring half the height of the flagpole and extrapolating that distance upward from the breakout point.
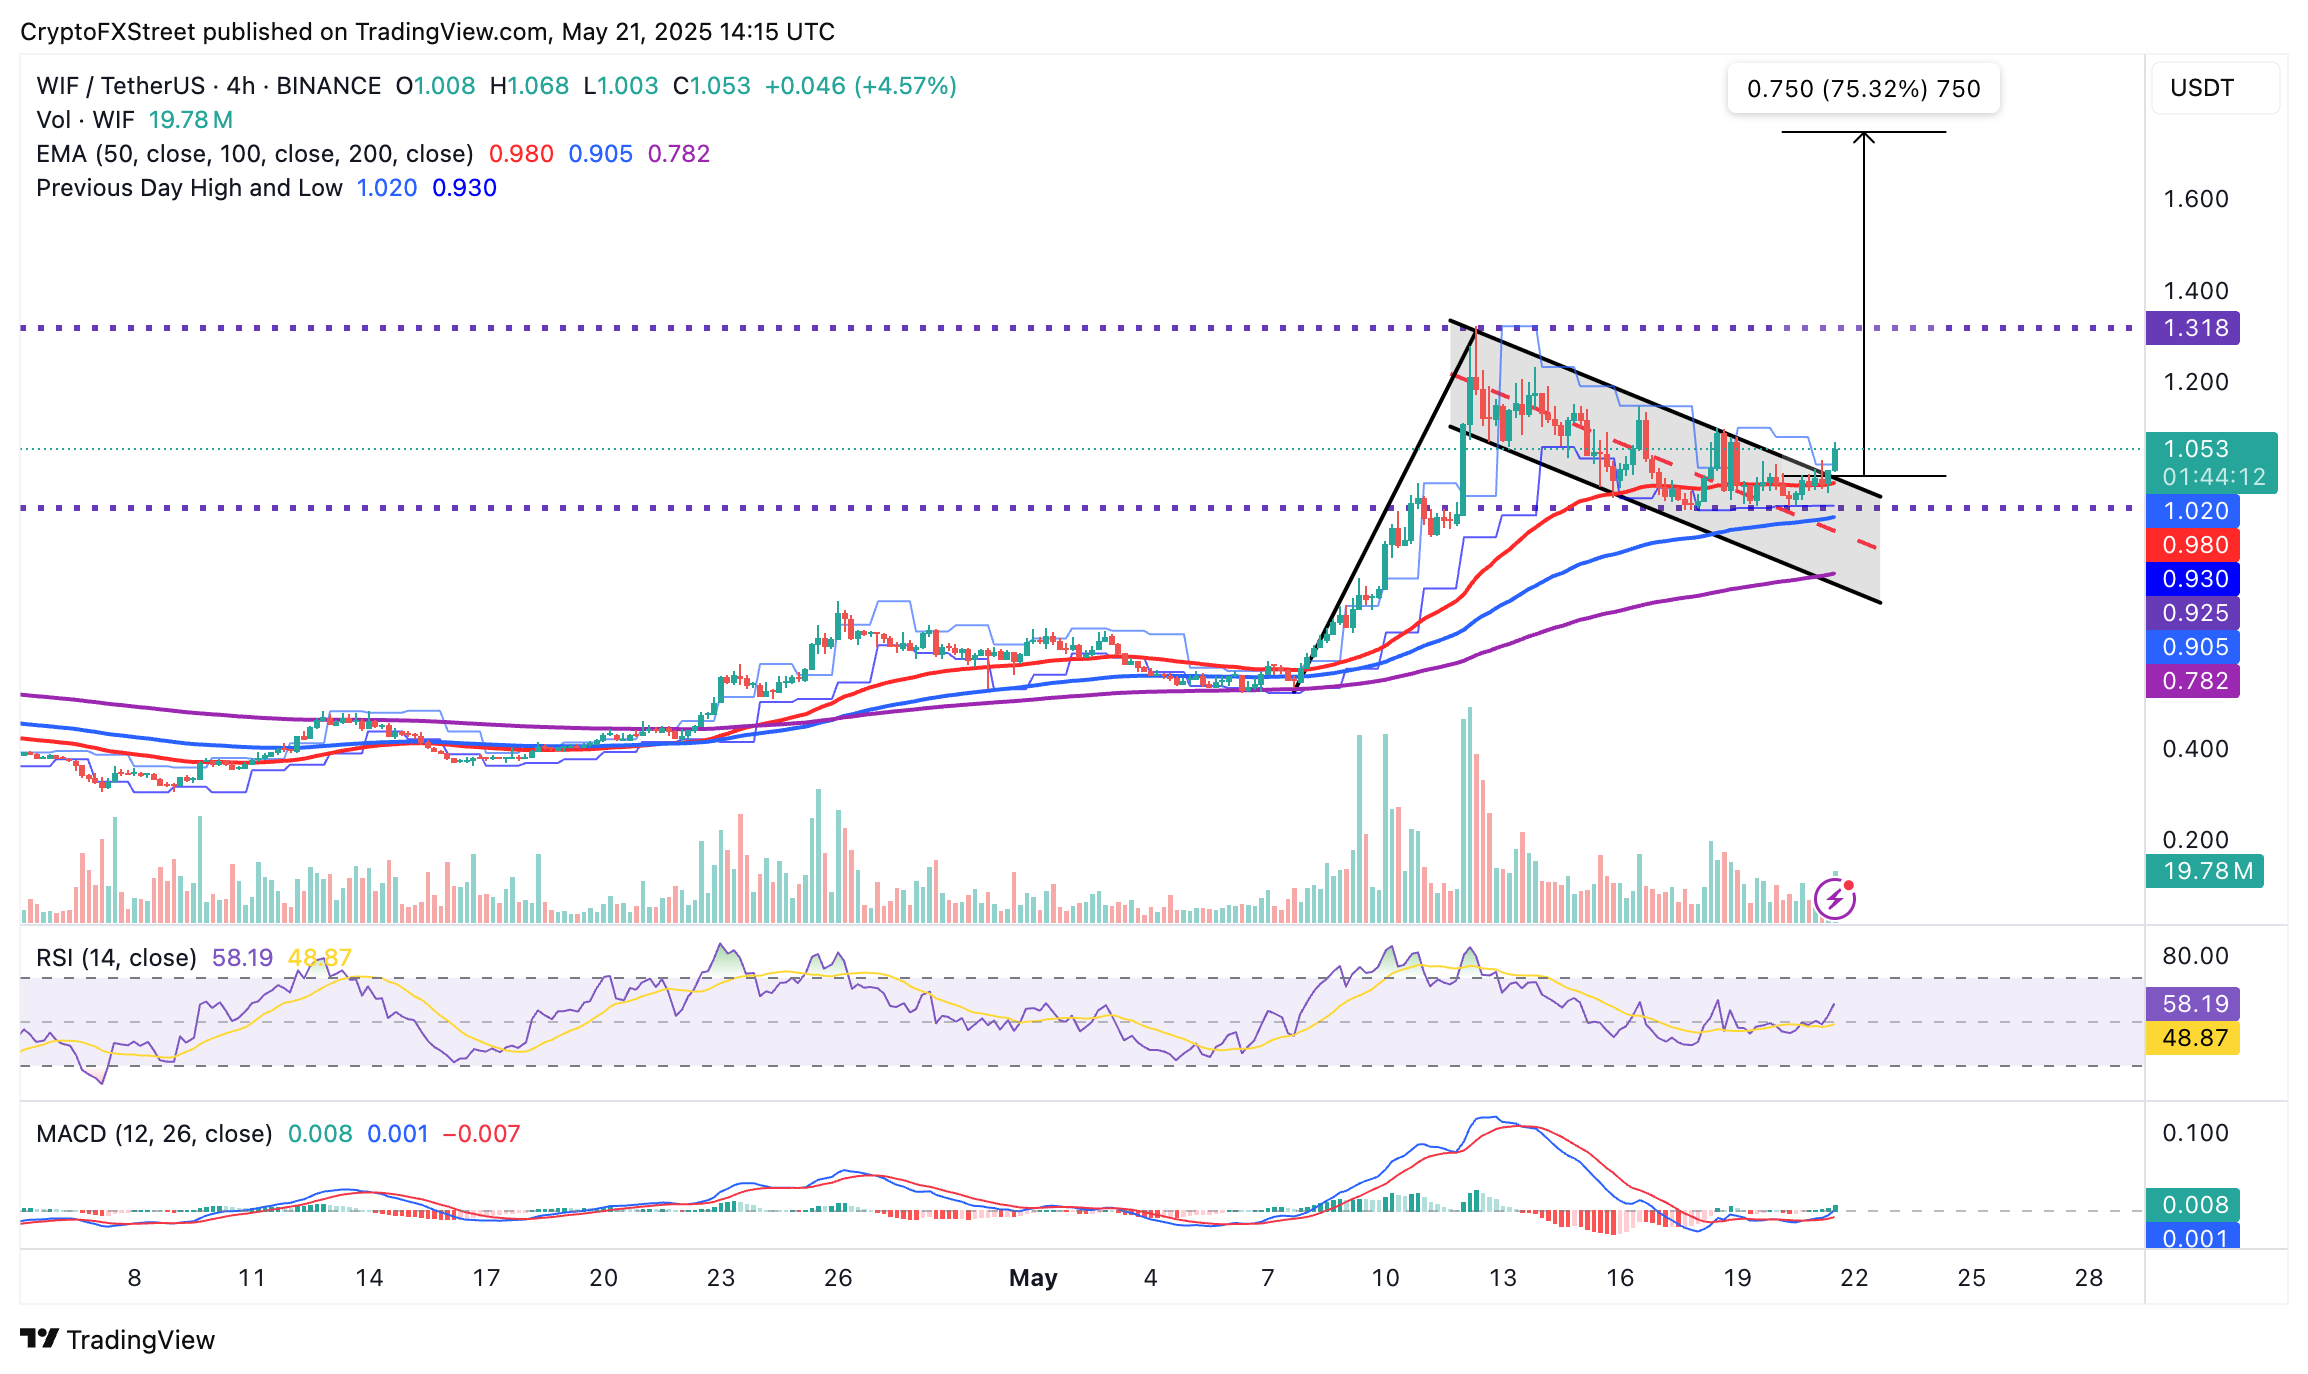
WIF/USDT 4-hour chart
Meanwhile, the Relative Strength Index (RSI) indicator at 58 hints at room for upside growth; however, if it approaches 70, traders must be cautious of overbought conditions, which are often a precursor to trend reversals.
The Moving Average Convergence Divergence (MACD) indicator’s bullish crossover supports the strong tailwind on Dogwifhat. The expanding green histogram bars above the centre line reinforce the bullish momentum.
Still, traders should monitor the RSI for potential overbought conditions and the MACD indicator for a plausible bearish crossover likely to signal a trend reversal or even consolidation due to the likelihood of profit taking and bullish exhaustion.
Cryptocurrency metrics FAQs
The developer or creator of each cryptocurrency decides on the total number of tokens that can be minted or issued. Only a certain number of these assets can be minted by mining, staking or other mechanisms. This is defined by the algorithm of the underlying blockchain technology. On the other hand, circulating supply can also be decreased via actions such as burning tokens, or mistakenly sending assets to addresses of other incompatible blockchains.
Market capitalization is the result of multiplying the circulating supply of a certain asset by the asset’s current market value.
Trading volume refers to the total number of tokens for a specific asset that has been transacted or exchanged between buyers and sellers within set trading hours, for example, 24 hours. It is used to gauge market sentiment, this metric combines all volumes on centralized exchanges and decentralized exchanges. Increasing trading volume often denotes the demand for a certain asset as more people are buying and selling the cryptocurrency.
Funding rates are a concept designed to encourage traders to take positions and ensure perpetual contract prices match spot markets. It defines a mechanism by exchanges to ensure that future prices and index prices periodic payments regularly converge. When the funding rate is positive, the price of the perpetual contract is higher than the mark price. This means traders who are bullish and have opened long positions pay traders who are in short positions. On the other hand, a negative funding rate means perpetual prices are below the mark price, and hence traders with short positions pay traders who have opened long positions.
Author

John Isige
FXStreet
John Isige is a seasoned cryptocurrency journalist and markets analyst committed to delivering high-quality, actionable insights tailored to traders, investors, and crypto enthusiasts. He enjoys deep dives into emerging Web3 tren


