Top 3 Bitcoin, Ethereum & Ripple price prediction: last chance for the bulls before crossing The Thin Red Line
- Technical indicators are pointing to a bullish movement in Bitcoin and Ethereum
- Ripple and Ethereum have drilled yesterday's lows, now on a limit situation

It is not easy to propose a bullish technical setup with the big falls that the main Cryptocurrencies are experiencing, but it's in these times where the risk is worth taking if we stuck to technical analysis.
The charts, particularly the Bitcoin one, are on extreme situations and any dip will take us to a bearish technical scenario, and likely a very volatile one. But it's in this kind of situations that market forces like to act, as it's where the stops tend to be more close.
BTC/USD 4H chart
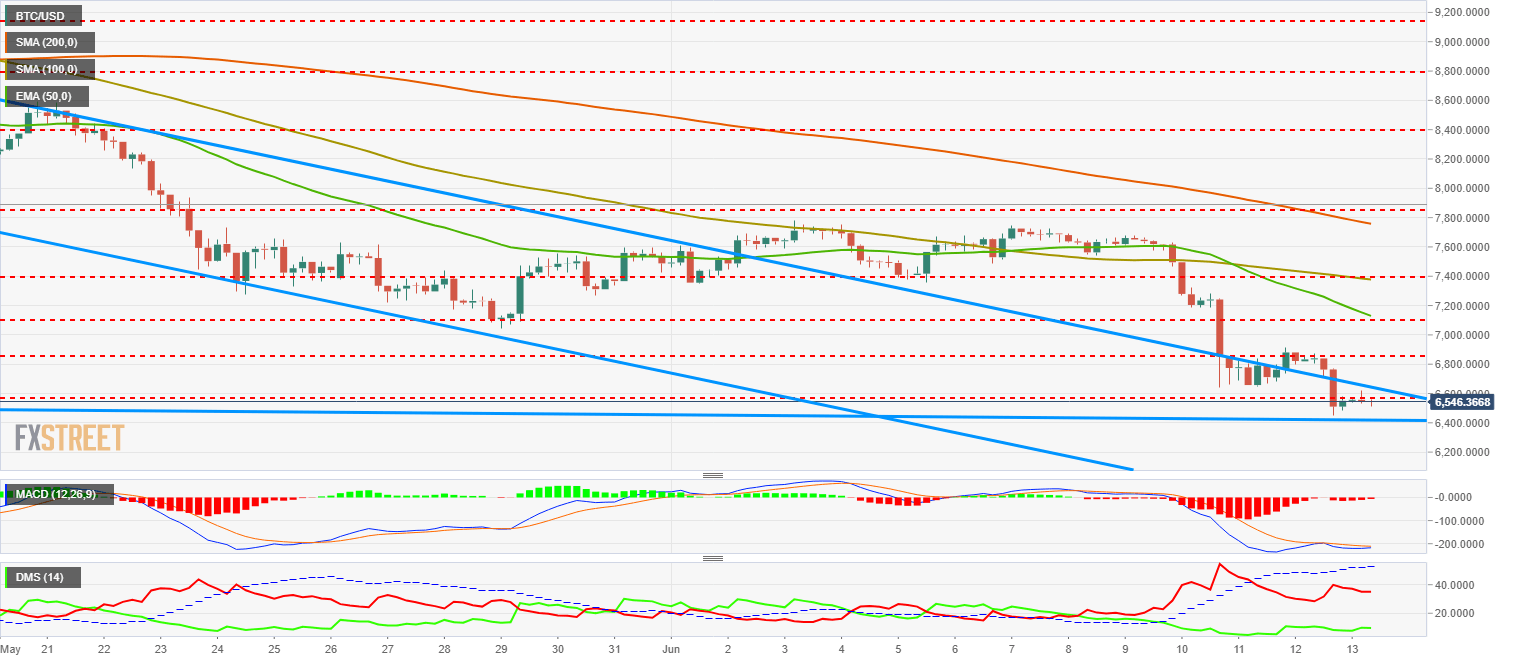
Bitcoin buyers are at extremely low levels, only seen three times since 2015, which involved each and every time bullish swings. The MACD structure, as we will see, is setting up a pattern very favorable for the bulls.
With this outlook, we saw yesterday another bear-dominated trading day, that took BTC/USD back to the support level at $6565 after projecting the movement back to the major long-term trendline that meets $6430.
It's in this last level where BTC/USD finds its first support, the last one before the void that would take the price straight back to $5864, February lows and the triggering level that would definitely take Bitcoin back to a long bearish period that could last for months.
If, on the other hand, Bitcoin bulls are able to initiate a run, the immediate resistance is located at the trendline of the bearish channel that is now located at $6644. Breaking that one would open a totally different scenario for the second half of the year. The following resistance is at $6855, a price congestion level, and the final short-term target is at $7090, where a price congestion resistance and the 50-EMA meet.
MACD in the Bitcoin 4-hour chart followed the script and moved to the downside yesterday. The pattern shows that the next step is a bullish movement. If that bullish pattern fails, it would be an extremely signal of weakness that should make us re-think our positioning on this asset.
Directional Movement Index in the same chart shows the sellers diminishing their activity while the buyers are at multiple-month levels, with an increase in its activity in the last hours.
ETH/USD 4H chart
-636644823388046241.png)
Ethereum is finding itself in a very similar situation than Bitcoin. Technical levels at the lows of the current setup, buyers at the bottom and potential bullish swing signals.
After yesterday's bearish movement, ETH/USD reached the $480-$460 level, where a price congestion support and a mid-term trendline that both place the final barrier before opening up a scenario that would likely target the lows from early April, in the $360 area. A terminal movement at the $425-$450 range is not out of the cards.
If the bullish pattern is completed, the first resistance at $510 where a major trendline coming from the end of April. If that resistance area is broken, the next target is at the $520 price congestion level, and above there, at $555, where the roof of the channel and the 50-EMA meet.
MACD in the Ethereum 4-hour chart shows a similar setup than the Bitcoin one. MACD failure pattern developing, with the statistical most likely outcome being a bullish swing. If that doesn't hold, it would be a signal of extreme weakness and strong falls would be very likely.
Directional Movement Index in the same chart shows the sellers retreating but heading to confirm the bearish cross of the ADX. Buyers are at very low levels but with an increasing profile. ADX is signalling a very strong trend, so the surge of strong volatility is not out of the cards.
XRP/USD 4H chart
-636644823878834165.png)
Ripple is also finding itself on a statistically favors rises. Bears have taken Ripple back to the $0.5432 level, new relative lows since April and a level that needs hold to avoid getting back to a scenario that would take XRP/USD straight back to $0.50. Further down, following targets are at $0.45, April lows and last barrier before getting onto a fully bearish period.
If the technical pattern continues and bulls are able to deliver, the first weak resistance is at $0.56, which if broken would leave $0.585 as the next target. The final target for this potential bullish scenario would be $0.60, the third resistance where the moving averages will likely converge in the short-term.
MACD in the Ripple 4-hour chart is following the drawn pattern, which would give way to a bullish outlook if its develops further. If that fails, it would a signal of extreme weakness and the falls could potentially be very big.
Directional Movement Index in the same chart shows sellers retreating but still at high levels, while buyers show a very flat profile. ADX is still at levels that mean very strong trend, and might carry an extra dose of volatility if they break critical levels on any of both sides.
Author

Tomas Salles
FXStreet
Tomàs Sallés was born in Barcelona in 1972, he is a certified technical analyst after having completing specialized courses in Spain and Switzerland. He expanded his technical training following the guidance of great experts on the financial markets.


