- The CFTC rejects to define Bitcoin and Ethereum as "equities", as they don't have any company behind them. What's the matter with Ripple then?
- Cryptocurrencies taking back critical levels and opening some scenarios that will need confirmation in the short-term
Crypto bulls reacted quickly to the CFTC announcing that Bitcoin and Ethereum will not be classified as "equities". The US regulator explained the decision as BTC and ETH don't have any company behind that has been funded with the ICO. The underlying reasoning here is that the CFTC didn't say anything about Ripple, that has indeed a business behind that gathered funds distributing its Tokens in a public offer.
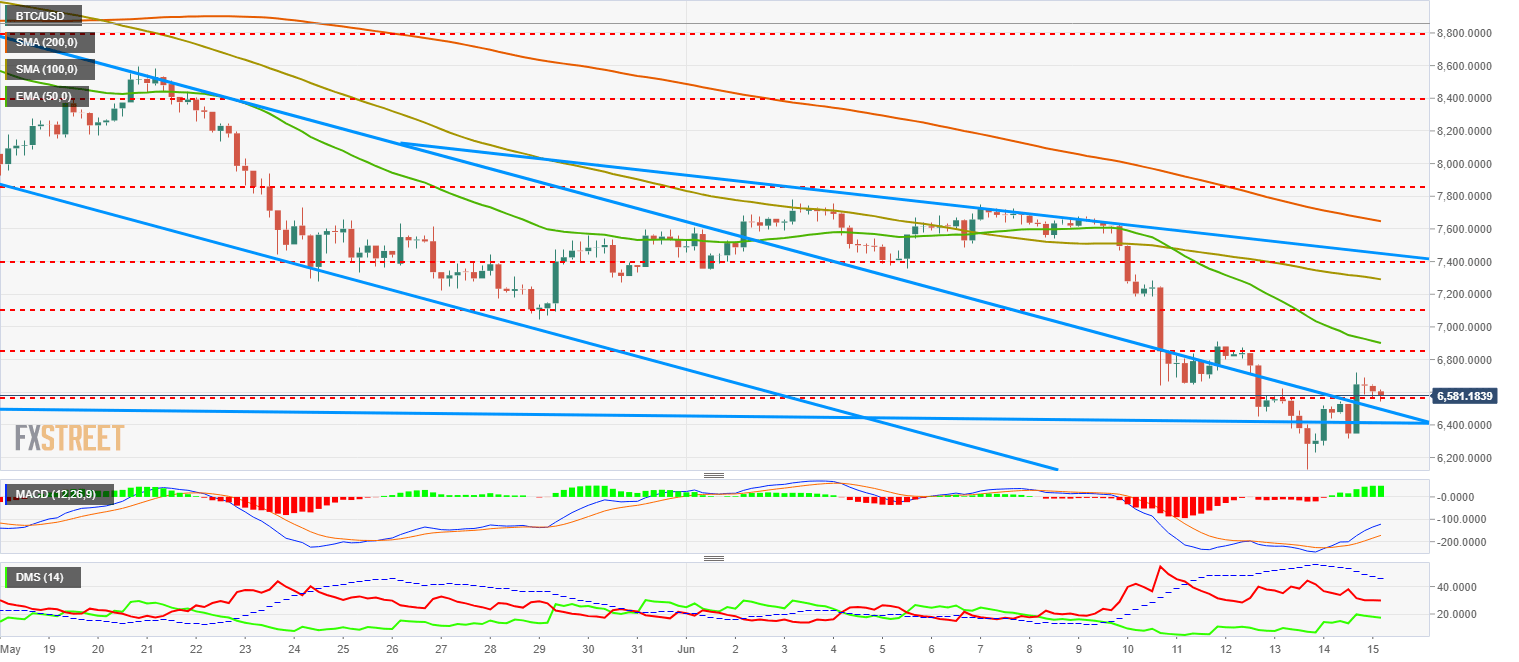
BTC/USD 4H chart
Bitcoin rallied after the CFTC announcement, with a one-way linear rise from $6344 up to $6721, breaking above the bearish channel ceiling and setting up a new scenario.
BTC/USD has taken $6580 back, but more importantly, has been able to get to an area with much weaker bearish pressures, which might favor a potential bullish leg. All things considered, though, bears are still in command.
On the upside, the first resistance is at the price congestion level of $6830, followed by the 50-EMA located a bit above at $6900. The bullish swing target is around $7400, but before it reaches that level, Bitcoin will need to beat the 100-SMA at $7300 and a confluence between the 200-SMA and a trendline at $7400.
Below the current price, the first support levels is at $6560, with a second support located at the trendline that shapes the recently broken bearish channel, located right now at $6500. If Bitcoin doesn't slide down that level, it still might get to the confluence with another price congestion support at $7400.
MACD in the Bitcoin 4-hour chart is accelerating with the recent rises and has gained both inclination and opening. It still has room to grow until the 0 line, so a bullish swing attempt is reasonable.
Directional Movement Index in the same chart is still showing the sellers in control, although at inferior levels and with much less edge over the buyers, who have been increasing their activity but still without setting up a trend. ADX is losing some strength, targeting a possible short period of consolidation.
ETH/USD 4H chart
Ethereum had a textbook reaction to the US regulator statement. It broke to the upside the intermediate trendline until it reached the first resistance at $520. From that level, it retraced a bit but confirmed the breakout.
If the bulls can get some run, they will find the $520 mark as the first barrier and immediately the 50-EMA, that is located just a bit above there. The ceiling of the main bearish channel is the swing target, probably at $530, the second resistance area. Higher above, the bulls might target levels at the 100-SMA and congestion price level confluence at $565.
On the downside, there is a critical level at the $500 mark, where the recently conquered trendline is located. If that was lost, the signal would be very bearish and would not find support until down in the $475 mark. Probably that scenario would take ETH/USD back to the recent lows at $450, with a more bearish target at $350.
MACD in the Ethereum 4-hour chart is also gaining inclination and height after the reaction of the last hours. It has some room to grow until the 0 line of the indicator, probably matching the $350 level.
Directional Movement Index in the same chart shows that both market forces are much more balanced. Sellers are still leading the price action but in clear retreat, coupled with a considerable increase in the activity of buyers. This might be an important factor, as if both forces meet, volatility will appear. ADX is descending, which diminishes the bearish potnetial and brings a consolidation scenario closer.
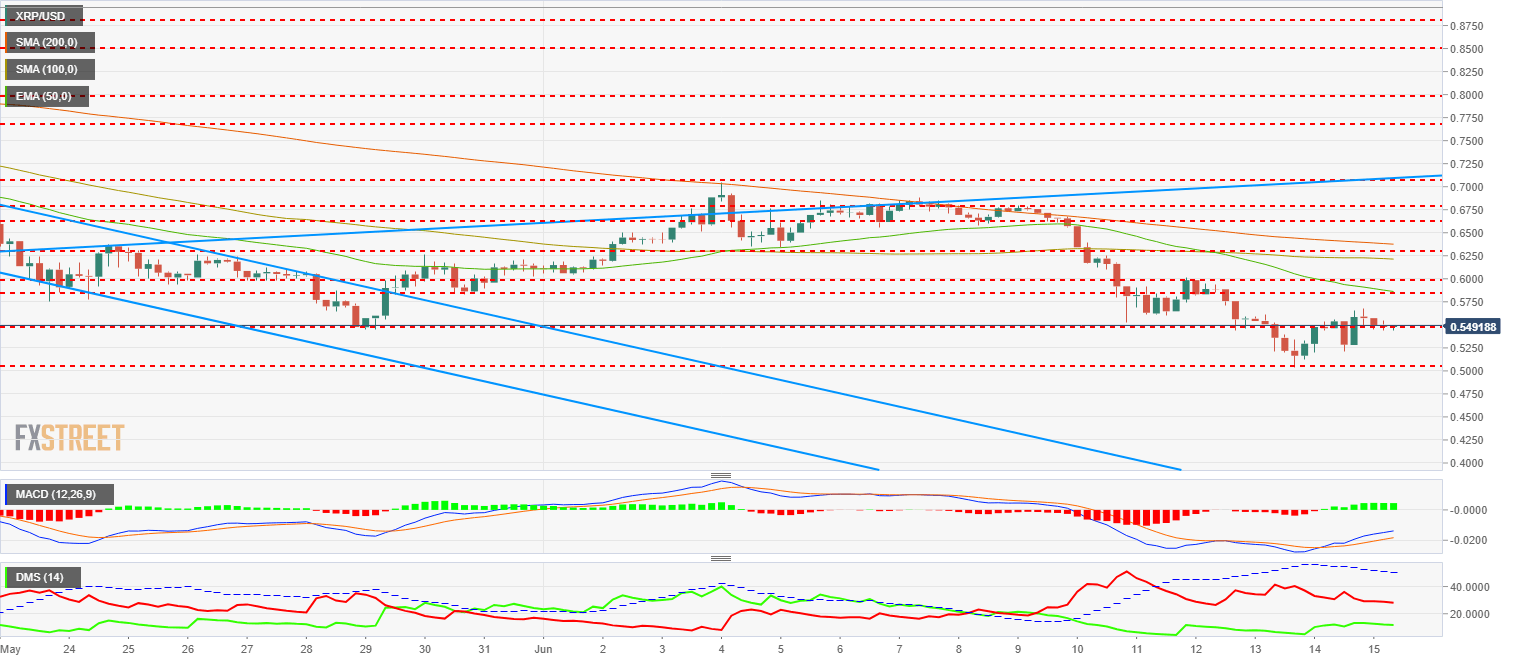
XRP/USD 4H chart
Ripple took the bullish momentum to take back the resistance located at $0.55. If the next sessions development favors the bulls, there is a small resistance at $0.56 as a previous step to the meaningful barrier located at $0.58, where the 50-EMA and a price congestion level meet. Further above, the $0.60 level also matches with a meaningful price congestion level. The final target of the swing is at $0.62, where it will find the 100-SMA.
On the downside, Ripple has a price support at $0.55, which if lost, would take XRP/USD back to $0.52 and $0.50, a critical support. If that level is lost, the area is cleared until the $0-35-$0.40 range, where the next consistent support would be found.
MACD in the Ripple 4-hour chart has reacted a bit more softly than in the other Cryptocurrencies analyzed. Less inclination, less openings and more chances of having a more consistent development up to 0 level of the indicator.
Directional Movement Index in the same chart shows sellers in control although diminishing in their strength, while buyers have not been able to look convinced and are struggling to increase their activity. ADX is descending but less than in the other Cryptos analyzed.
Information on these pages contains forward-looking statements that involve risks and uncertainties. Markets and instruments profiled on this page are for informational purposes only and should not in any way come across as a recommendation to buy or sell in these assets. You should do your own thorough research before making any investment decisions. FXStreet does not in any way guarantee that this information is free from mistakes, errors, or material misstatements. It also does not guarantee that this information is of a timely nature. Investing in Open Markets involves a great deal of risk, including the loss of all or a portion of your investment, as well as emotional distress. All risks, losses and costs associated with investing, including total loss of principal, are your responsibility. The views and opinions expressed in this article are those of the authors and do not necessarily reflect the official policy or position of FXStreet nor its advertisers. The author will not be held responsible for information that is found at the end of links posted on this page.
If not otherwise explicitly mentioned in the body of the article, at the time of writing, the author has no position in any stock mentioned in this article and no business relationship with any company mentioned. The author has not received compensation for writing this article, other than from FXStreet.
FXStreet and the author do not provide personalized recommendations. The author makes no representations as to the accuracy, completeness, or suitability of this information. FXStreet and the author will not be liable for any errors, omissions or any losses, injuries or damages arising from this information and its display or use. Errors and omissions excepted.
The author and FXStreet are not registered investment advisors and nothing in this article is intended to be investment advice.
Recommended Content
Editors’ Picks
Why crypto may see a recovery right before or shortly after Bitcoin halving

Cryptocurrency market is bleeding, with Bitcoin price leading altcoins south in a broader market crash. The elevated risk levels have bulls sitting on their hands, but analysts from Santiment say this bleed may only be cauterized right before or shortly after the halving.
Manta Network price braces for volatility as $44 million worth of MANTA is due to flood markets

Manta Network (MANTA) price was not spared from the broader market crash instigated by a weakness in the Bitcoin (BTC) market. While analysts call a bottoming out in the BTC price, the Web3 modular ecosystem token could suffer further impact.
Bitcoin price uptrend to continue post-halving, Bernstein report says as traders remain in disarray

Bitcoin is dropping amid elevated risk levels in the market. It comes as traders count hours to the much-anticipated halving event. Amid the market lull, experts say we may not see a rally until after the halving.
OMNI post nearly 50% loss after airdrop and exchange listing

Omni network (OMNI) lost nearly 50% of its value on Wednesday after investors dumped the token following its listing on top crypto exchanges. A potential reason for the crash may be due to the wider crypto market slump.
Bitcoin: BTC’s rangebound movement leaves traders confused

Bitcoin (BTC) price has been hovering around the $70,000 psychological level for a few weeks, resulting in a rangebound movement. This development could lead to a massive liquidation on either side before a directional move is established.

-636646567041939118.png)
