Top 3 Bitcoin, Ethereum, Ripple prediction prices: XRP loses dominance, threatening its current status
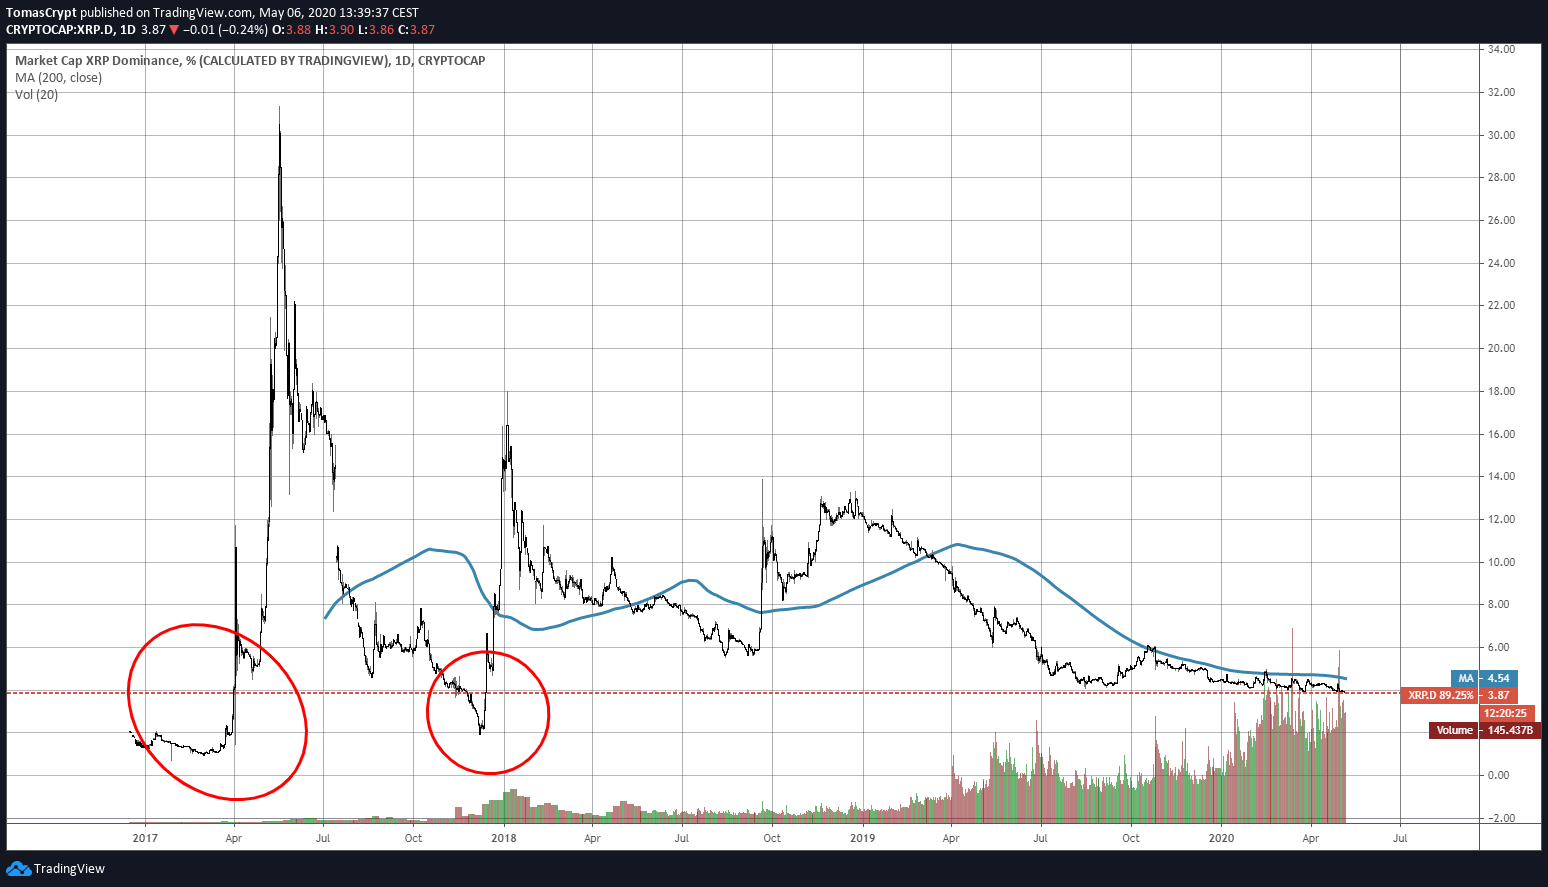
- Ripple continues to lose market share and is heading towards the 2017 lows, with just 2% of the total market.
- Bitcoin gains control of the entire market at the expense of the second-tier Altcoin segment.
- The technical structure shows exhaustion in the current upward trends, although there is room for an upward reaction.

The fight for market dominance continues between the two crypto market leaders. Bitcoin and Ether are still fighting for a market share that may end up penalizing both of them, as far as their valuation in fiat currency is concerned.
What's wrong with Ripple?
Ripple has never been in this race to the crypto top consistently, but already at the end of 2018, it gave up and left the dispute to the two big players in the market.
Ripple achieved an 18% market share by the end of 2017, after a flash reaction that pulled him out of the 2% dominance hole XRP was around that moment.
The XRP dominance stands at 3.91%, losing its yearly lows and with only two support levels below, the 2% dominance level at the end of 2017 and 0.65% at the end of 2016.
Ripple has always been a controversial project and the opposite of the Bitcoin and Ethereum models. The token of Ripple Ltd., XRP, was created as a tool for the trading platforms they have been implementing in the financial industry.
It is and will be a matter of discussion on whether Ripple Ltd, should classify XRP as security or keep it in this commodity profile because the parent company's use of the XRP is at least controversial.
This week, we have acknowledged that Jed McCaleb, Ripple's co-founder, sold $54 million of XRP (approximately $11.7 million) in April, a common practice among the top tier of the San Francisco-based company.
Ripple Ltd is currently facing a new lawsuit in which the plaintiff, Bitcoin Manipulation Abatement LLC, is suing Ripple's CEO, Brad Garlinghouse. The plaintiff argues that possession of XRP should give access to some form of rights over the parent company, a right to share in the company's profits that XRP does not currently provide.
In the future, lawmakers or the courts will decide how XRP should be classified.
Market Dominance
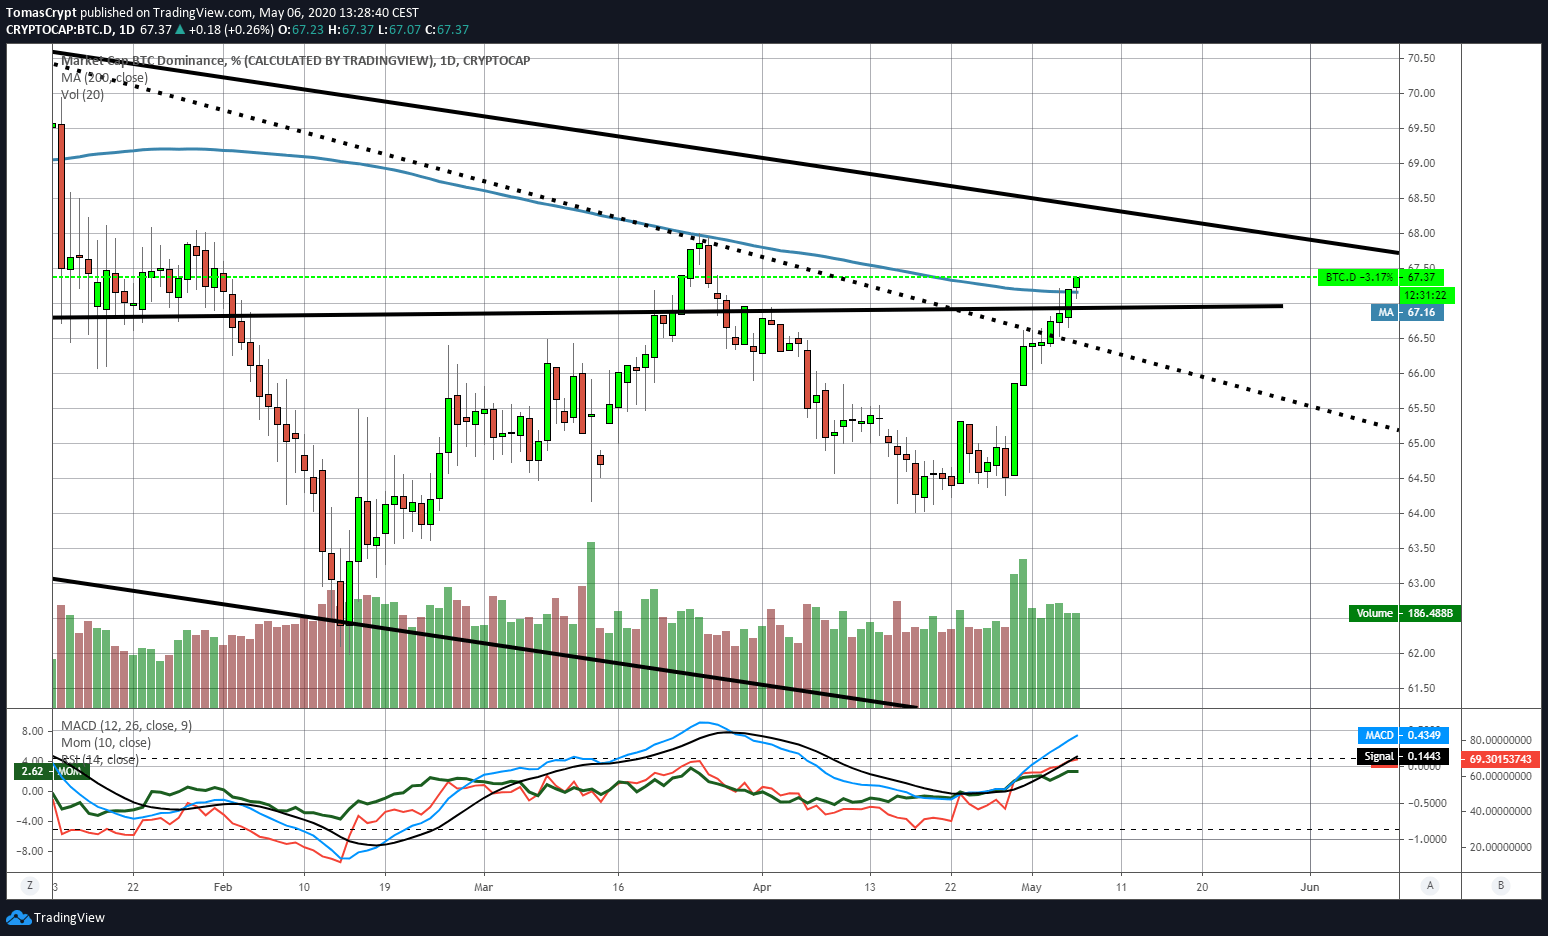
The Bitcoin dominance chart shows an upward break from the 200-day moving average. The bullish target is now in the long-term bearish channel ceiling at 68.3%. Technical indicators are beginning to show signs of weariness and suggest that the Bitcoin's upward movement from the rest of the market may be reaching its limit.
ETH/BTC Daily Chart
ETH/BTC is currently trading at the price level of 0.02268 and finds temporary support at a price congestion level. The technical timing is essential because a downward movement in the next few sessions would extend the bearish period in time.
Above the current price, the first level is 0.0235, then the second is 0.0245, and the third is 0.0255.
Below the current price, the first support level is at 0.0225, then the second at 0.022 and the third one at 0.0216.
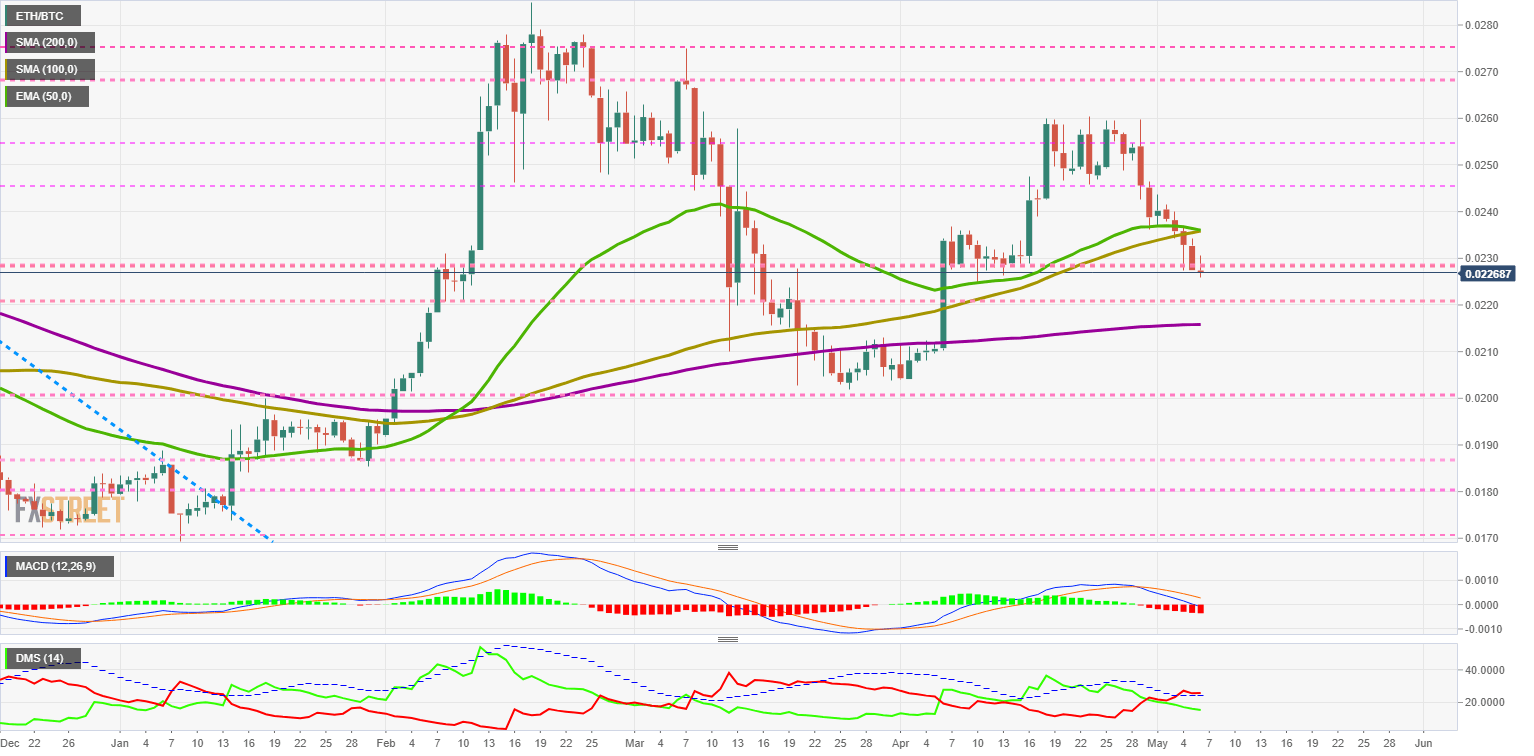
The DMI on the daily chart shows that the bears are finding support at the ADX line and may increase their level of control over the pair in the coming days.
BTC/USD Daily Chart
The BTC/USD pair is currently trading at the price level of $9025 and is stopping at the extension of the previous downward trend line. The technical structure of the BTC/USD pair indicates weakness in the coming sessions.
Above the current price, the first resistance level is at $9150, then the second at $9650 and the third one at $10600.
Below the current price, the first support level is at $8850, then the second at $8400 and the third one at $8175.
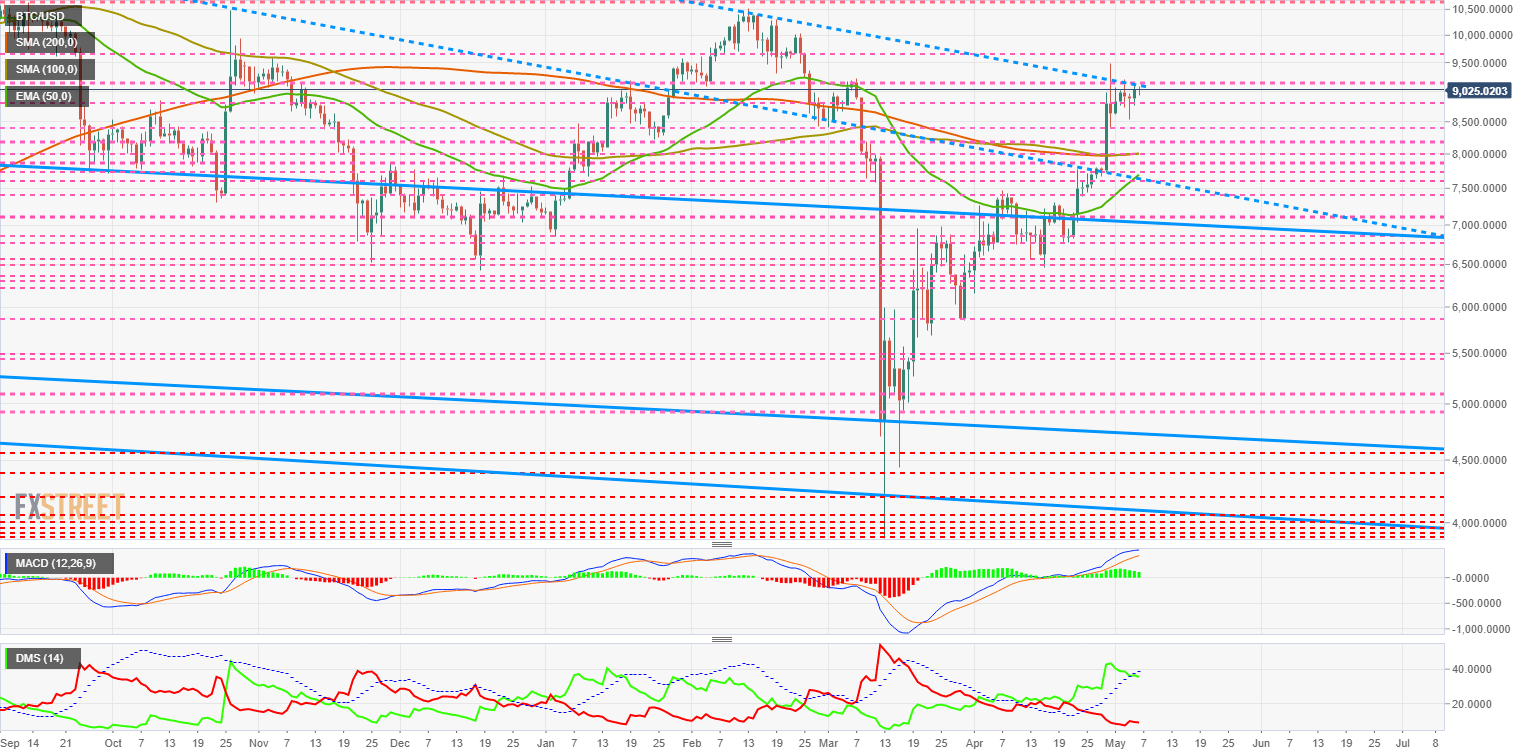
The MACD on the daily chart shows a loss of upward momentum, although the structure still has room for the price to move higher. A possible upward movement would probably be terminal or end-of-trend.
The DMI on the daily chart shows bulls losing support from the ADX line, which disables the bullish pattern and triggers a consolidation or reversal pattern.
ETH/USD Daily Chart
The ETH/USD pair is currently trading at $207 and find support at the price congestion level at $205.
Above the current price, the first resistance level is at $218, then the second at $225 and the third one at $230.
Below the current price, the first level of support is at $200, then the second at $195 and the third one at $190.
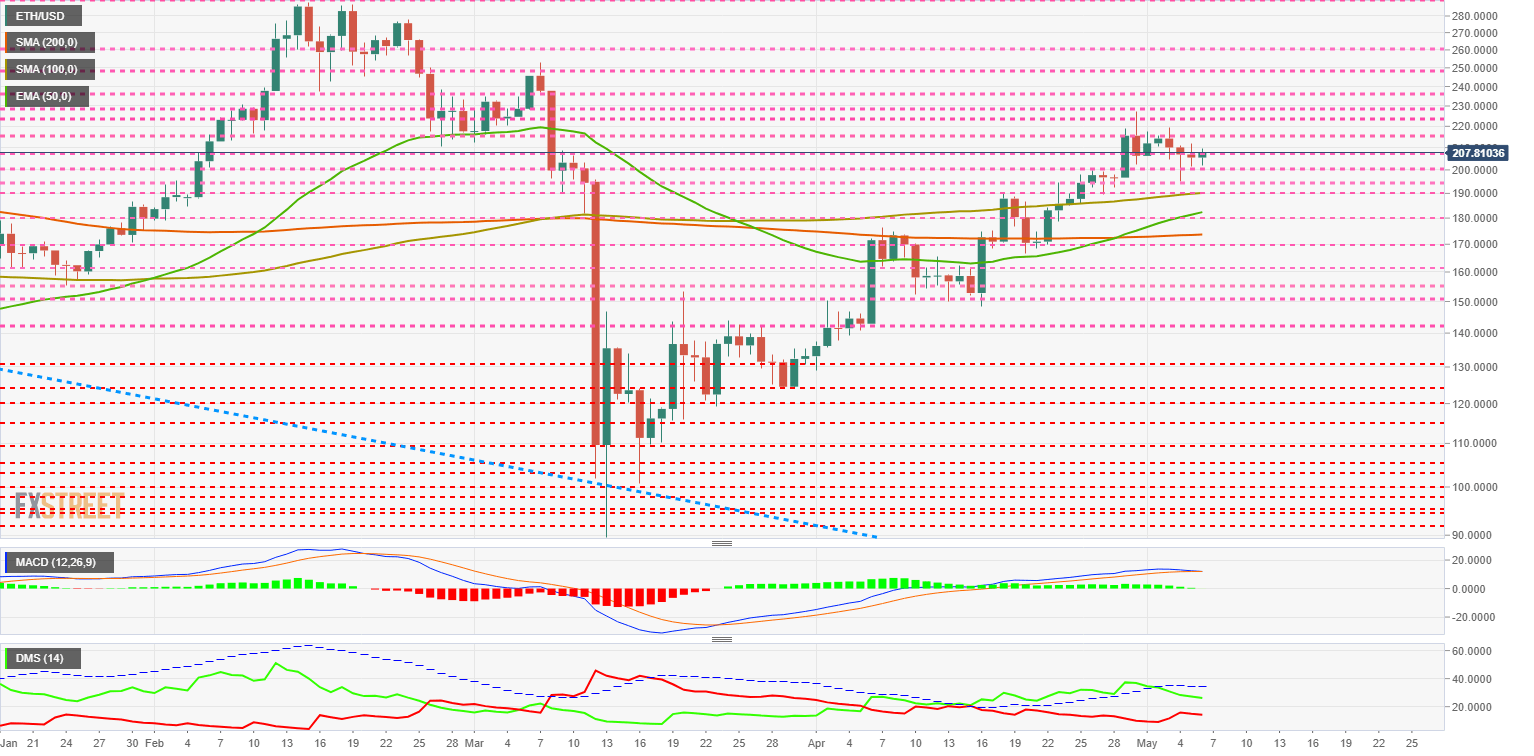
The MACD on the daily chart is in a bearish cross-phase, although a last-minute upward movement cannot be ruled out.
The DMI on the daily chart shows that the bulls are losing strength for another day, although the bears are also dropping in trend-line force and are giving up their lead in the ETH/USD pair.
XRP/USD Daily Chart
The XRP/USD pair is currently trading at the price level of $0.2219 after being supported by the 100-day simple moving average. The presence of the 200-day moving average a little higher, at exactly the $0.226 price level, makes it difficult for the pair to move forward and is a pressure point for the XRP/USD.
Above the current price, the first resistance level is at $0.0226, then the second at $0.238 and the third one at $0.255.
Below the current price, the first support level is at $0.218, then the second at $0.20 and the third one at $0.19.
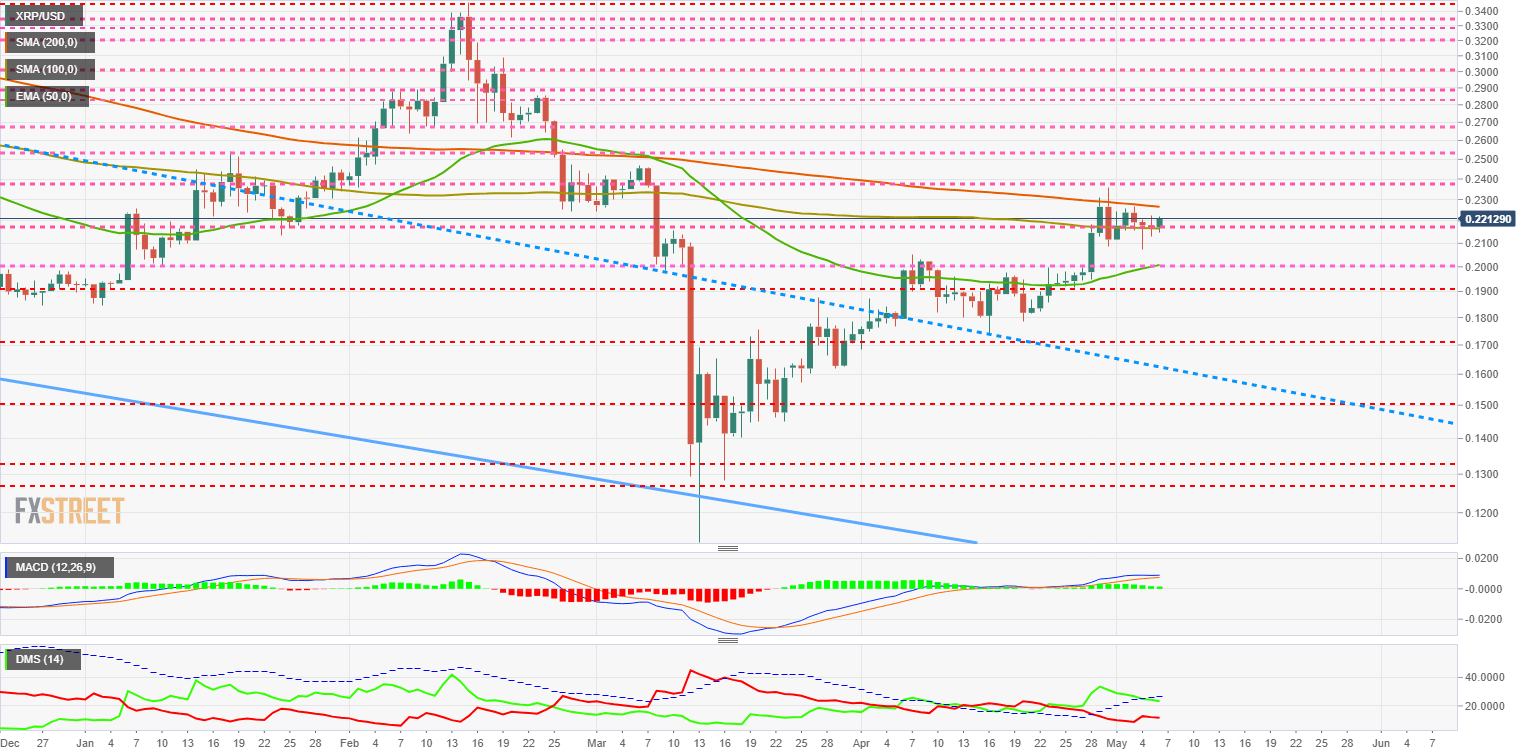
The DMI on the daily chart shows the bulls losing trending force, while the bears remain at the same levels as yesterday. The sell-side of the market does not appear to be very convinced of their chances of taking control of the pair.
Author

Tomas Salles
FXStreet
Tomàs Sallés was born in Barcelona in 1972, he is a certified technical analyst after having completing specialized courses in Spain and Switzerland. He expanded his technical training following the guidance of great experts on the financial markets.



