TOP 3 - Bitcoin, Ethereum & Litecoin price predictions: Fast short-term analysis
- BTC/USD has recovered the $9250 level but it is still far from big magnitude rises
- LTC/USD on a congestion between moving averages and meaningful price levels

The 4-hour charts left yesterday clear turning formations in the main Cryptocurrencies that might be reproduced in longer timeframes, giving the current levels some consistency. Long-term charts show weakness across the Crypto board. It's likely that this situation may extend some weeks in which volatility might gradually increase, indicating a trend change on the second half of the year.
LTC/USD 4-hour chart
-636615398142415046.png)
Litecoin joined the general Crypto trend and drew a nearly perfect turning formation that sets $156.16 as the primary support. Losing that level would allow important falls. Before reaching such level, another support can be found at $157.62. Further below, the 100-SMA is trading around $156.29.
On the upside, first resistance is at the 50-EMA, right at $160.14. Above there, next targets should be at $165 and further upwards at $175.80.
MACD in the Litecoin 4-hour chart is about to cross to the upside the signal line. The pattern tells us that this first attempt will be rejected awaiting a second try with much better chances of crossing up.
Directional Movement Index in the same chart is nearly showing a tie situation between buyers and sellers, both in levels of a certain importance. The odds of the first cross between both sides being clean are low, so that supports the scenario proposed by the MACD.
BTC/USD 4-hour chart
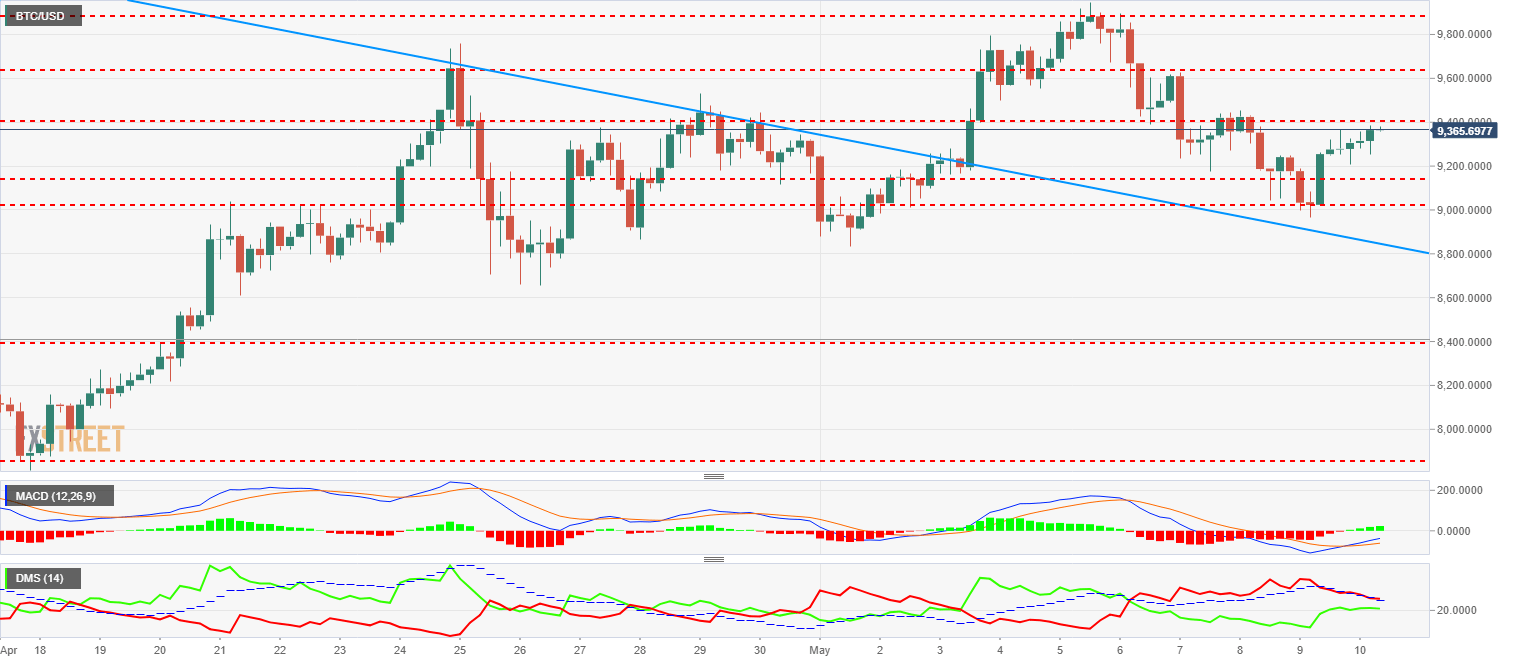
Bitcoin is trading around $9360 during European morning, heading up to the resistance located at $9400. If that level gets broken, next resistance is at $9645.55. Next target would be at last week's highs located at $9882.
Below there, first intermediate support is at $9236, very close to two levels much more important at $9141.10 and the critical support at $9022.
MACD in the Bitcoin 4-hour chart is crossed to the upside with a very uncommon, aggressive angle, which might be particular to the Cryptocurrencies analysis. MACD is trading below the 0 line, so despite being crossed to the upside, it keeps its bearish component.
Directional Movement Index in the same chart shows sellers not trusting the current levels, reducing their positions looking for better entry levels. Buyers increased heavily yesterday during the Asian session, profiting from low buying levels, and are now waiting for the price action to develop.
ETH/USD 4-hour chart
-636615397829568196.png)
Ethereum is replicating the same Bitcoin movement, although first resistance is further away in this case, right at $772.59. If that one is broken, intermediate resistance at $791.06 as a previous step to a bigger resistance area between $812 and $823. Above there, final target at the psychological $1000 mark.
Below the current price levels, the first support is at the 50-EMA, around $742.289, followed a bit lower by the 100-SMA at $710 and a trendline support level at $700.
MACD in the Ethereum 4-hour chart shows a similar profile to Bitcoin, although much closer to the 0 line. A potential cross to the upside looks likely. We see the very uncommon MACD turn to the upside that we have witnessed in Bitcoin. Studying this pattern might be very useful for the future.
Directional Movement Index in the same chart shows buyers and sellers tied, but in this case, ADX is falling below the level that indicates trend strength.
Author

Tomas Salles
FXStreet
Tomàs Sallés was born in Barcelona in 1972, he is a certified technical analyst after having completing specialized courses in Spain and Switzerland. He expanded his technical training following the guidance of great experts on the financial markets.


