This privacy coin plays a crucial role among futures traders, here's why
- Monero price has been trending higher without worrying about Bitcoin’s trend.
- Monero is a ‘privacy coin’ designed to protect the identity of users and their transactions.
- During its ascent, traders heavily used it to hedge their risky short positions.
- Since the narrative has flipped, XMR can now be used to hedge longs.

Monero (XMR) price has shown a steady ascent since November 9, 2022, without any major pullbacks or corrections. While this slow, under-the-radar rally was impressive, investors need to think two steps ahead to prepare for what comes next.
Monero price action as a hedge for traders
Monero price has inflated 44% over the last two months or so. While the magnitude of this ascent is not impressive, investors need to pay close attention to the pullbacks amid crypto market meltdowns.
XMR has trended higher more strongly since the November 9 crash lows compared to Bitcoin which has moved sideways. This can be seen in the chart below, which shows Monero price in blue and Bitcoin price in the pane below in orange. . Although there is a correlation between XMR and BTC, the magnitude of the declines for Monero is comparably smaller, making it a perfect coin to hedge against risky long or short positions.
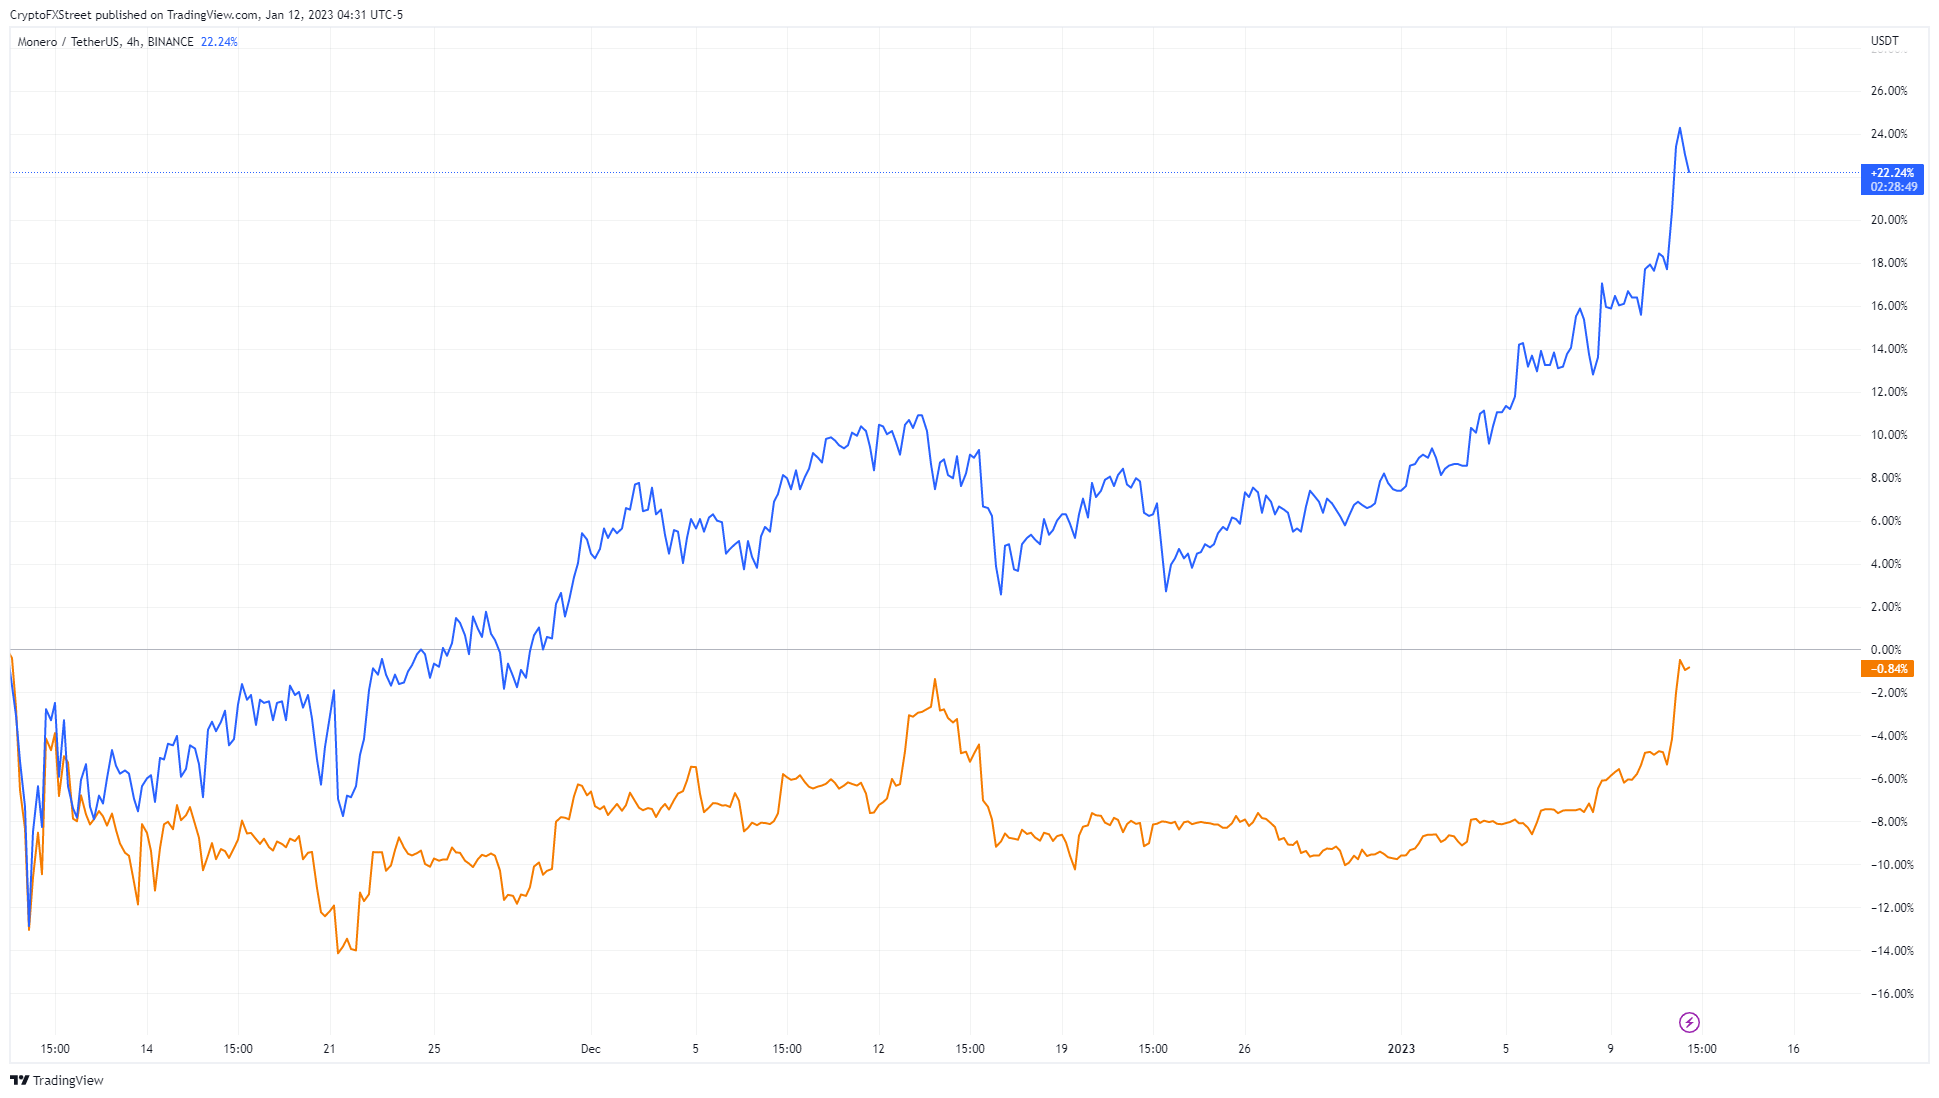
XMR/USDT vs. BTC/USDT 4-hour chart
Further proof can be seen in the attached chart below, which shows Open Interest (OI), and Cumulative Volume Delta (CVD), all of which show a clear trend. CVD is basically the difference between buy and sell order volumes. If it rises, it tends to be a precursor of similar rises in the price of the asset as well.
OI gives investors a picture of the number or quantity of open orders for a particular asset. If the OI rises while CVD rises, it is a sign of long positions being opened. However, if OI spikes with a spike in selling pressure, aka decline in CVD, it indicates that short positions are being opened.
Likewise, a drop in OI with a spike in selling pressure would indicate the short positions are being opened.
From November 9, 2022, investors can note that the futures CVD spiked from $77 million to $192 million. Albeit slow, the spot CVD also rose with it, which reveals that the XMR rally was mainly driven by the interest from futures traders.
Combining the CVD readings, which indicate a massive buying spree with the rise in OI, indicates that long positions were opened.
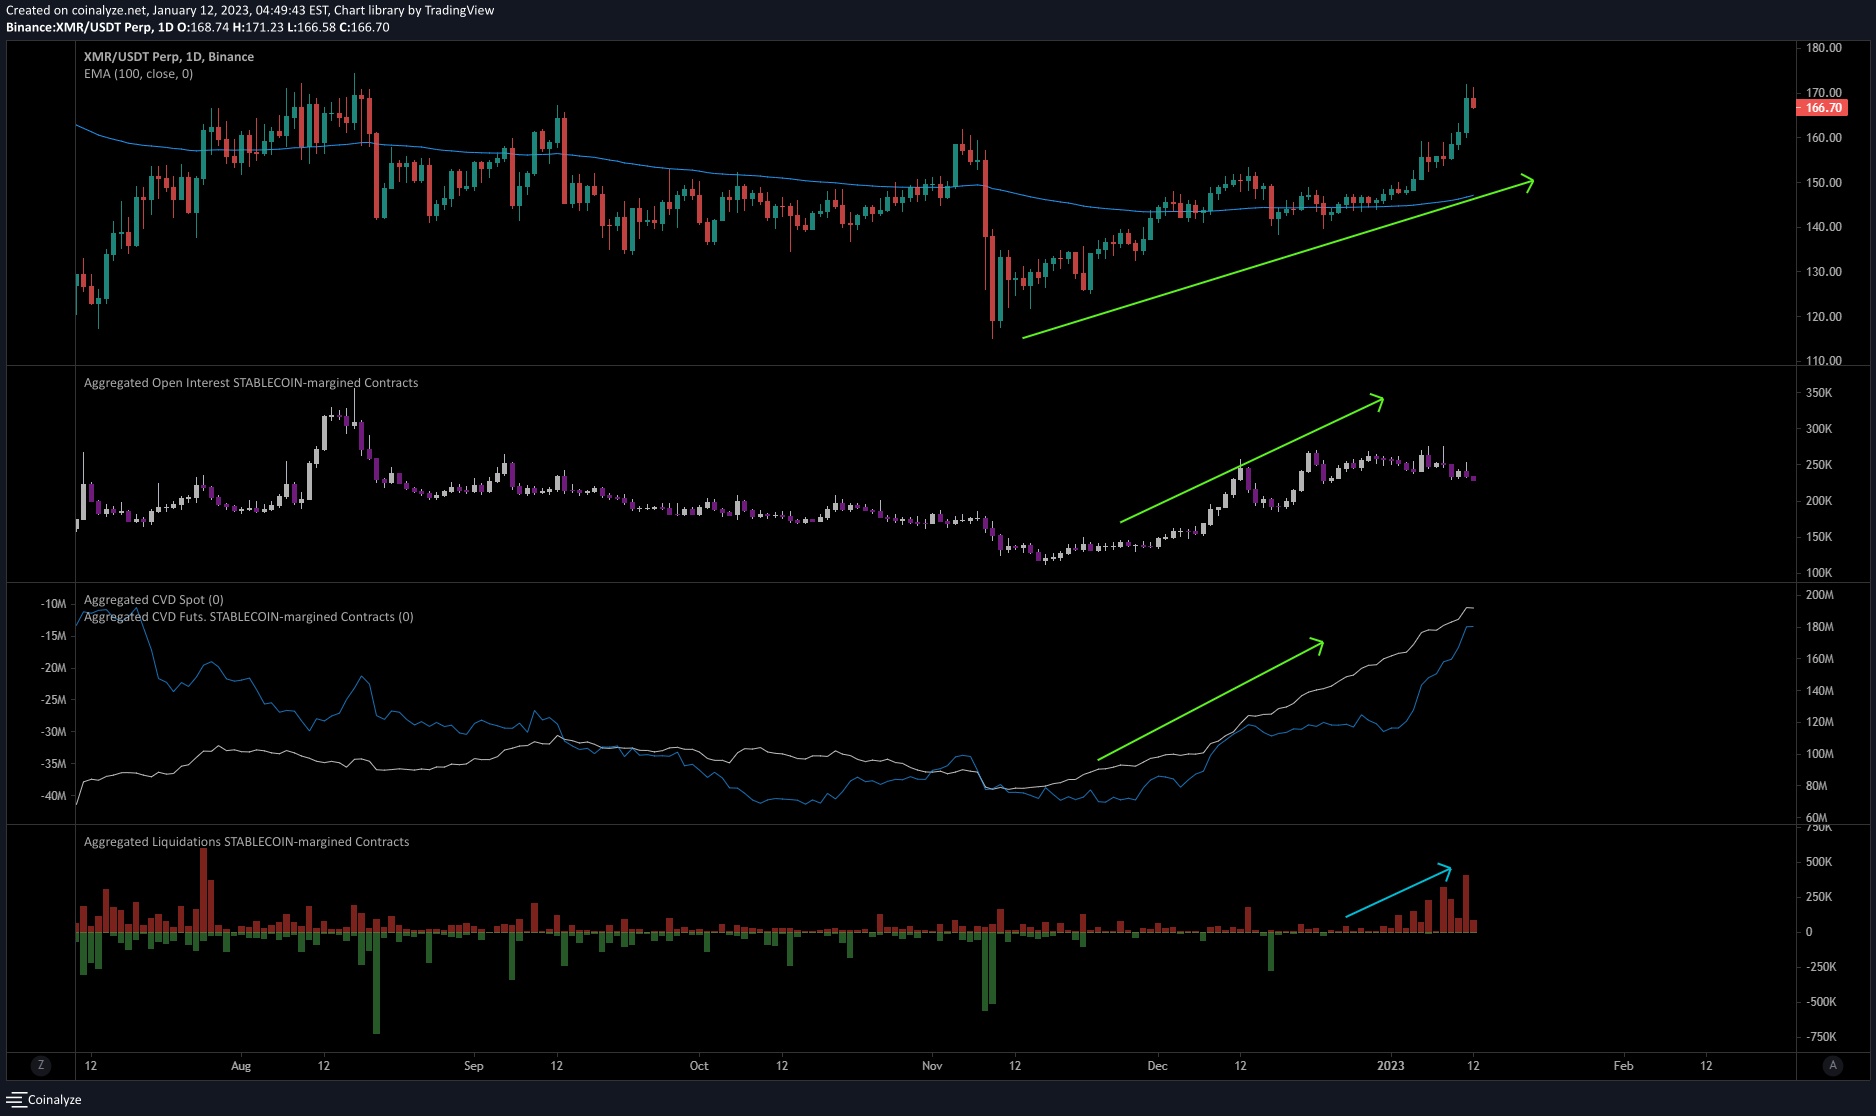
XMR/USDT 1-day chart
What’s next for XMR in futures traders’ plans?
While these metrics provide an accurate description of what has occurred so far, the indicator in the bottom panel of the chart, the Aggregated Liquidations metric, helps us to forecast what might come next for Monero.
The liquidations chart shows that during its run-up, there were a few short positions (red bars) getting liquidated. However, as the rally comes to a close, the number of short positions getting liquidated has grown from a measly $120,000 to $406,000 in a span of 11 days.
- Such a development happens due to two reasons:
- There was a massive, volatile move to the upside
Market makers or smart money investors are engineering liquidity by trapping early bears (with a minor run-up after an obvious local top formation) before triggering a market correction.
In this case, both points are valid. So the current manipulation combined with a declining OI paints a picture that the long positions are getting offloaded with a simultaneous punishing of early bears. Hence, this development could be a sign of a market reversal lower.
As Bitcoin price climbs higher and props the crypto market along with it, short XMR as a hedge against these long positions could be the best way to go. Investors can expect an 8% downswing to retest $152.89, which is the midpoint of the $96.38 to $209.41 range high.
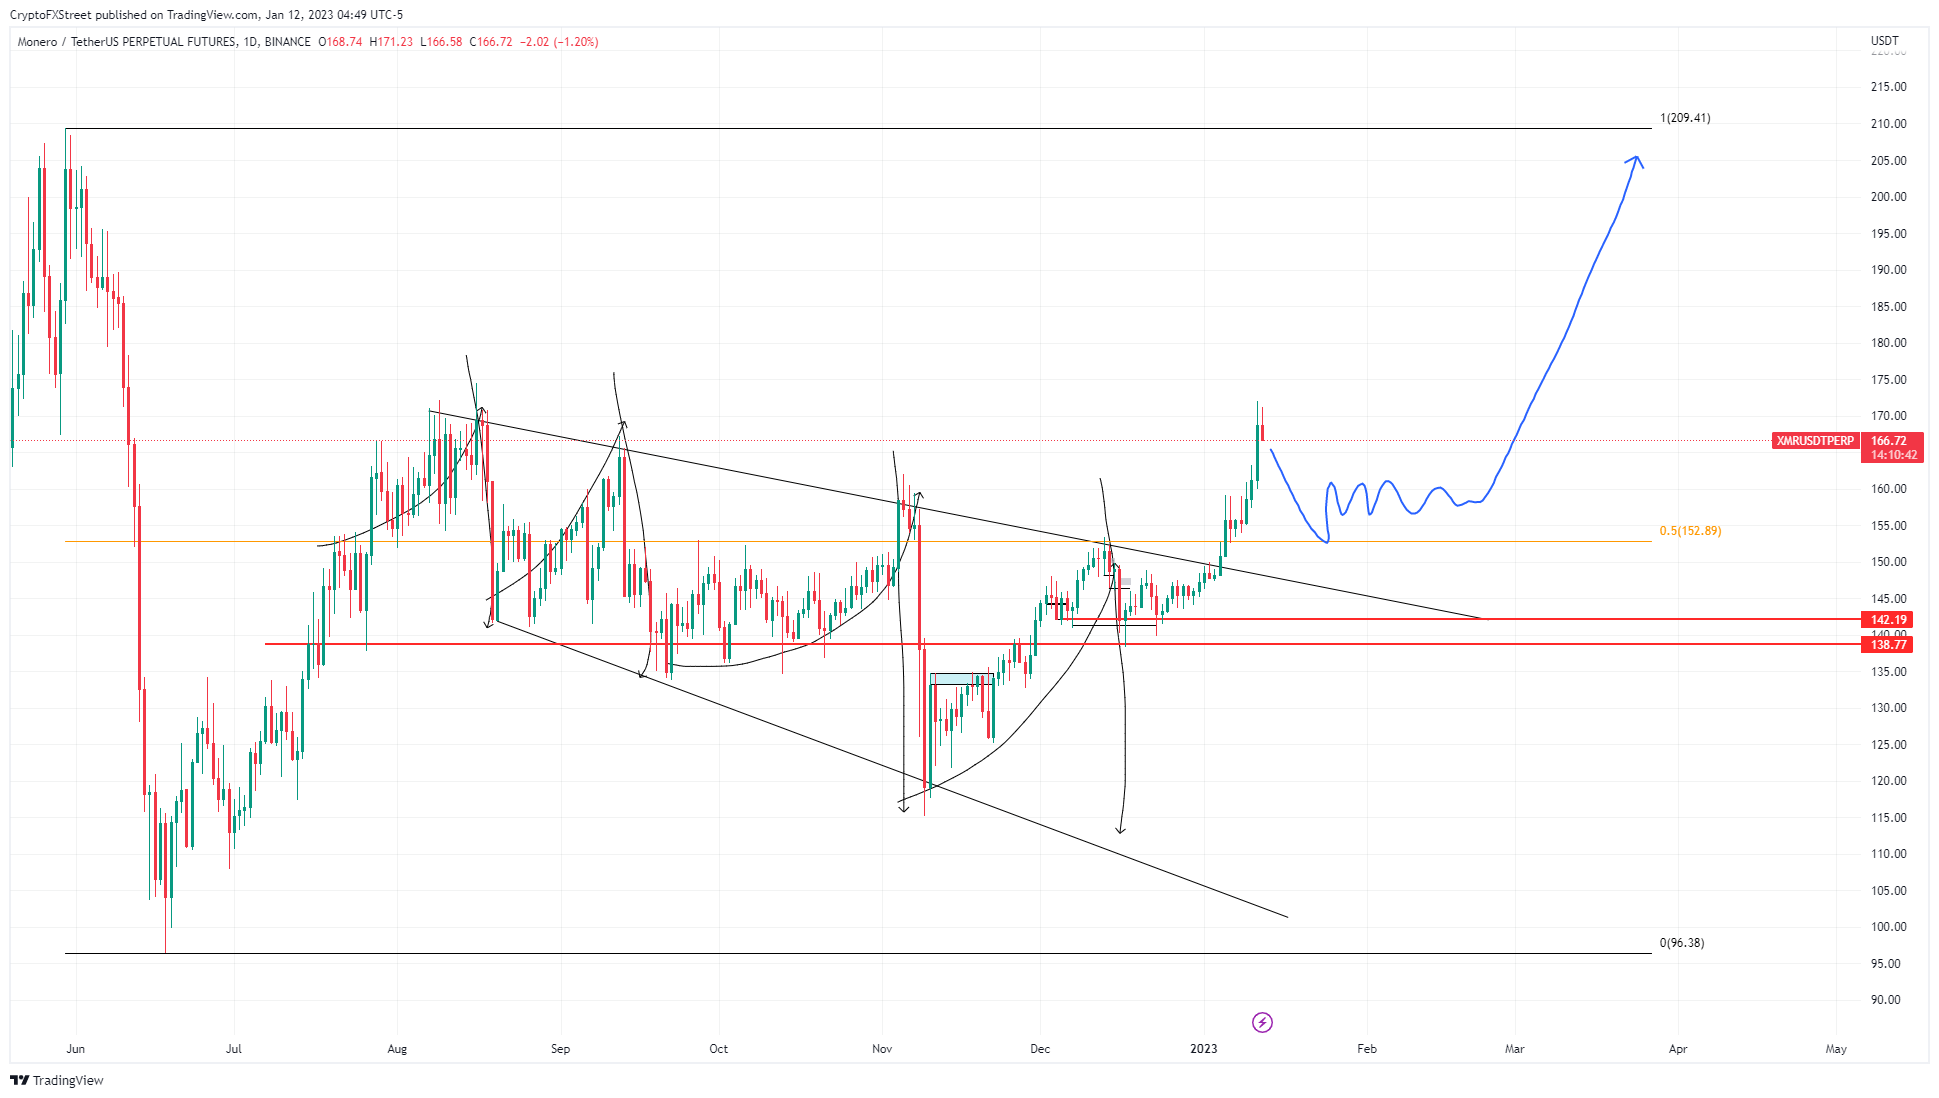
XRM/USDT 1-day chart
A breakdown of this support structure could trigger a massive sell-off that could knock XMR price down to $142.19. This move would invalidate the bullish outlook that Monero has developed after breaking above the five-month declining trend line. In such a case, XMR could slide as low as $138 in search of a support level.
Author

Akash Girimath
FXStreet
Akash Girimath is a Mechanical Engineer interested in the chaos of the financial markets. Trying to make sense of this convoluted yet fascinating space, he switched his engineering job to become a crypto reporter and analyst.


