This key trading pattern hints at the continuation of Fantom’s (FTM) 125% rebound

Fantom (FTM) looks poised to hit a new record high in the coming sessions after its 125% price rebound from $1.23 on Dec. 14, 2021, to $2.84 on Jan. 3, 2022 triggered a classic bullish reversal setup.
Dubbed inverse head and shoulders (IH&S), the setup appears when an asset forms three troughs below a so-called neckline resistance, with the middle trough (the head) deeper than the left and right shoulder.
The price of FTM has recently undergone a similar price trajectory, as shown in the chart below. As a result, FTM has a common resistance in the range defined by $2.55 to $2.74, which encompasses the length of the inverse head and shoulders pattern.
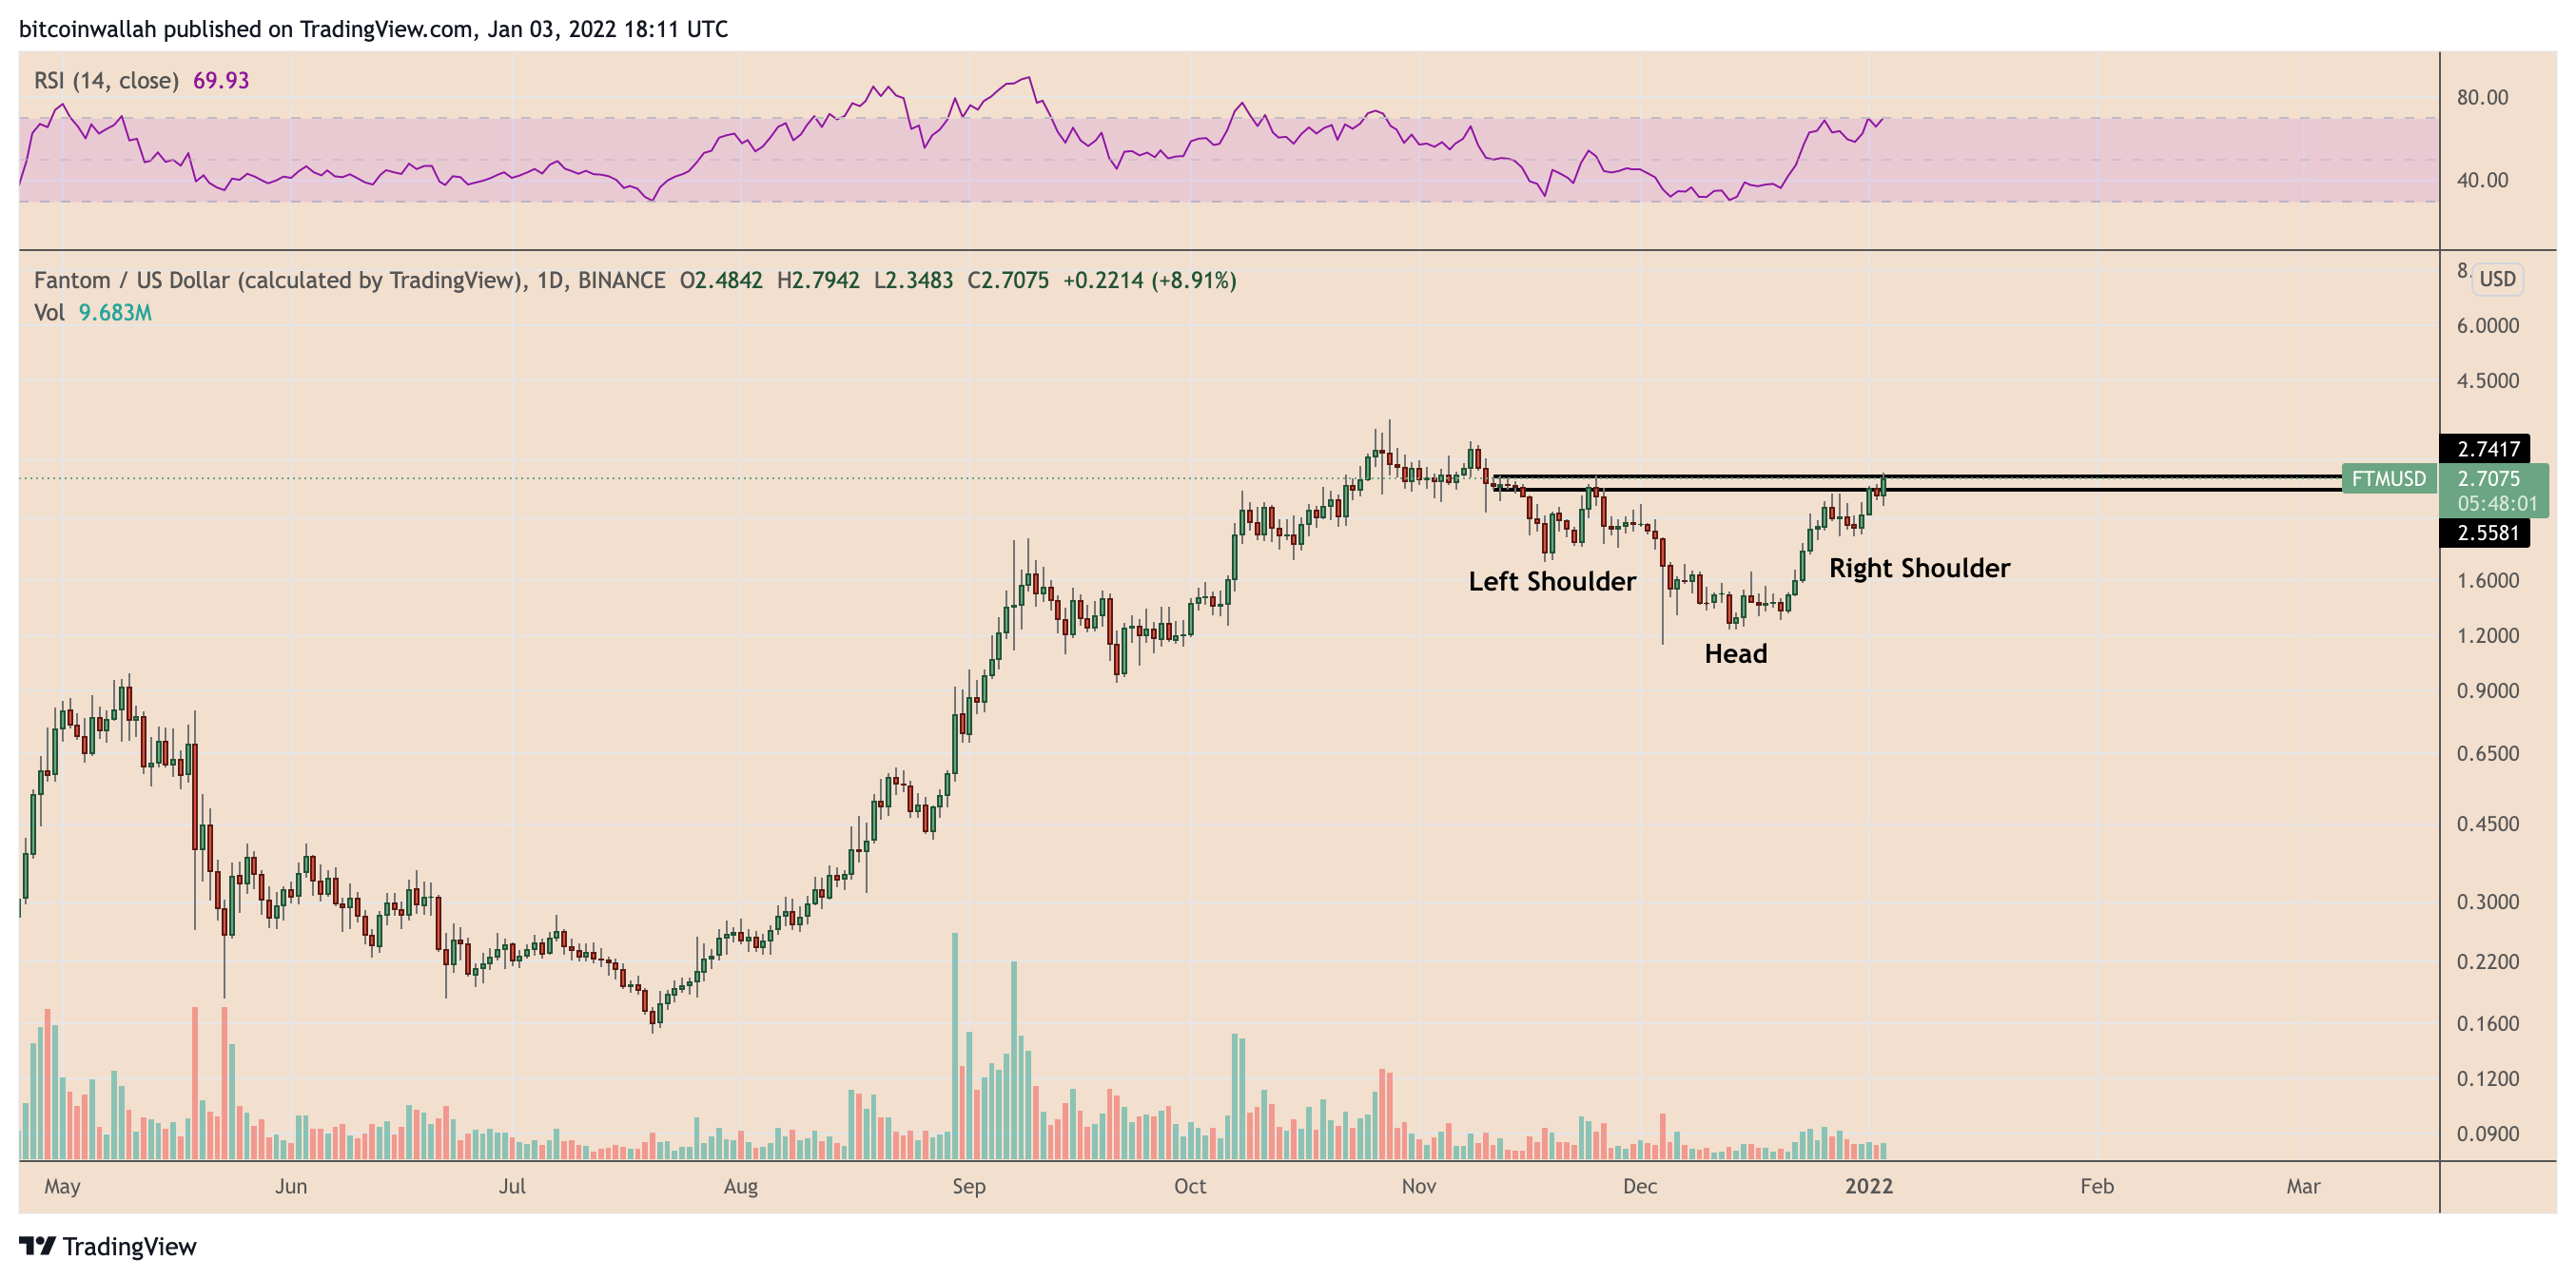
FTM/USD daily price chart featuring inverse head and shoulders pattern. Source: TradingView
Could Fantom rally by another 50%?
In a perfect world, an IH&S pattern would normally result in a bullish breakout once the price closes decisively above the neckline level. Ideally, the upside target be equal to the maximum distance between the head and the neckline, when measured from the breakout point.
On Monday, FTM almost completed its IH&S formation by reaching its neckline. As a result, the Fantom token's next move could be a bullish breakout above the $2.55 to $2.74 resistance range. In doing so, it would pursue a run-up toward $4.33, based on the setup presented in the chart below.
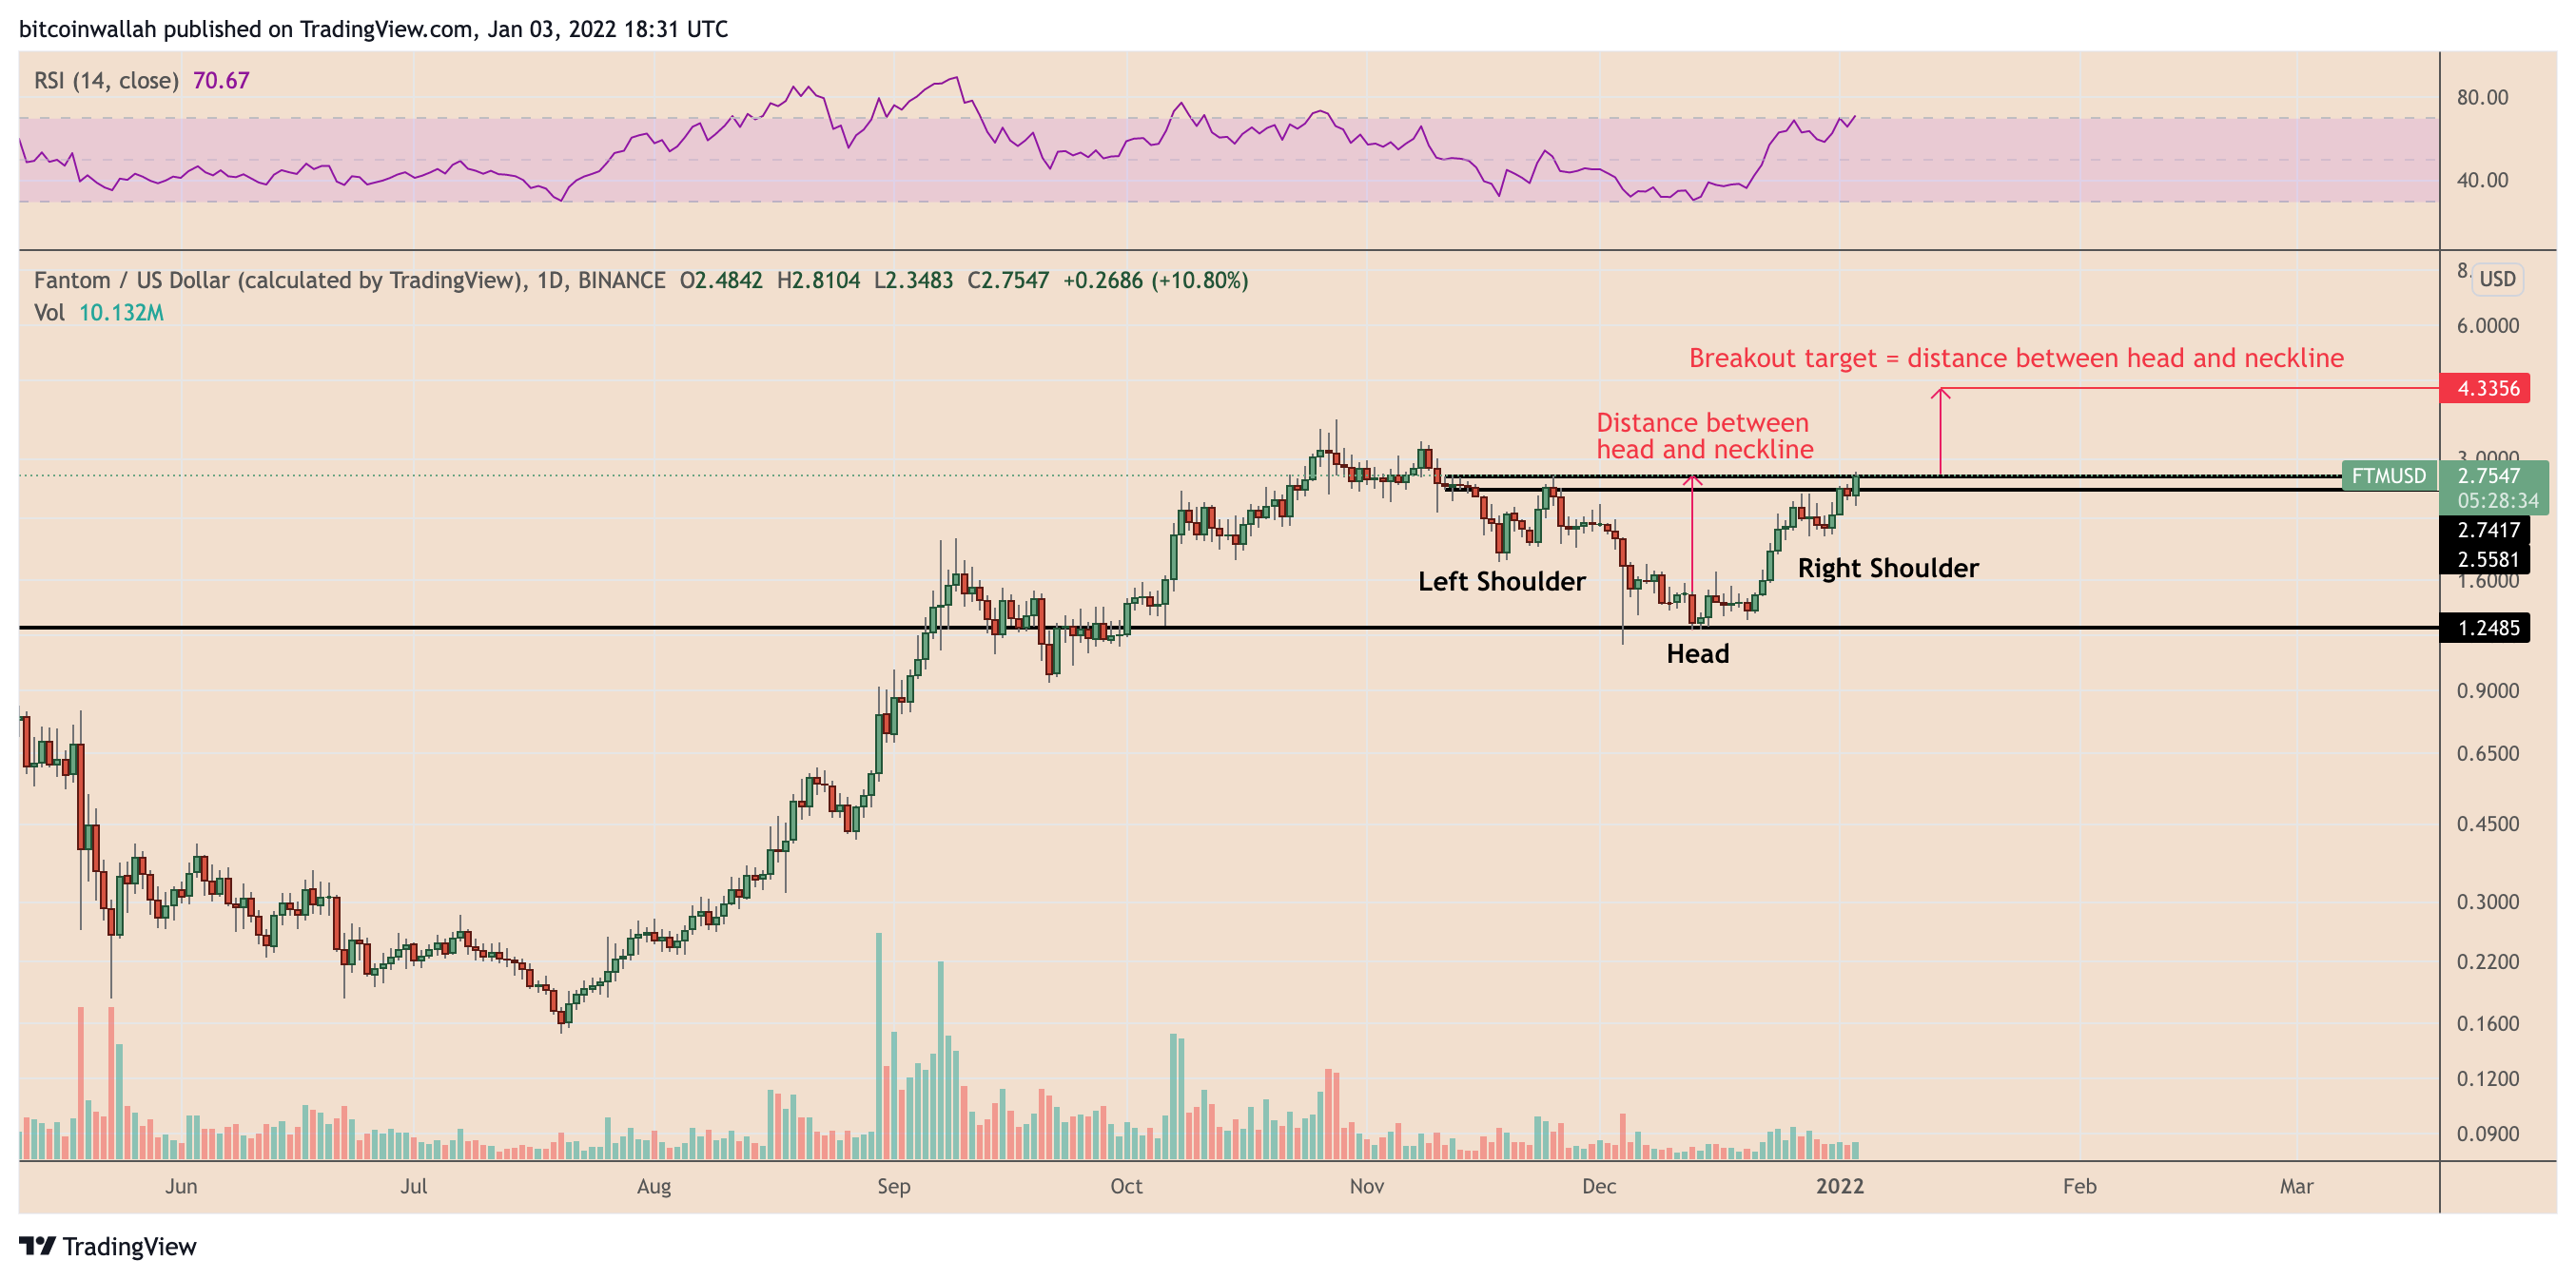
FTM/USD daily price chart featuring the IH&S's breakout setup. Source: TradingView
A sharp price pullback from the neckline range, accompanied by a spike in volume, would risk invalidating the IH&S setup. In that case, the next ideal support line may come near $2.08. This would be based on FTM's volume profile visible range (VPVR), a metric that displays trading activity over a specified period at specified price levels.
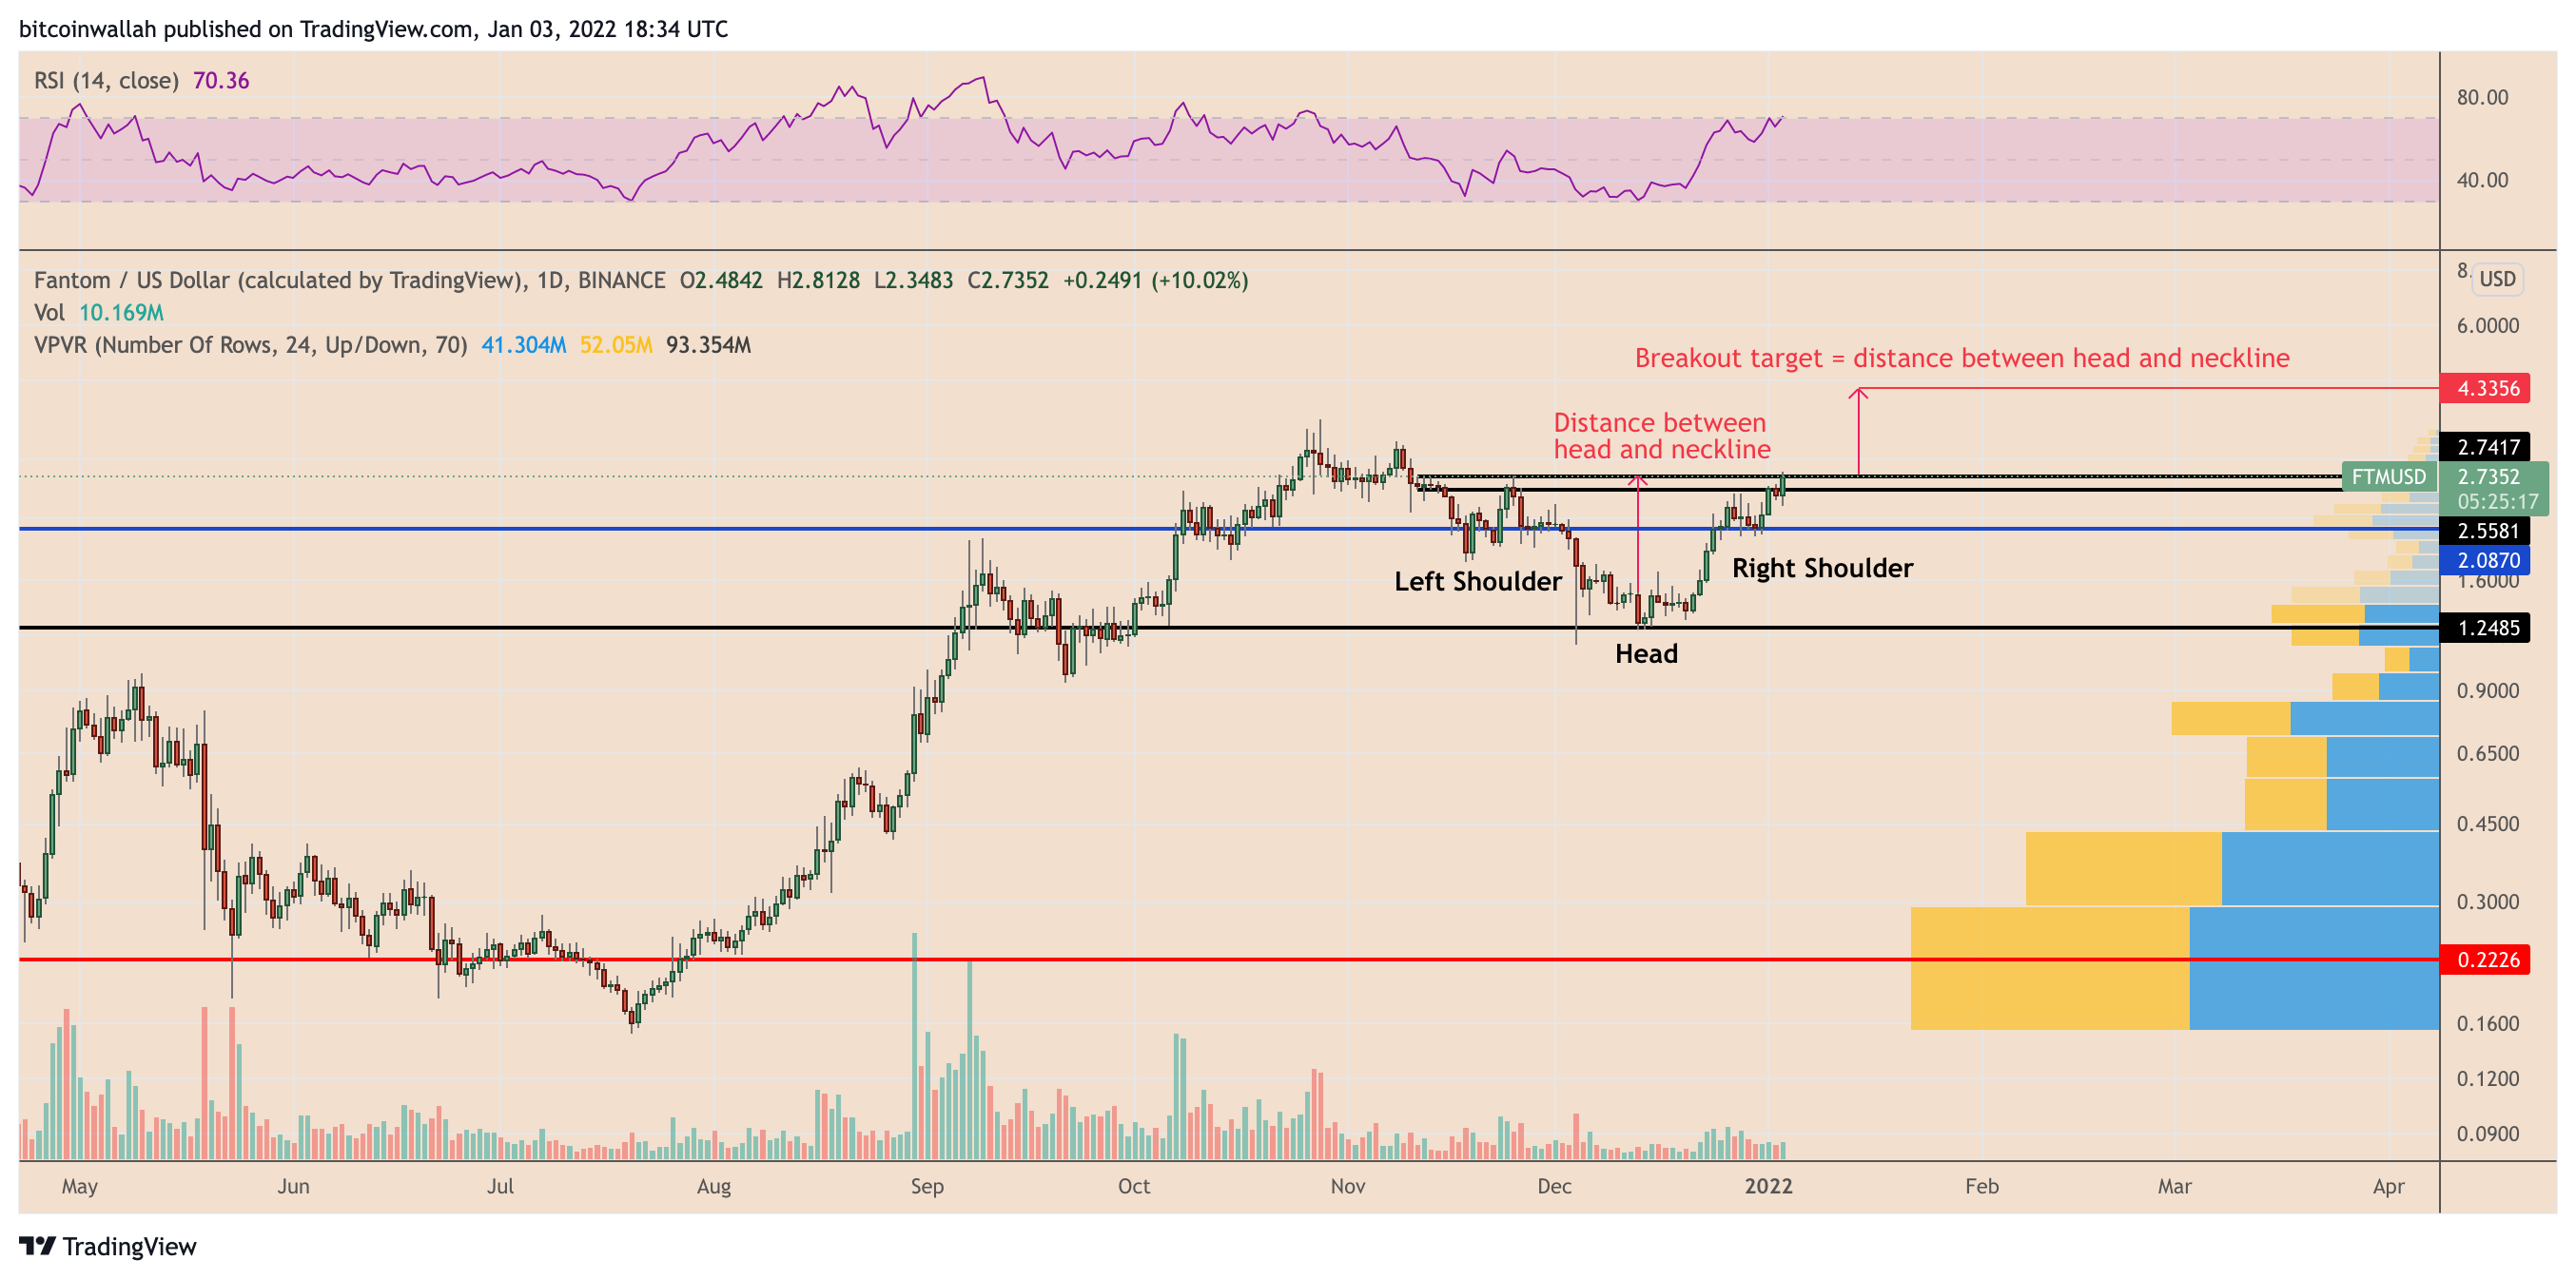
FTM/USD daily price chart featuring volume profile target. Source: TradingView
Are there risks of overvaluation?
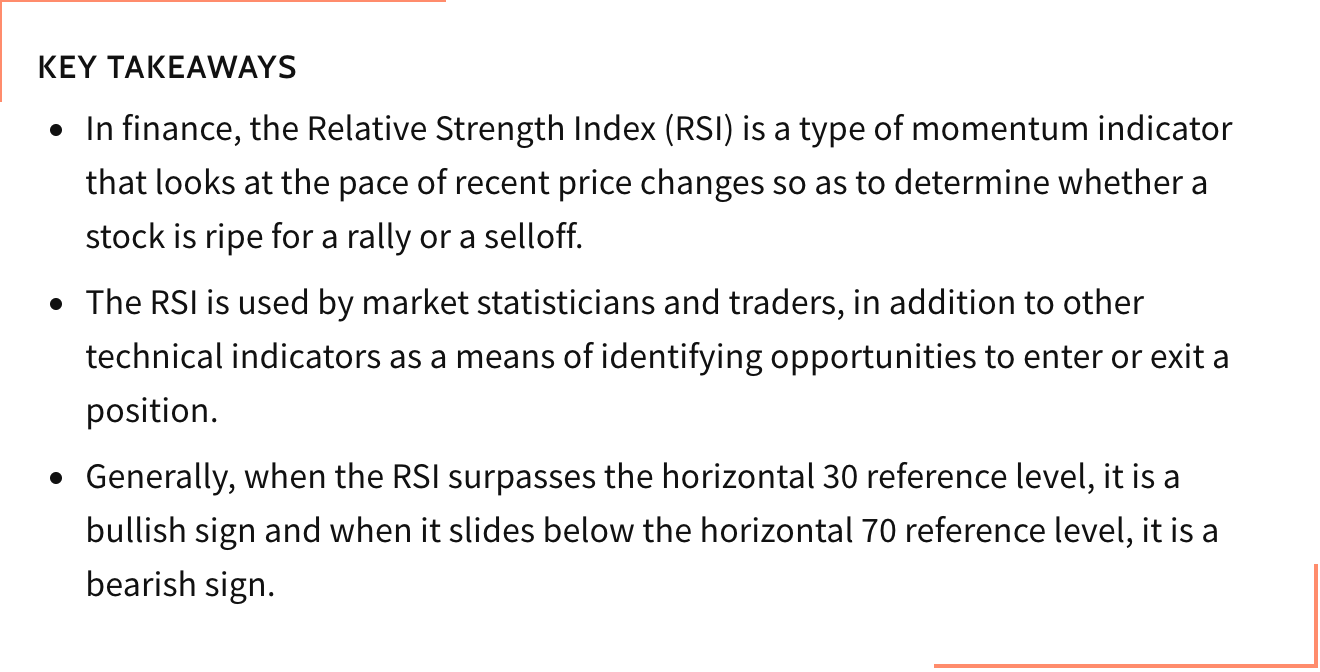
Downside risks in the Fantom market also appeared in the form of its relative strength index (RSI), a metric that measures the magnitude of the asset's recent price changes to evaluate its overbought or oversold conditions.
Relative Strength Index in a nutshell. Source: Investopedia
In detail, FTM's daily RSI entered an overbought territory on Jan. 3 as its reading marginally jumped above 70. The technical indicator suggests FTM is overbought and that it should undergo a certain degree of correction to neutralize its market sentiment.
In layman's terms, an RSI reading above 70 is usually seen as a signal to sell. However, the sell-offs typically do not necessarily come right after RSI jumps into the overbought zone.
Based on multiple RSI corrections spotted between August and September 2021, the FTM price appears to extend its upside momentum even after the indicator crosses above 70. At its best, the daily RSI had reached almost 89 on Sep. 9, coinciding with the FTM price hitting the then-record high of $1.99.
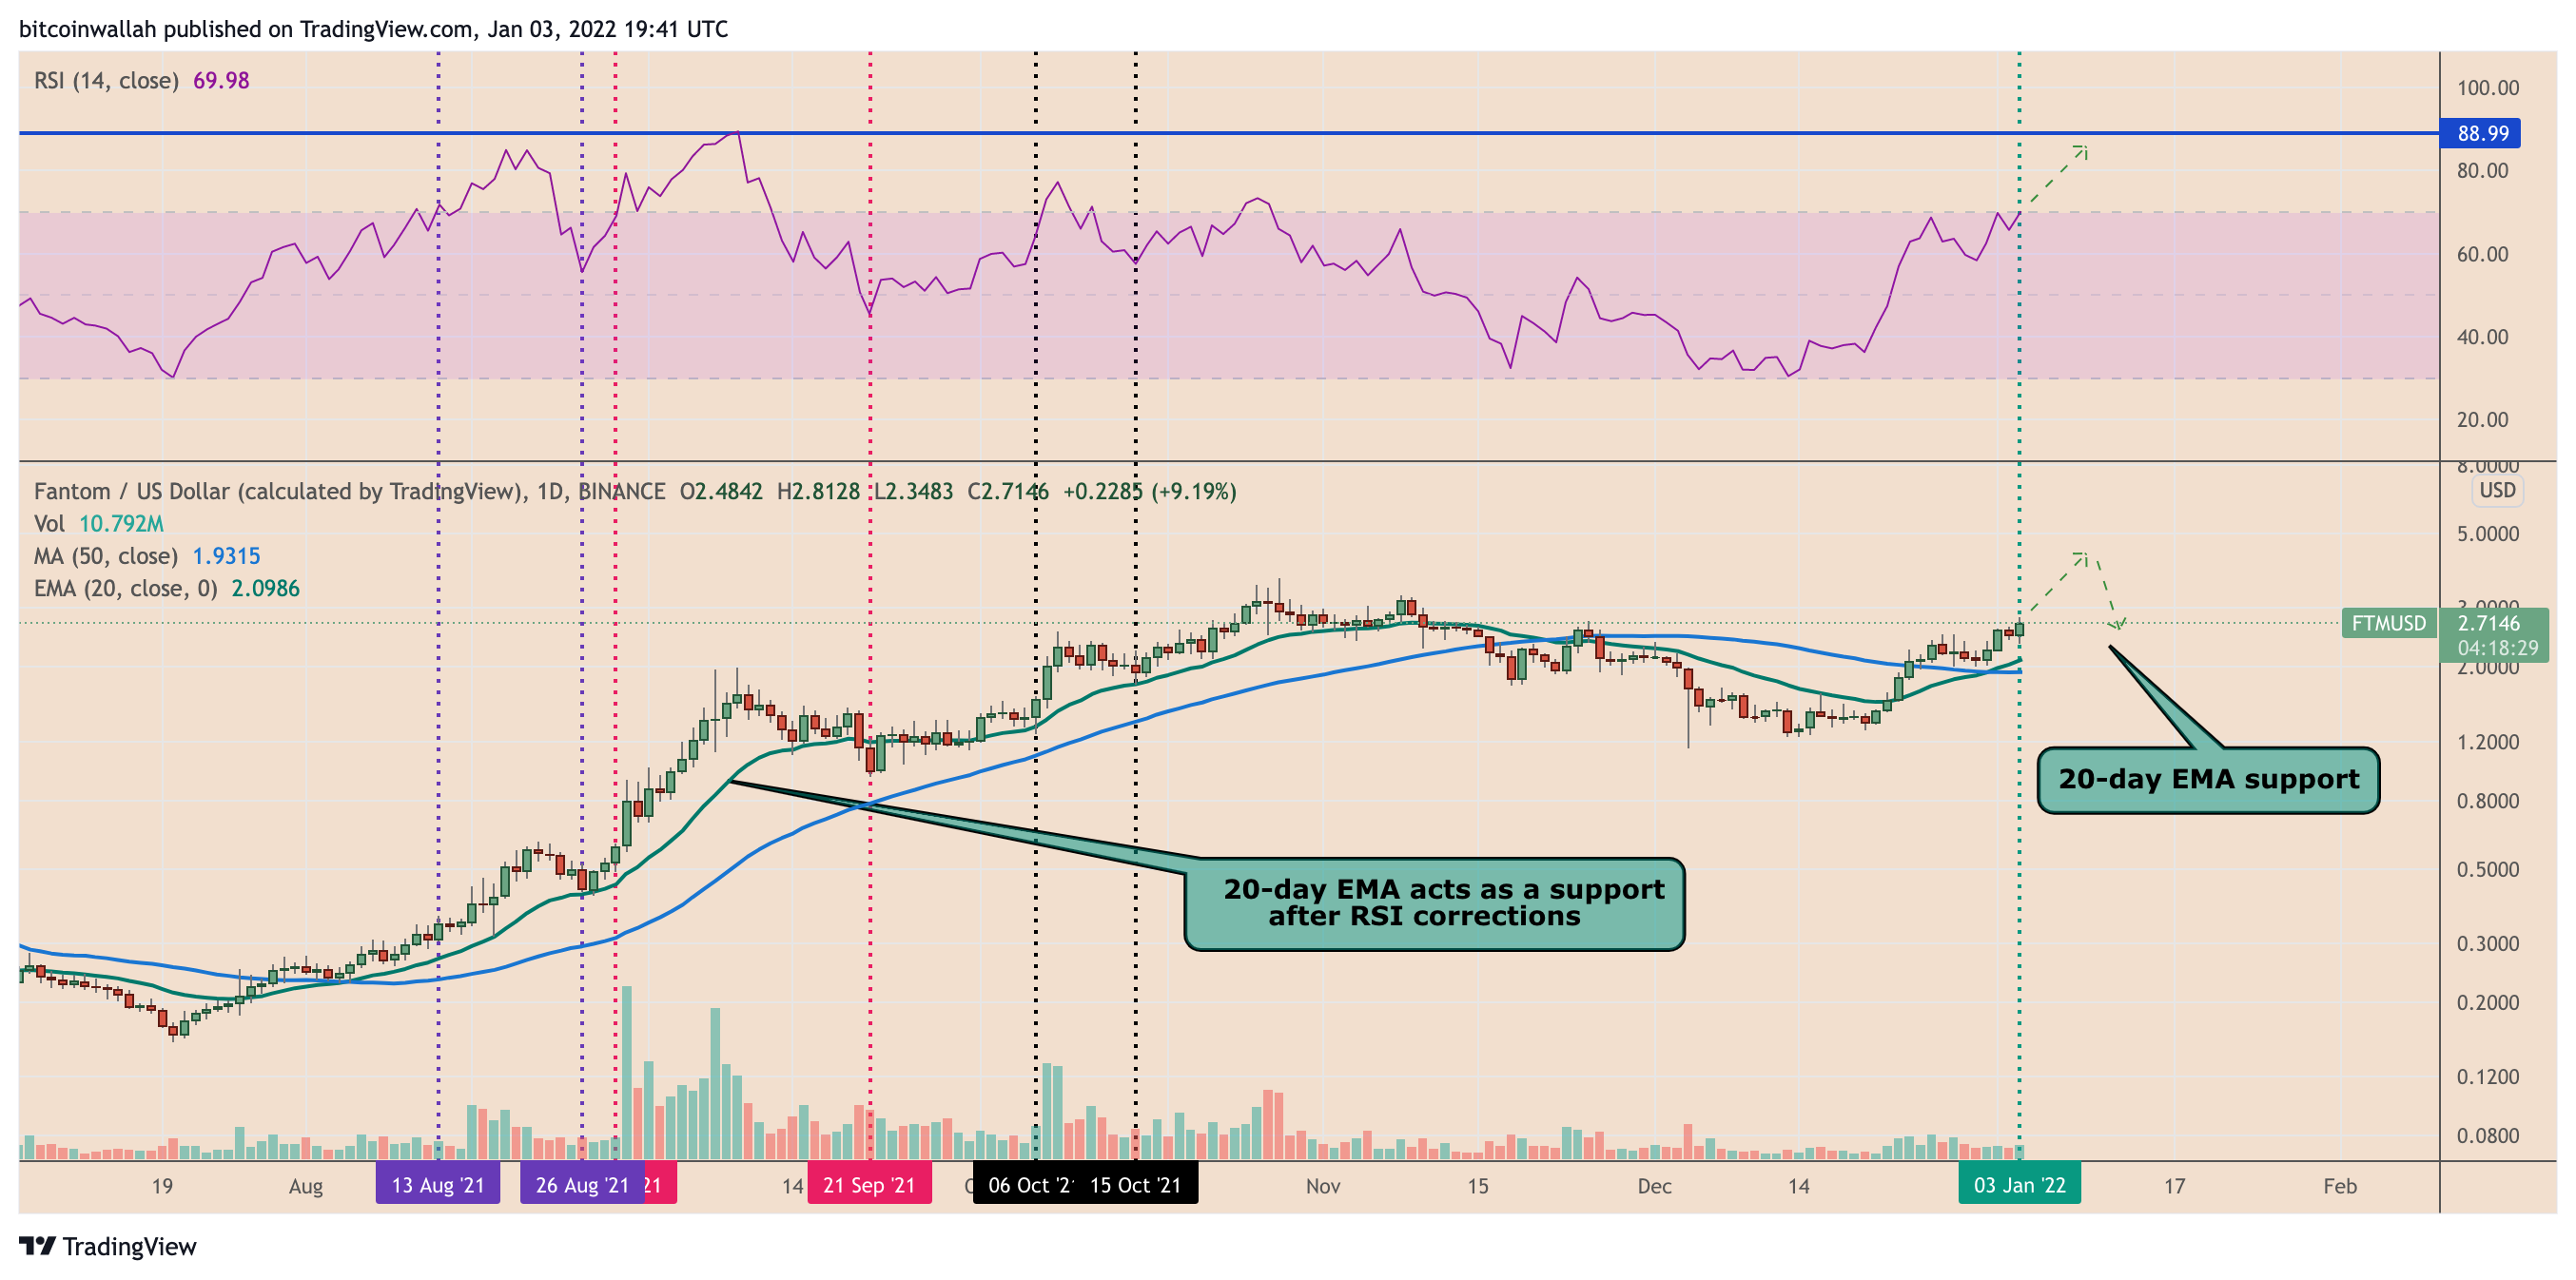
FTM/USD daily price chart featuring RSI-led corrections. Source: TradingView
That somewhat leaves FTM with the possibility of pursuing its IH&S profit target of $4.33 despite its overvaluation risks. What could follow is a correction towards its 20-day exponential moving average (20-day EMA; the green wave in the chart above) around $2.09.
This would bring the price near to the VPVR support at $2.08, as discussed above.
Author

Cointelegraph Team
Cointelegraph
We are privileged enough to work with the best and brightest in Bitcoin.


