Theta token Elliott Wave technical analysis [Video]
![Theta token Elliott Wave technical analysis [Video]](https://editorial.fxsstatic.com/images/i/USDT-bullish-line_XtraLarge.png)
Elliott Wave Analysis TradingLounge.
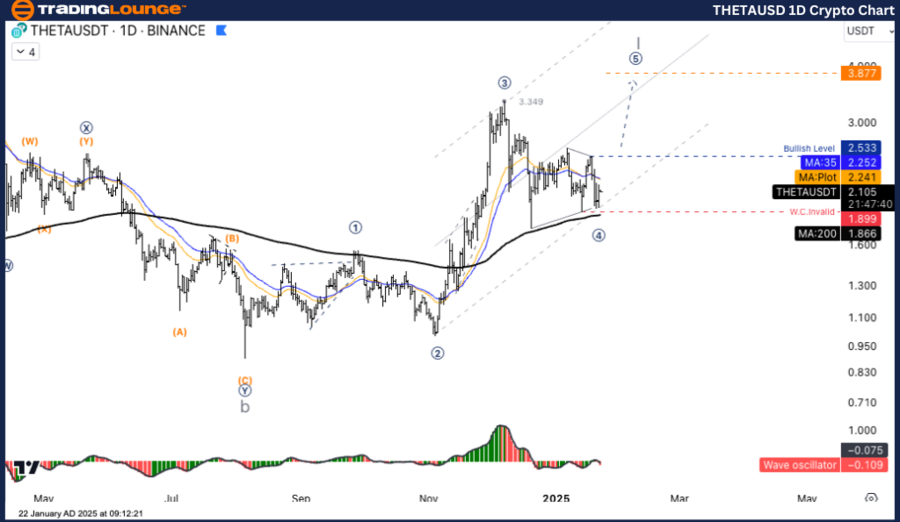
THETA/USD Elliott Wave technical analysis
Function: Follow trend.
Mode: Motive.
Structure: Impulse.
Position: Wave 5.
Direction next higher degrees: Wave 5 of Impulse.
Details: The increase again in Wave 5.
Theta/ U.S. dollar(THETAUSD)Trading Strategy: This correction structure is a Triangle pattern which indicates the continuation of the previous trend. The uptrend correction wave is in the Consolidation Zone with a major support at 1.899 (W.C. Invalid). If the price holds above the support at 2.000 and breaks the resistance at 2.533, a Long position can be opened with a target at 3.877 and a Stop Loss level of 1.899.
Main outlook
- THETAUSDT has an uptrend if the price can break through 2.533 to confirm the start of Wave (5). The target is 3.877 but be careful if the price breaks below 1.899 as it will change the structure.
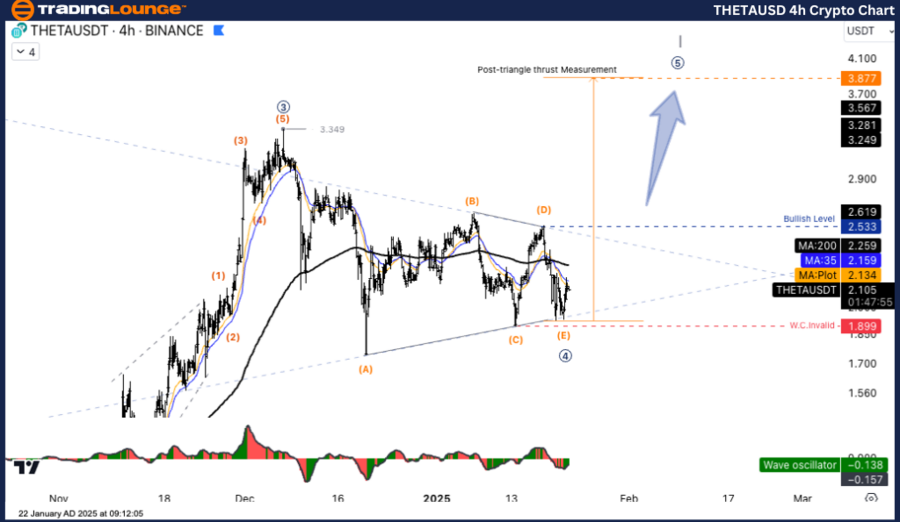
THETA/USD Elliott Wave technical analysis
Function: Follow trend
Mode: Motive
Structure: Impulse
Position: Wave 5
Direction next higher degrees: Wave 5 of Impulse
Details: The increase again in Wave 5.
Theta/ U.S. dollar (THETAUSD) Trading Strategy: This correction structure is a Triangle pattern which indicates the continuation of the previous trend. The uptrend correction wave is in the Consolidation Zone with a major support at 1.899 (W.C. Invalid). If the price holds above the support at 2.000 and breaks the resistance at 2.533, a Long position can be opened with a target at 3.877 and a Stop Loss level of 1.899
Main outlook
- THETAUSDT has an uptrend if the price can break through 2.533 to confirm the start of Wave (5). The target is 3.877 but be careful if the price breaks below 1.899 as it will change the structure.
Theta token Elliott Wave technical analysis [Video]
Author

Peter Mathers
TradingLounge
Peter Mathers started actively trading in 1982. He began his career at Hoei and Shoin, a Japanese futures trading company.


