|

Theta token Elliott Wave technical analysis [Video]

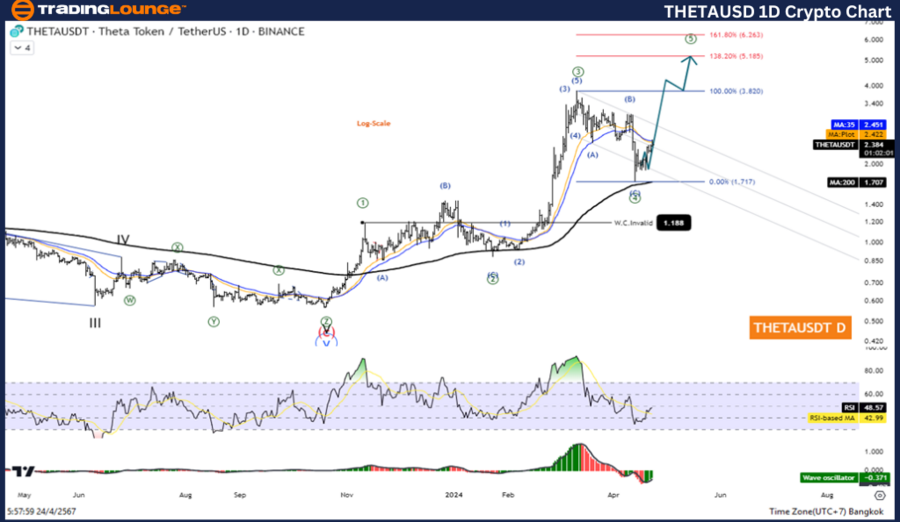
THETA/USD Elliott Wave technical analysis 

Function: Follow trend.    

Mode: Motive.

Structure:  Impulse.

Position:  Wave ((5)).

Direction next higher degrees: Wave I of Impulse. 

Details: Wave ((4) may is complete and the Price entry to uptrend again.

Theta Token/ U.S. dollar(THETAUSD)Trading Strategy: The correction in wave ((4)) appears to be over. And the price is increasing again in waves ((5)), so the overall picture is looking for an opportunity to open a long position. with a target price at the level 5.185 - 6.263

Theta Token/ U.S. dollar(THETAUSD)Technical Indicators: The price is above the MA200 indicating an Uptrend, The Wave Oscillator is a Bullish Momentum.

Chart

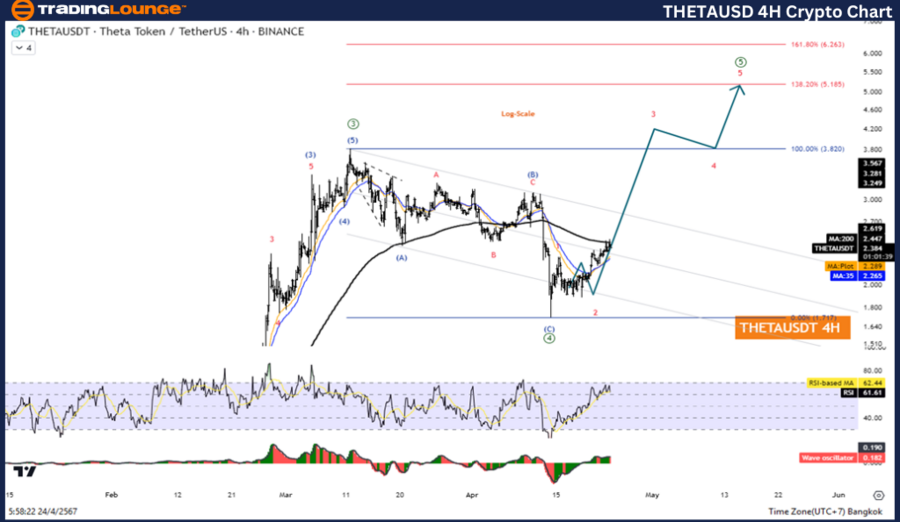
THETA/USD Elliott Wave Technical Analysis 

Function: Follow trend.    

Mode: Motive.

Structure:  Impulse.

Position:  Wave ((5)).

Direction next higher degrees: wave I of Impulse.

Details: Wave ((4) may is complete and the Price entry to uptrend again.

Theta Token/ U.S. dollar (THETAUSD) trading strategy: The correction in wave ((4)) appears to be over. And the price is increasing again in waves ((5)), so the overall picture is looking for an opportunity to open a long position. with a target price at the level 5.185 - 6.263

Theta Token/ U.S. dollar(THETAUSD)Technical Indicators: The price is above the MA200 indicating an uptrend, The Wave Oscillator is a Bullish Momentum.

Chart

Theta token Elliott Wave technical analysis [Video]

Author

Peter Mathers

Peter Mathers

TradingLounge

Peter Mathers started actively trading in 1982. He began his career at Hoei and Shoin, a Japanese futures trading company.

More from Peter Mathers
Share:

Editor's Picks

Bitcoin slips below $90,000 as Trump's tariffs swing, ETF outflows pressure price

Bitcoin price struggles below $90,000 on Friday, correcting nearly 5% so far this week. Trump’s Davos speech on Wednesday, backing away from imposing further tariffs on the EU, triggered market volatility and risk-on mood.

Ripple holds losses above $1.90 amid mild ETF inflows, muted retail interest

Ripple is trading under pressure, hovering above the immediate support level at $1.90 at the time of writing on Friday. Despite mild inflows into spot ETFs, XRP has declined for a second consecutive day, reflecting weak retail demand and persistent selling pressure.

Pump.fun sees bearish reversal despite buyback

Pump.fun trades below $0.0025 at the time of writing on Friday, after a nearly 7% decline from the 50-day Exponential Moving Average at $0.002601. The recent purchase of over $1 million in PUMP tokens failed to revive retail support, as PUMP futures continue to see capital outflow.

Crypto Today: Bitcoin, Ethereum, XRP face elevated downside risk amid weak technical setups

Bitcoin is struggling to stay above support at $89,000 at the time of writing, as headwinds intensify across the cryptocurrency market on Friday. Ethereum and Ripple are facing low retail and institutional demand, while bearish indicators continue to flash subtle signals that losses may extend further.

Bitcoin Price Annual Forecast: BTC holds long-term bullish structure heading into 2026

Bitcoin (BTC) is wrapping up 2025 as one of its most eventful years, defined by unprecedented institutional participation, major regulatory developments, and extreme price volatility.

Bitcoin: BTC slips below $90,000 as Trump's tariffs swing, ETF outflows pressure price

Bitcoin (BTC) is trading below $90,000 at the time of writing on Friday, down nearly 5% this week. Despite a brief improvement in risk appetite following US President Donald Trump’s mid-week speech at Davos, the Crypto King remains under pressure as institutional demand continued to weaken so far this week.