These three Bitcoin metrics say a fresh BTC price move is 'imminent'

Bitcoin (BTC $43,140) is showing classic signs that fresh BTC price gains are near, one longtime market participant says.
In a post on X (formerly Twitter) on Dec. 27, trader and popular social media commentator Matthew Hyland predicted “imminent” bullish moves.
Trader on BTC price: “Seems like a move is imminent”
Bitcoin may have flagged over Christmas, dipping to lows of $41,650, per data from Cointelegraph Markets Pro and TradingView — but the tide could soon change.
For Hyland, two key BTC price indicators point the way to a short-term reversal.
Coming in the form of Bollinger bands and relative strength index (RSI), these have provided advance notice of upside in recent months.
“Daily Bollinger Bands are back to squeezing to the level that triggered the last two moves up through $30k and $40k. With the Daily RSI at 2-month lows, & the 3-Day MACD currently crossing down with less than 3 days to negate,” he wrote.
- It seems like a move is imminent here.
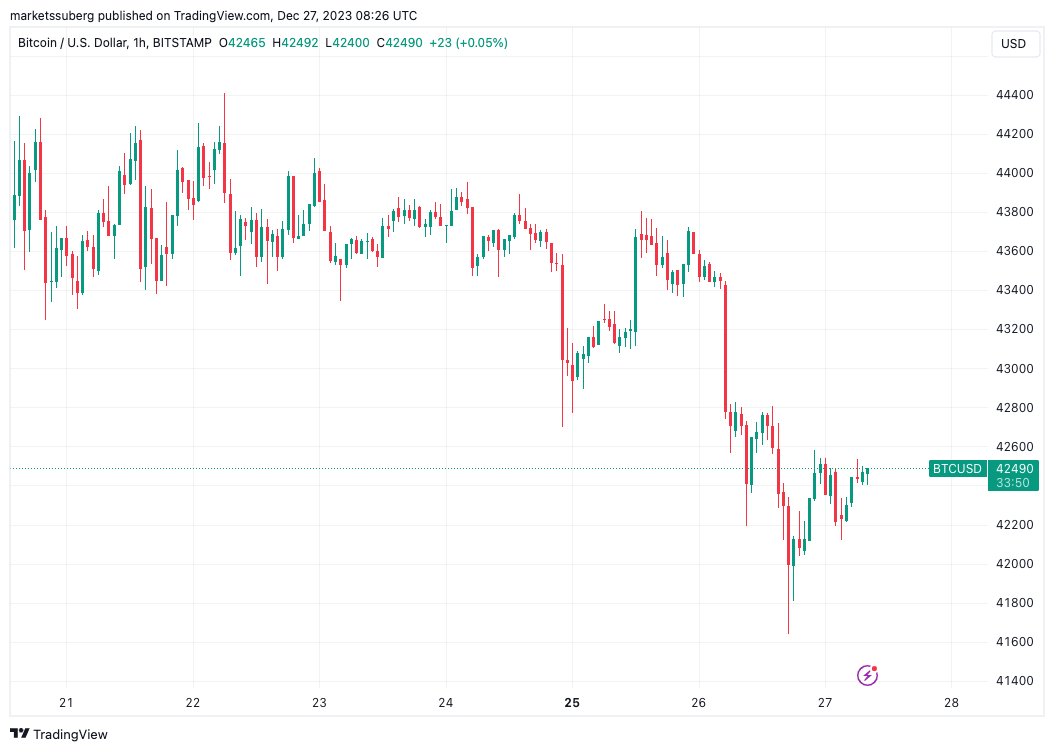
BTC/USD 1-hour chart. Source: TradingView
Bollinger bands constrict
Bollinger bands are a popular volatility indicator, which closely track BTC price action and suggest when volatility could break out.
Currently, the daily-timeframe bands are narrowing after a period of expansion — something which, while not necessarily straightaway, precedes a new round of volatility.
Earlier this year, the bands collapsed to an extremely narrow position, Cointelegraph reported, in the run-up to the recovery above $30,000.
Hyland posted an accompanying chart showing how comparatively tight the bands currently are.
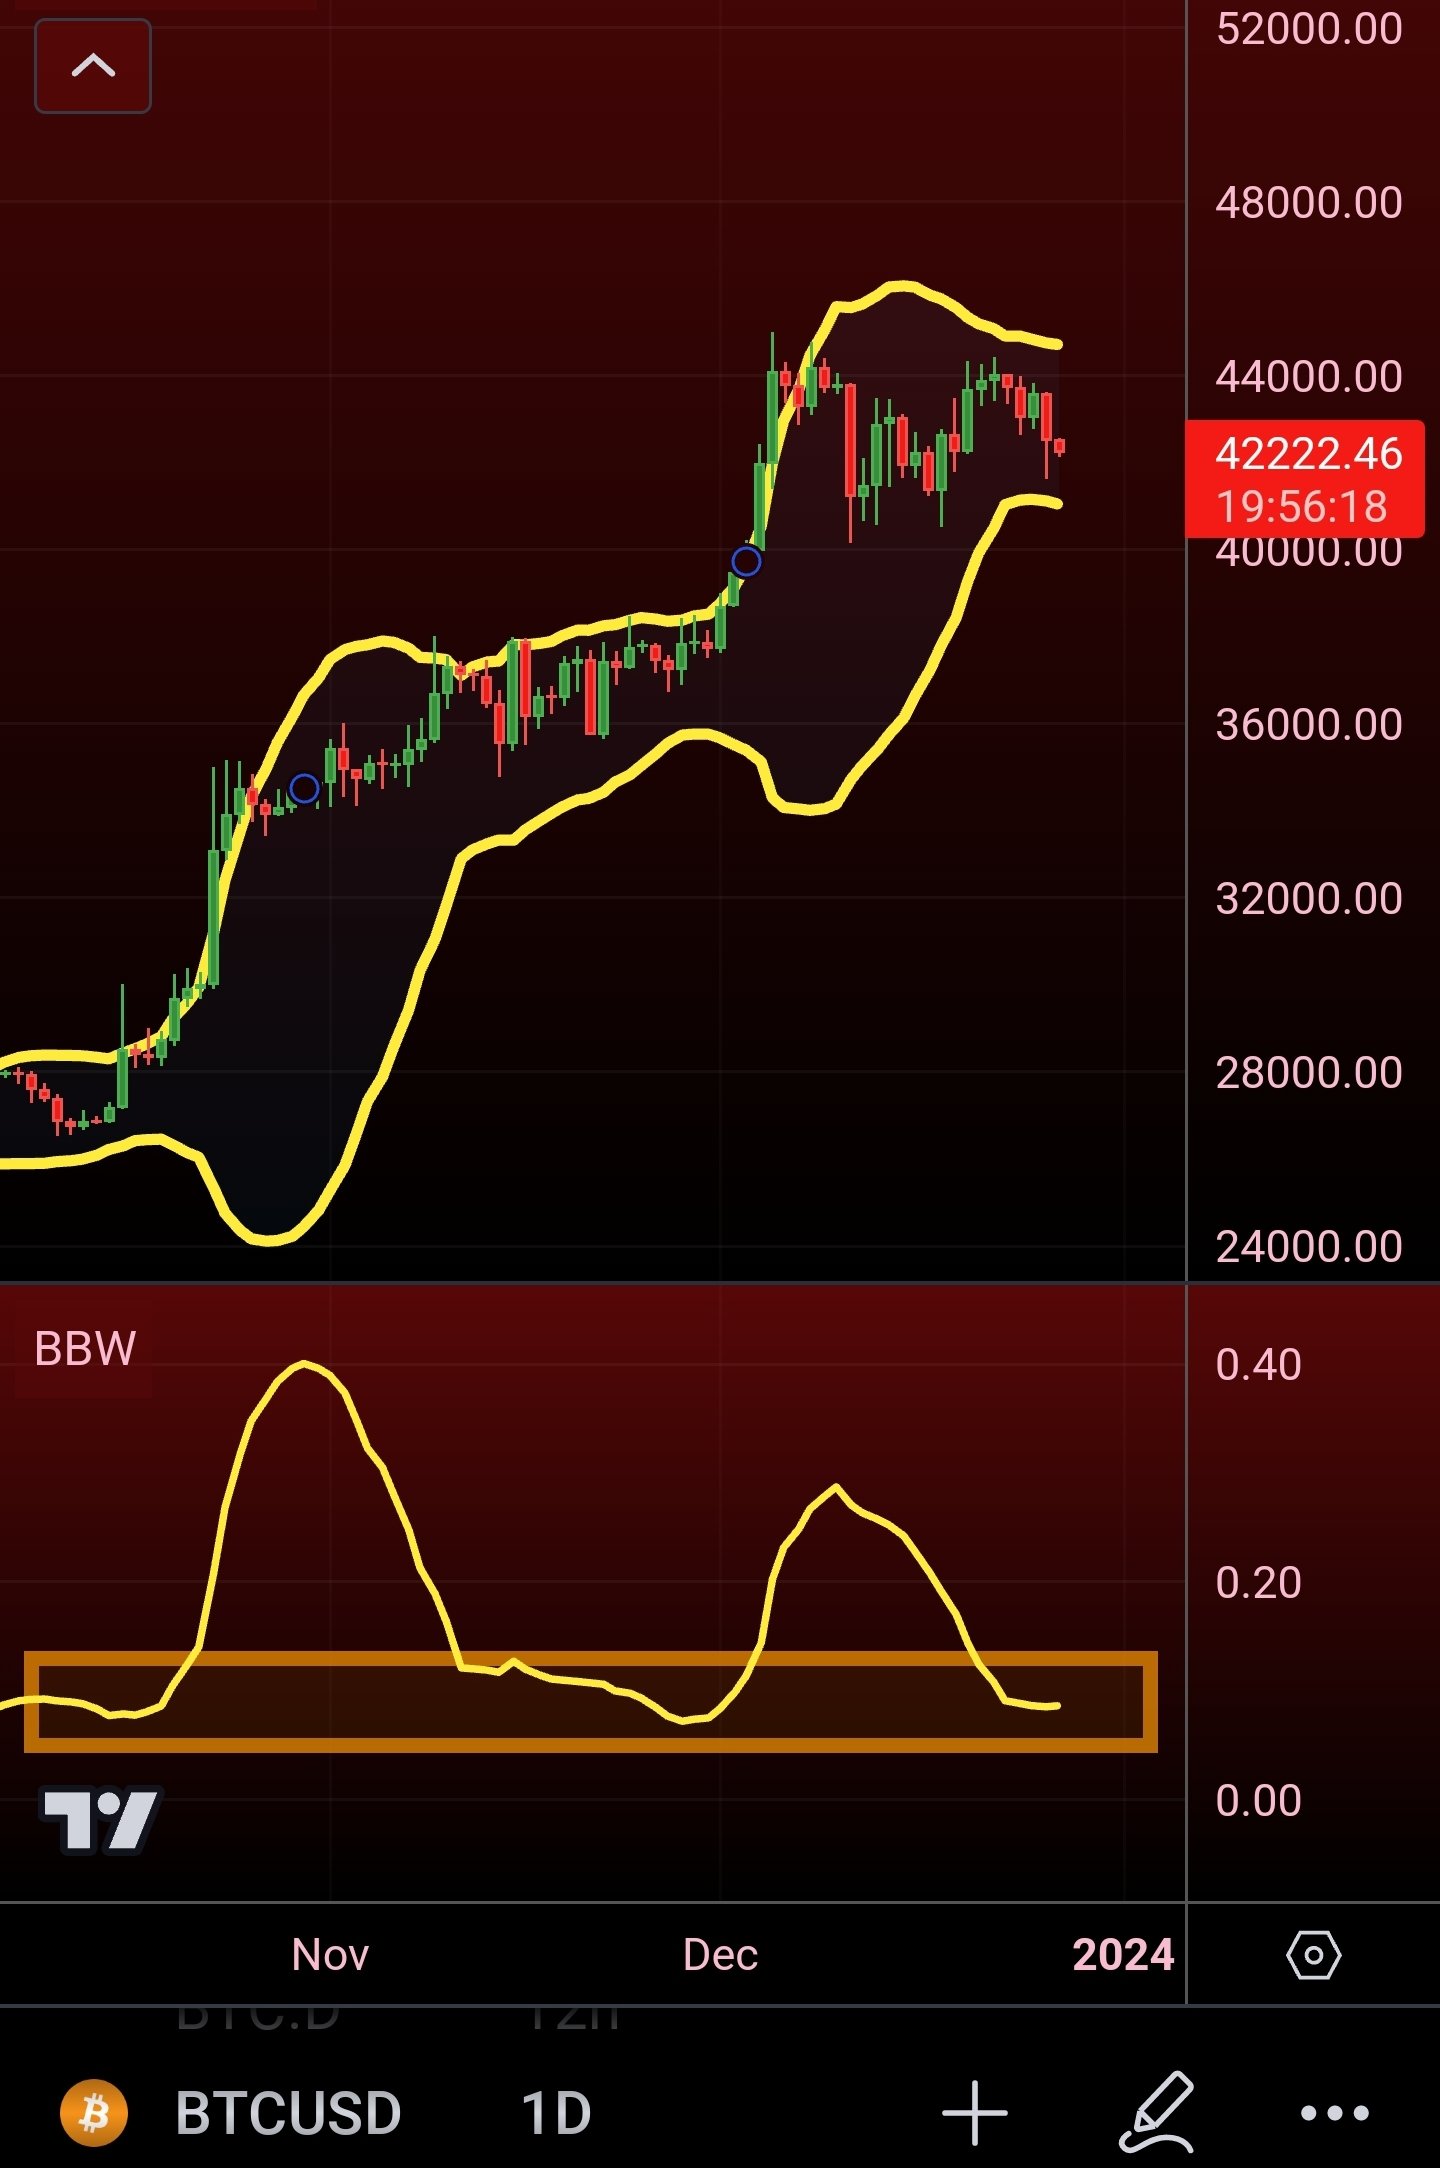
BTC/USD chart with Bollinger bands data. Source: Matthew Hyland/X
RSI flushes out “oversold” levels
Relative strength index (RSI) has proven a faithful tool for Bitcoin traders during the Q4 bullish comeback.
The classic momentum oscillator, which offers an insight into how overbought or oversold BTC/USD is at a given price, has seen something of a reset on daily timeframes in the second half of December.
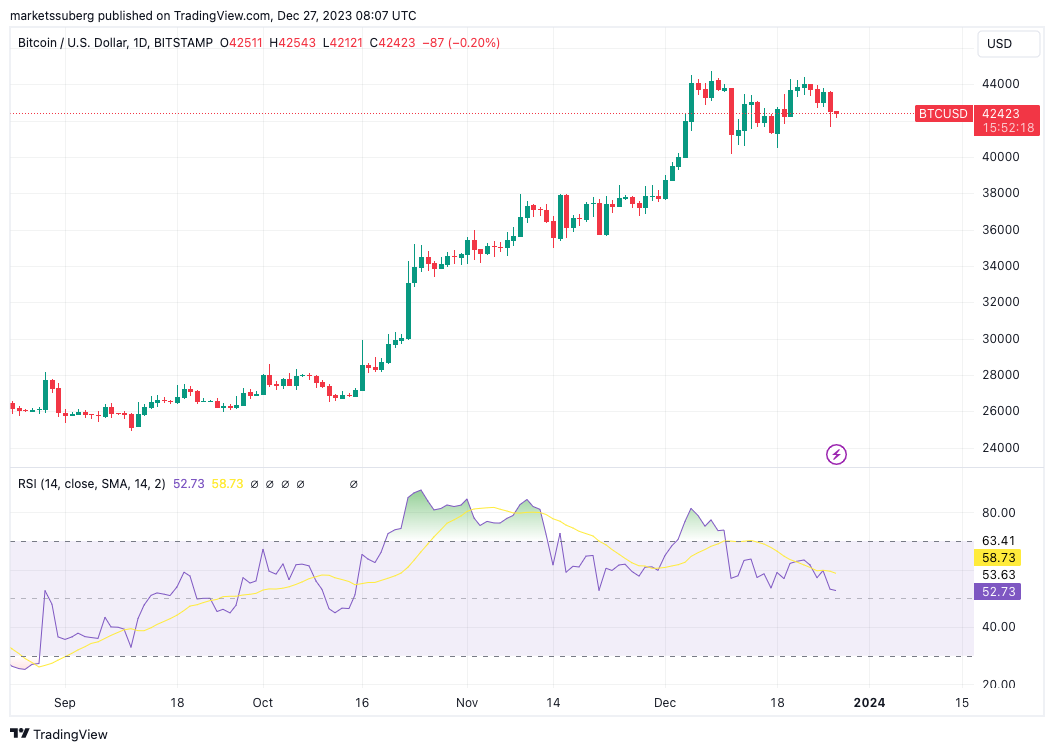
BTC/USD 1-day chart with RSI. Source: TradingView
Now at 53, RSI is firmly below the “overbought” 70 line — and even further below its month-to-date peak of 76.
Longer timeframes are just as promising, as noted last week by veteran trader Peter Brandt.
Some analysts claim that Bitcoin is terribly overbought.
— Peter Brandt (@PeterLBrandt) December 21, 2023
In fact, the monthly RSI is currently at the sweet spot where previous bull markets have greatly accelerated their advances. Not predicting this -- just pointing it out. #bitcoin $BTC $BTCUSD pic.twitter.com/XBrDYMKaMc
“Daily RSI currently at lowest levels in over two months; when price was below $27k,” Hyland meanwhile added in a separate X post.
MACD counts down for bears
One other indicator, however, may yet throw a spanner in the works when it comes to a happy new year for Bitcoin bulls.
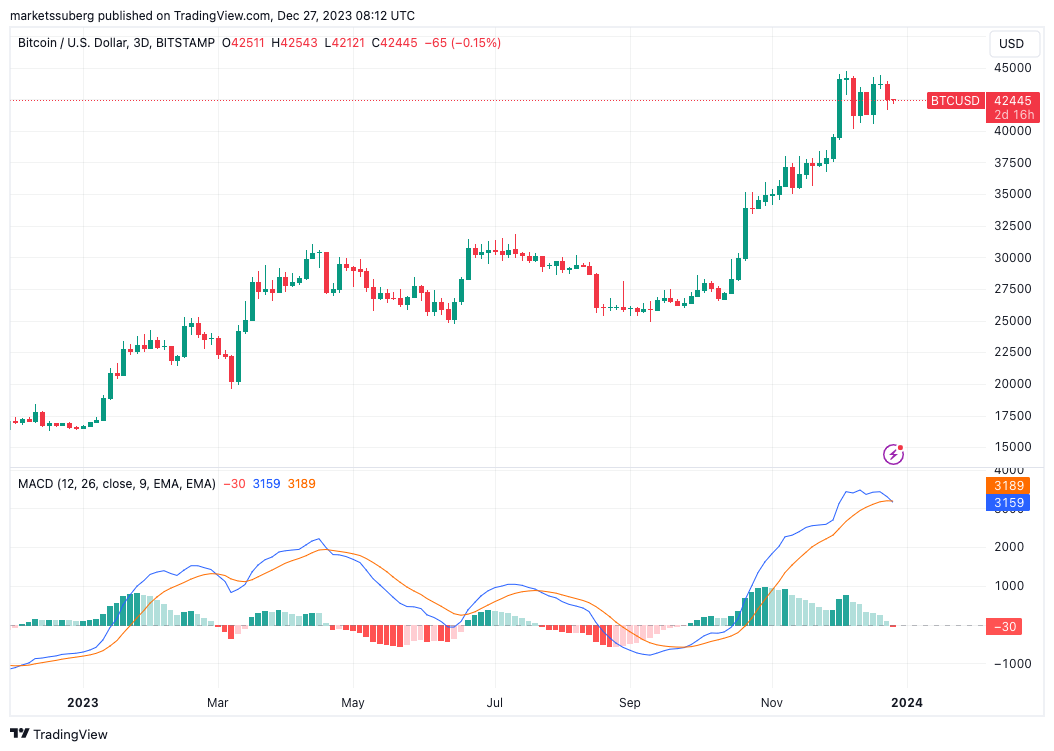
BTC/USD 3-day chart with MACD. Source: TradingView
This is moving average convergence divergence (MACD), which on three-day timeframes is threatening a bearish trend flip.
Hyland notes that several days remain in order for the signal to “negate” itself thanks to price action.
“Cross was 100% accurate the whole year leading to lower and higher prices after,” part of further commentary on Dec. 27 read.
#Bitcoin 3-Day MACD currently crossing down
— Matthew Hyland (@MatthewHyland_) December 27, 2023
Next 3-Day candle closes in 3 days so 3 days to negate based on priced action
Cross was 100% accurate the whole year leading to lower and higher prices after
The last bull cross up occured around $27k which we updated at time https://t.co/wffcBEa2Y9
Author

Cointelegraph Team
Cointelegraph
We are privileged enough to work with the best and brightest in Bitcoin.


