These indicators pinpoint the next down leg in Dogecoin price
- Dogecoin price flashes a sell signal after breaking out of an ascending parallel channel.
- The 200 SMA provides the last line of defense amid lingering losses to $0.0666.
- Dogecoin creator says he dislikes Elon Musk because it is popular to do so.

Dogecoin price, like many other cryptocurrencies, finds itself at a make-or-break moment on the first day of the new month. As reported, Bitcoin price had snapped out of its FOMC-driven rally and was seeking support at $23,000 on Monday, providing more insight into the heads across the market. Similarly, DOGE holds above $0.0666 while trying to change a rather grim narrative.
Dogecoin Creator Dislikes Elon Musk
Billy Markus, the founder of the most popular meme coin, says that he has been forced to change his view of Elon Musk. While replying to a tweet by the Whole Mars Catalog Twitter handle, which hinted at an article that will talk about people who have bought Tesla based on their liking of Musk, Billy explained that the media had led him to dislike Musk.
“I used to like Elon Musk, but then the media started to say bad things, and it became popular to dislike him, so to keep my cred, I have to dislike him too. According to the media, I make all my purchasing decisions based on how much I care for the CEO of a company’s behavior.”
Musk defended himself, saying that “media has strong negative bias and is driven by clicks.” The billionaire argued that he makes for a good topic because he generates a lot of clicks. He was optimistic that the same media would build him up when the negative press died down.
Dogecoin price downtrend could gain momentum
Dogecoin price must defend support provided by the four-hour 200 Simple Moving Average (SMA) to avoid extending the down leg to $0.0600. Its rejection from the resistance observed at $0.0747 added credence to the ongoing retracement. Moreover, a sell signal presented by the four-hour Moving Average Convergence Divergence (MACD) suggests that more pain may follow south of the above support area.
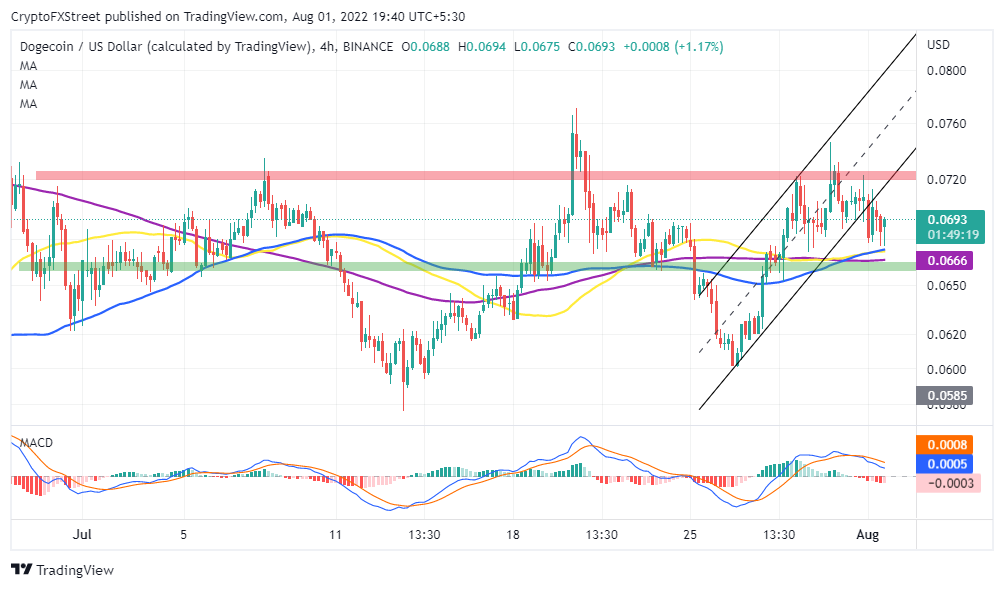
DOGE/USD four-hour chart
The market value realized value (MVRV) on-chain metric by Santiment might trigger another sell-off if it fails to hold above the mean line, as shown in the chart below. Readings above the mean line imply the token is becoming overvalued, and a correction is likely to occur anytime.
 [18.37.18, 01 Aug, 2022]-637949669483029873.png)
Dogecoin MVRV chart
Similarly, downward movement below the same line will encourage investors to offload their bags, thereby adding to the selling pressure. Price analysis highlights $0.0600 as a possible floor price where the downtrend could stall and a significant rebound develop.
Author

John Isige
FXStreet
John Isige is a seasoned cryptocurrency journalist and markets analyst committed to delivering high-quality, actionable insights tailored to traders, investors, and crypto enthusiasts. He enjoys deep dives into emerging Web3 tren


