The Graph Price Prediction: GRT future depends on two critical technical levels
- The Graph is stuck between the 100 SMA support and the 50 SMA resistance.
- The MVRV returns to the buy zone as recovery to an all-time high lingers.
- A break under the descending channel’s middle boundary could trigger losses toward $1.4.

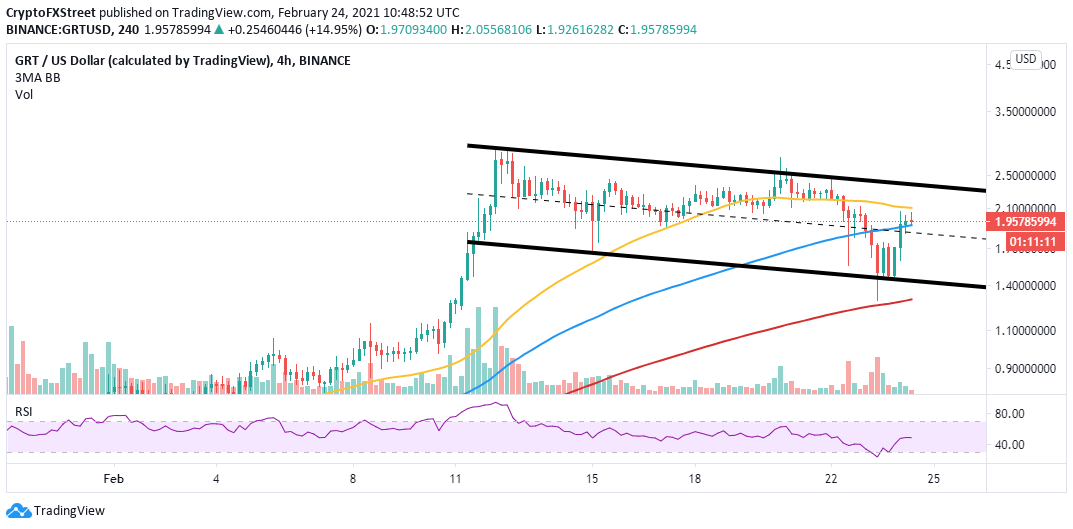
The Graph is trading at $1.95 after recovering from the dip to $1.4. The massive losses occurred in the cryptocurrency market on Tuesday and affected the majority of the cryptoassets. Support was given by the descending parallel channel’s lower edge, whereby a rebound occurred with GRT stepping above middle boundary resistance.
The Graph in lock-step recovery
Following the 100 Simple Moving Average (SMA) break above, the Graph closed in on the next resistance level at the 50 SMA. Closing the day above the immediate resistance will pave the way for gains beyond $2, which may restart the breakout towards the all-time high of $2.86.
The Relative Strength Index (RSI) supports a bullish outlook, but only a break above the 50 SMA will validate the uptrend. On the other hand, the immediate support at the 100 SMA must stay in place to ensure the focus remains on higher levels.
GRT/USD 4-hour chart
The MVRV model by Santiment reveals that GRT is back in the buy zone. The on-chain analytics platform explains the MVRV “shows the average profit or loss of those holding GRT tokens which moved in the last 30 days, based on the price when each token last moved.”
In other words, a small MVRV ratio indicates that holders of GRT are in losses are have just broken out on their investment, therefore, are unlikely to sell. On the contrary, a higher ratio highlights that holders are in profit and consider selling for profit.
%20[14.03.44,%2024%20Feb,%202021]-637497624016252764.png)
The Graph IOMAP model
Looking at the other side of the picture
The 4-hour chart shows that the overall volume is low, hence The Graph may embrace consolidation before the next massive move. Note that failure to close the day above the 50 SMA will jeopardize the upswing to the record highs.
Author

John Isige
FXStreet
John Isige is a seasoned cryptocurrency journalist and markets analyst committed to delivering high-quality, actionable insights tailored to traders, investors, and crypto enthusiasts. He enjoys deep dives into emerging Web3 tren


