The battle between Bitcoin bulls and bears in October — Who holds the upper hand?

October is ending, and Bitcoin will likely close the month with a spinning top candle — a pattern reflecting equilibrium between bulls and bears.
What are the forces driving each side this month? Understanding the dynamics behind this tug-of-war helps investors identify key causes and manage risk more effectively.
Bearish forces in October
Starting with the bears, several indicators show that selling pressure increased toward the end of October. Short-term holders (STH) have been actively taking profits and sending many BTC to exchanges.
According to data from CryptoQuant, around 18,700 BTC was transferred to exchanges by short-term holders in the final week of October, primarily to realize profits.
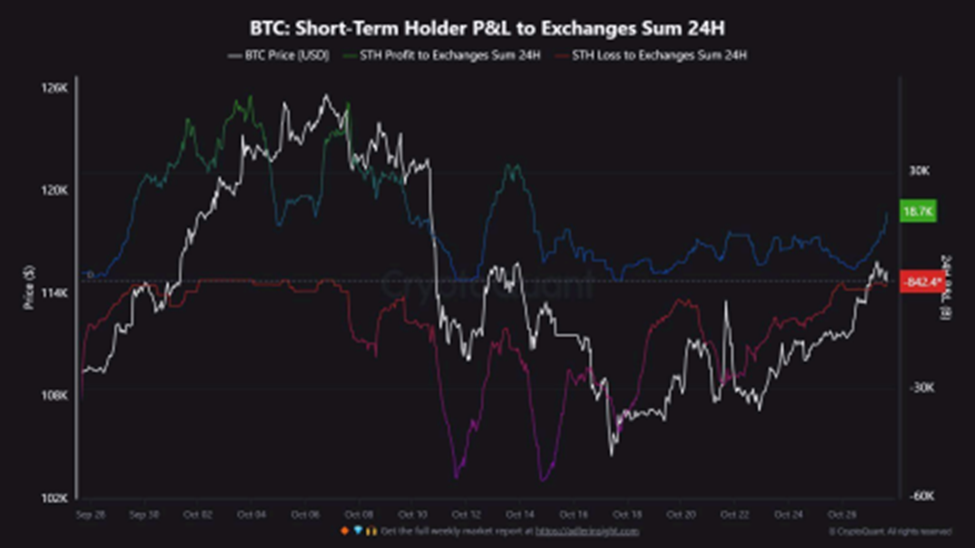
BTC Short-term Holder P&L to Exchanges Sum. Source: CryptoQuant.
This reflects a cautious sentiment. Although Bitcoin’s price rebounded from below $104,000 to over $130,000, many short-term investors doubted the rally could sustain momentum. They chose to exit the market, secure their gains, and wait for clearer price signals.
In addition, data from Blockworks and Coinbase show that demand for BTC from digital asset traders has dropped to its lowest level this year.
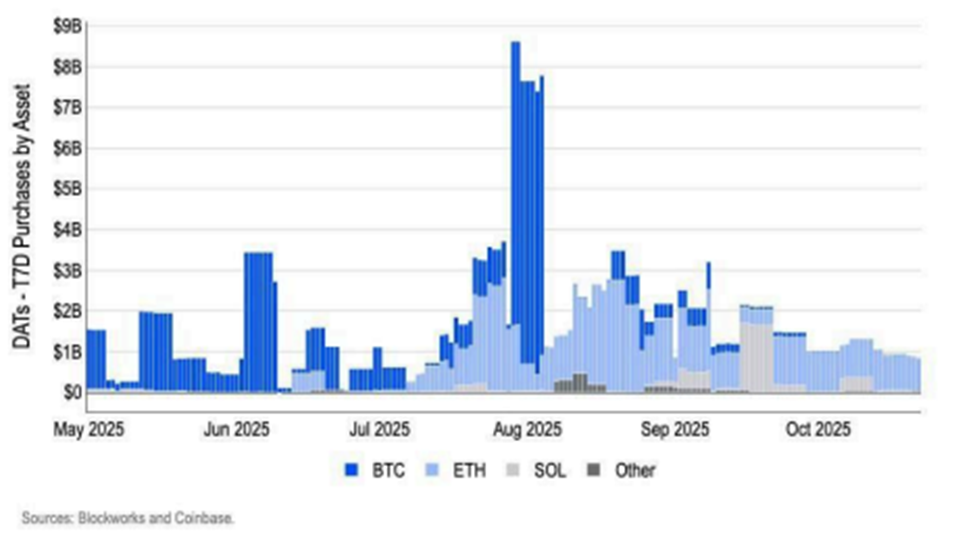
DATs Purchases by Asset. Source: Blockworks and Coinbase
If weak demand continues and short-term holders maintain their selling pressure, bears could push Bitcoin’s price below the $100,000 support level.
Bullish signals
However, the bulls are far from defeated. On-chain indicators suggest potential for a strong rebound.
First, the Stablecoin Supply Ratio (SSR) Oscillator remains near its lowest level of the current cycle, signaling abundant stablecoin liquidity relative to Bitcoin.
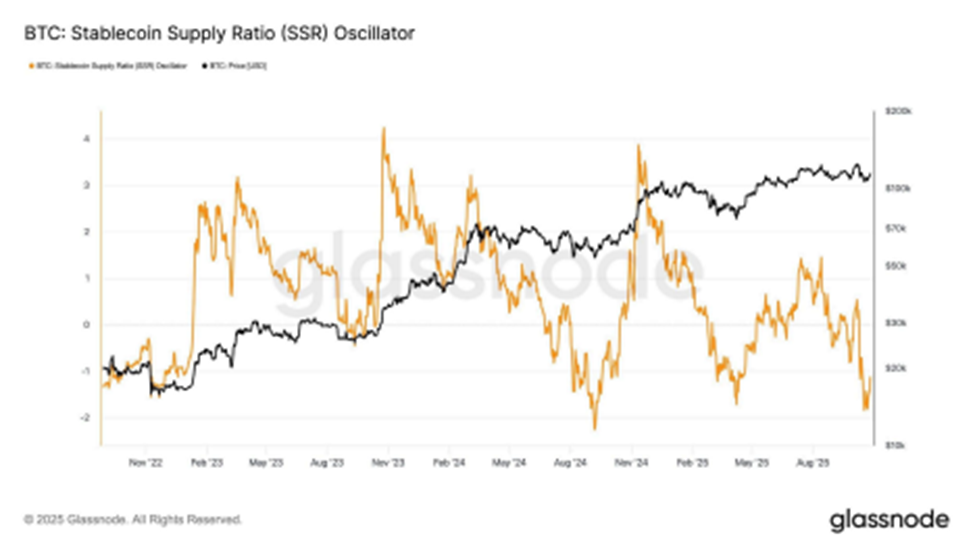
Stablecoin Supply Ratio (SSR) Oscillator. Source: Glassnode.
According to Glassnode, a low SSR means a large pool of stablecoins waiting on the sidelines — ready to be deployed once market confidence returns.
“Historically, such periods precede stronger bid-side support when market confidence returns,” Glassnode reported.
Moreover, the expansion of USDT (Tether) adds another positive signal. Data from CoinGecko shows that USDT’s market capitalization rose from $175 billion in early October to over $183 billion.
Analysis by Maartun using CryptoQuant data highlights that when USDT’s market cap grows faster than its 60-day moving average, it often correlates with short-term upward momentum in BTC.
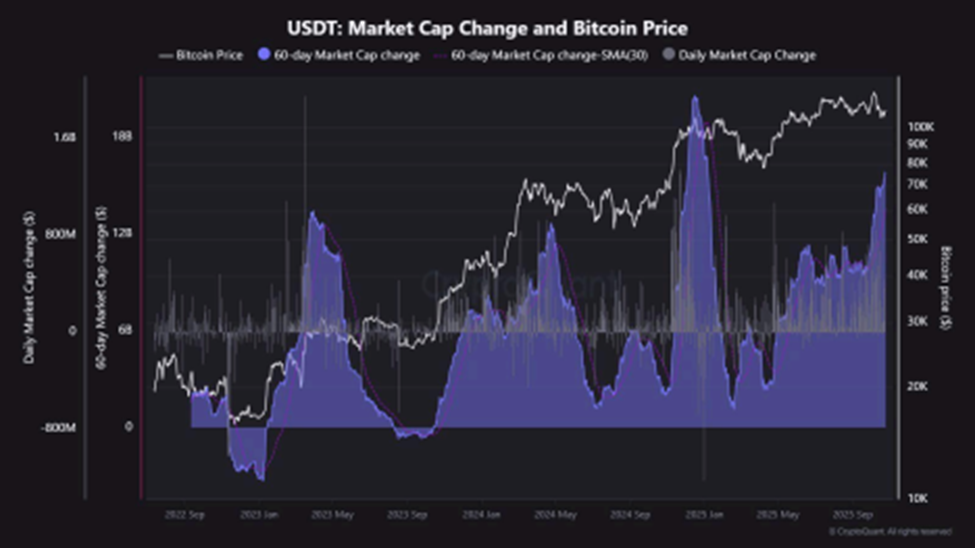
USDT Market Cap Change vs Bitcoin Price. Source: CryptoQuant.
“USDT Expansion = Fresh Capital… It’s still a positive regime,” Maartun noted.
This positive setup remains intact, suggesting new capital is entering the market but has not yet been deployed. Stablecoins like USDT act as dry powder — liquidity waiting to ignite the next rally.
The bull-versus-bear battle in October remains finely balanced. Bears hold the short-term advantage, fueled by profit-taking and weak demand. Conversely, Bulls rely on abundant stablecoin liquidity and historical cycle patterns to anticipate a reversal.
Regardless of which side prevails, October 2025 is breaking from tradition. It may become Bitcoin’s worst-performing October since 2019.
The shifting market dynamics suggest that historical patterns now carry less predictive power than before.
Author

BeInCrypto
BeInCrypto
Since 2018, BeInCrypto has grown into a leading global crypto news platform. Through our award-winning journalism and close ties with industry leaders, we deliver trusted insights into Web3, AI, and digital assets.


