Tezos Price Prediction: XTZ to rise more than 20% if critical resistance breaks
- Tezos price trades within an ascending channel, hinting at a potential surge of more than 20% if it can close above critical resistance.
- The digital asset's possibility to revisit the $3 level will become more pronounced if the above scenario plays out.

Tezos has been trading inside an ascending channel for two weeks. A successful breach of the overhead resistance could mean an easy upswing of over 20% that allows XTZ to recover lost ground.
Tezos' make or break moment
The $2.42 resistance level is crucial to Tezos' uptrend because it is a confluence of horizontal supply barriers that the price has tested more than four times in less than two months. It represents the upper boundary of an ascending channel where the digital asset has been contained within this period.
XTZ price needs buying pressure to flip this resistance wall into support. Doing so will likely be seen as a break out of the channel with a potential target of $2.90.
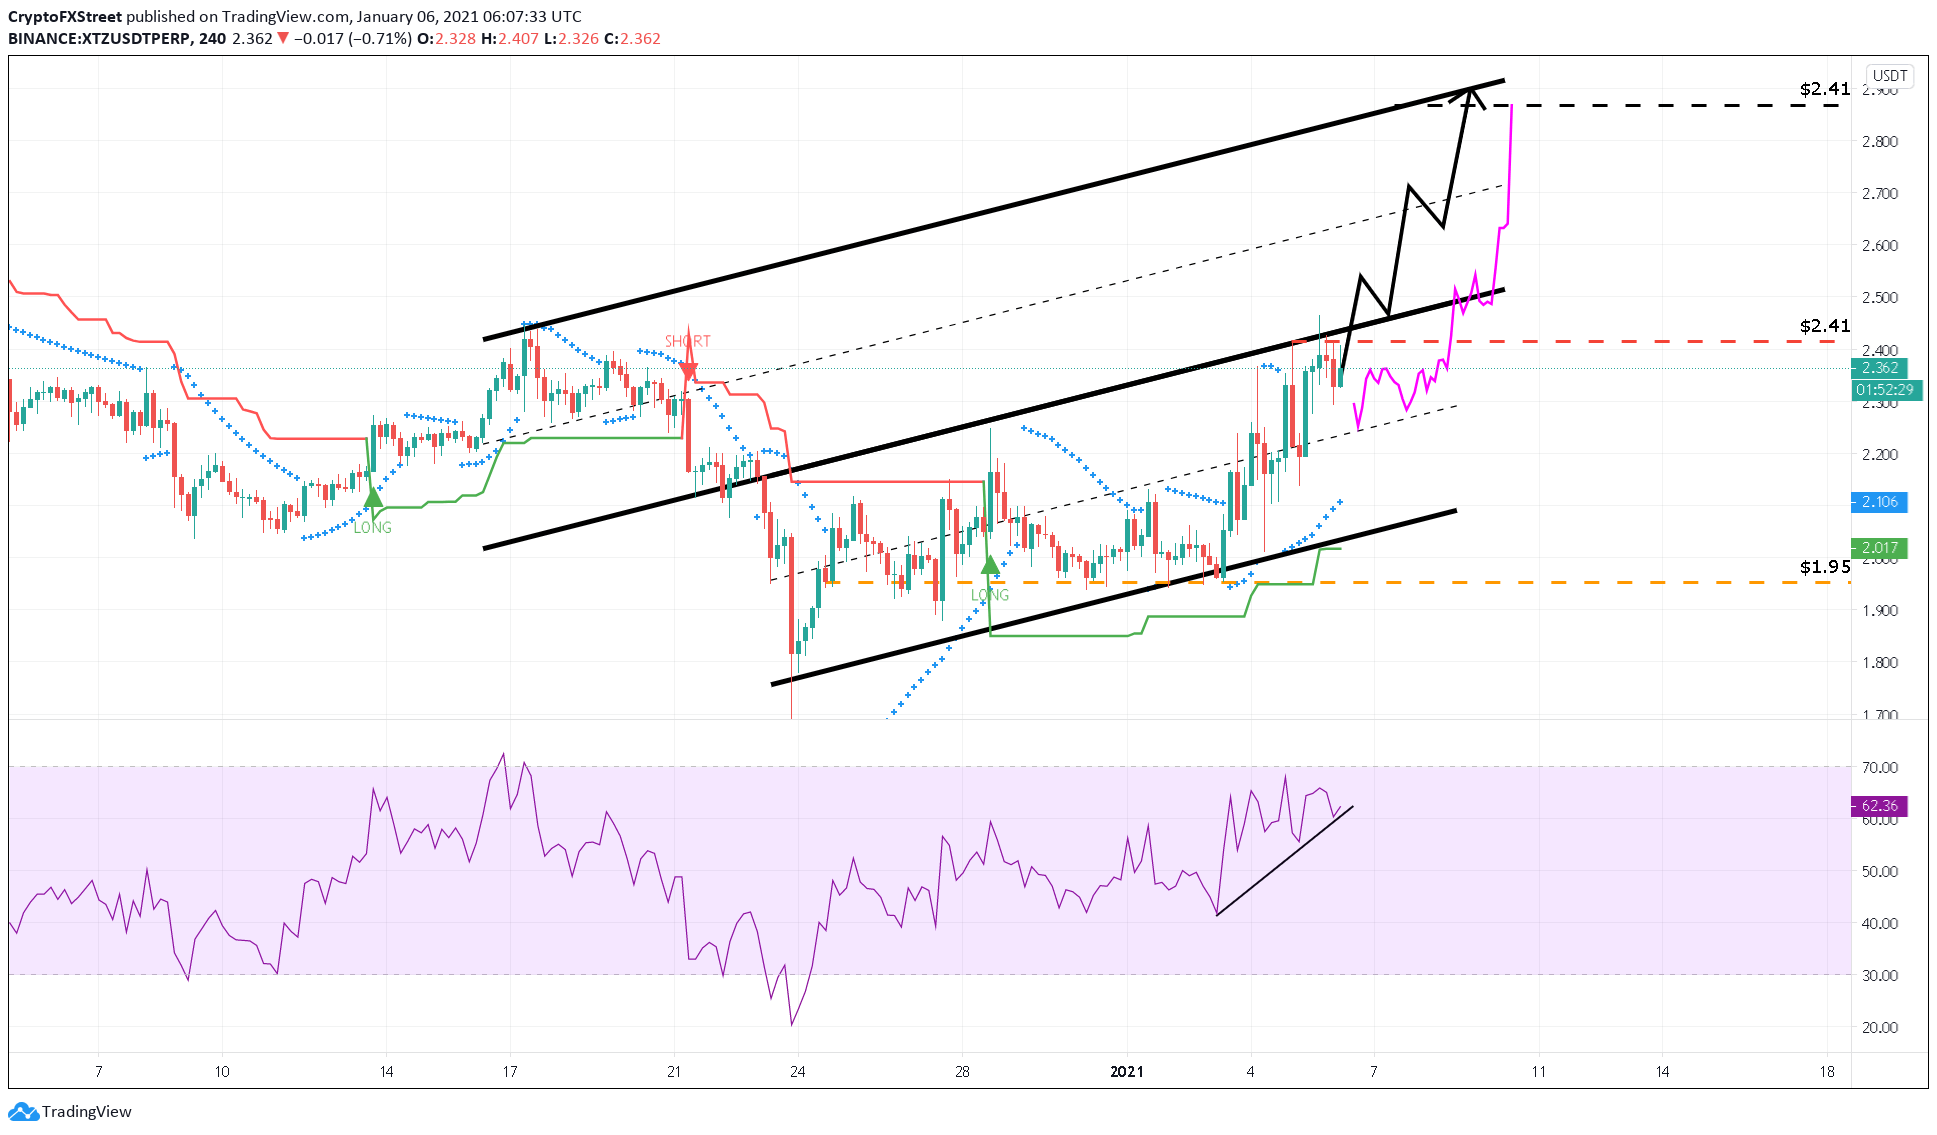
XTZ/USD 4-hour chart
The Parabolic SAR indicator adds credence to the bullish outlook. This technical index recently moved below Tezos price on the 4-hour chart, indicating that the overall trend remains bullish.
Moreover, the RSI indicator shows the formation of higher lows while it sits below overbought territory. Such an optimistic development suggests that Tezos price has more room to move higher, especially when considering that the SuperTrend flashed a buy signal in late December.
Multiple scenarios for the smart contracts token
Although Tezos does look bullish, there are different ways how the price could react to the $2.42 resistance level.
One of them suggests that Tezos price will flip the $2.42-level, bounce off the channel's upper boundary, and head higher, as shown by the chart's black path line. On the other hand, XTZ may continue to head lower only to bounce off the channel's middle line and then proceed to flip the overhead resistance level and hit its intended target of $2.90.
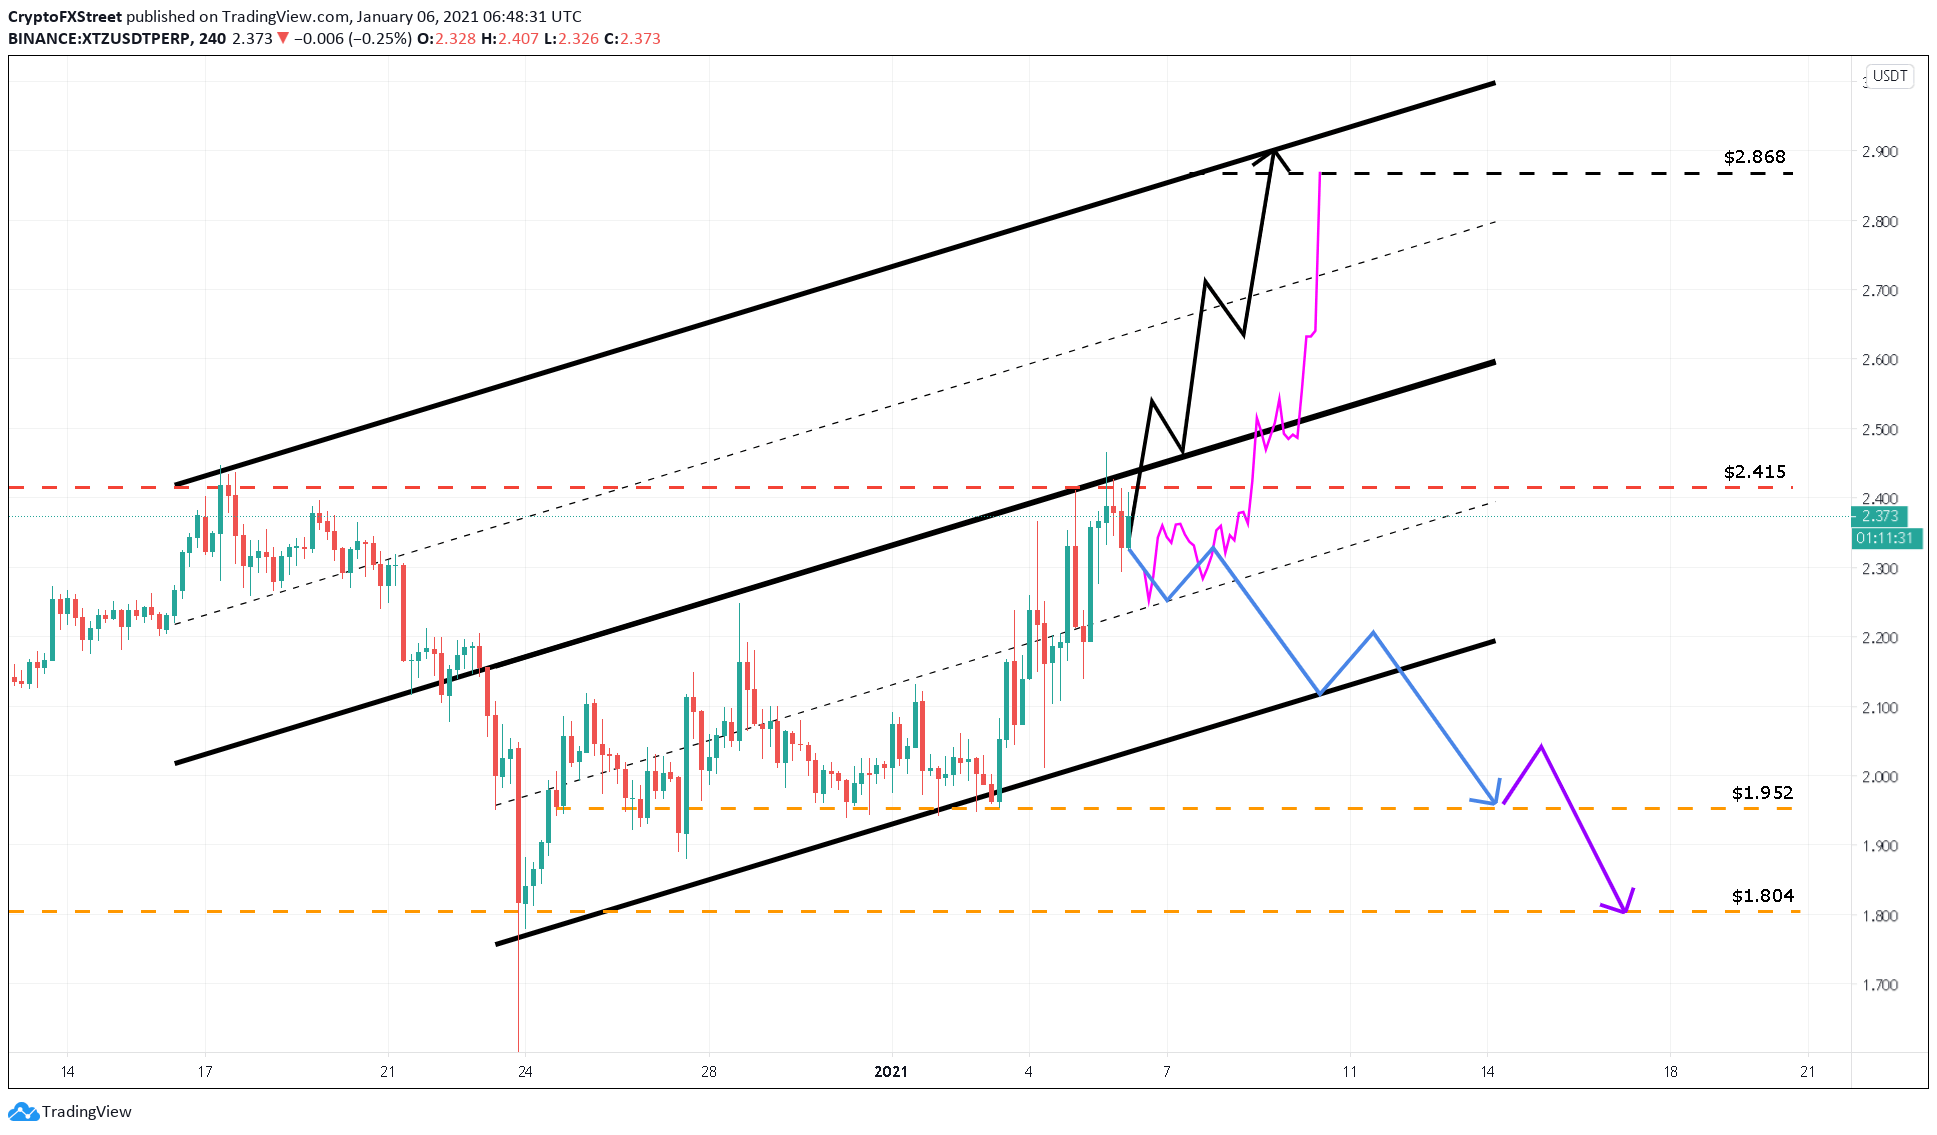
XTZ/USD 4-hour chart
While all of these scenarios seem plausible, there is a bearish scenario that might come to play. Although unlikely, it shouldn't be neglected due to the unpredictability of the cryptocurrency market. Failing to breach the resistance level at $2.42 may lead to a full-blown retracement.
In case the bearish scenario does play out, there are two fundamental levels to keep an eye out for, the $1.95-level, which will represent a 17% downswing from the current price. Further selling pressure around this price level could cause Tezos to buckle under pressure and head to $1.80. The blue and purple path lines represent these scenarios, as seen in the above chart.
Author
FXStreet Team
FXStreet
Composed of a group of economic journalists and FX experts, the FXStreet content team produces and oversees all content published on FXStreet. It provides a purely journalistic approach to the Forex market.


