Tezos Price Prediction: XTZ ready to bounce to $4.5 according to technical indicators
- XTZ is currently at $2.64 after a major crash from its 2020-high at $4.49.
- Several indicators are showing that a notable bounce could be underway in the short-term.

Tezos price was trading below $0.98 in March right after the pandemic crash. XTZ bulls managed to create a massive 300% bull rally towards $4.5 just months later experiencing a notable increase in trading volume and transactions.
XTZ/USD 3-Day chart
-637356899508266322.png)
The first thing to notice on this chart is an ascending parallel channel formed. XTZ has been trading inside this channel for almost one year now and has bounced several times from the lower trendline. XTZ is currently defending the 100-SMA at $2.38 and a crucial support level on the RSI at around 40. The crash of March also dropped the RSI level to around 39 from which XTZ bounced strongly. Similarly, the same level was defended on July 2.
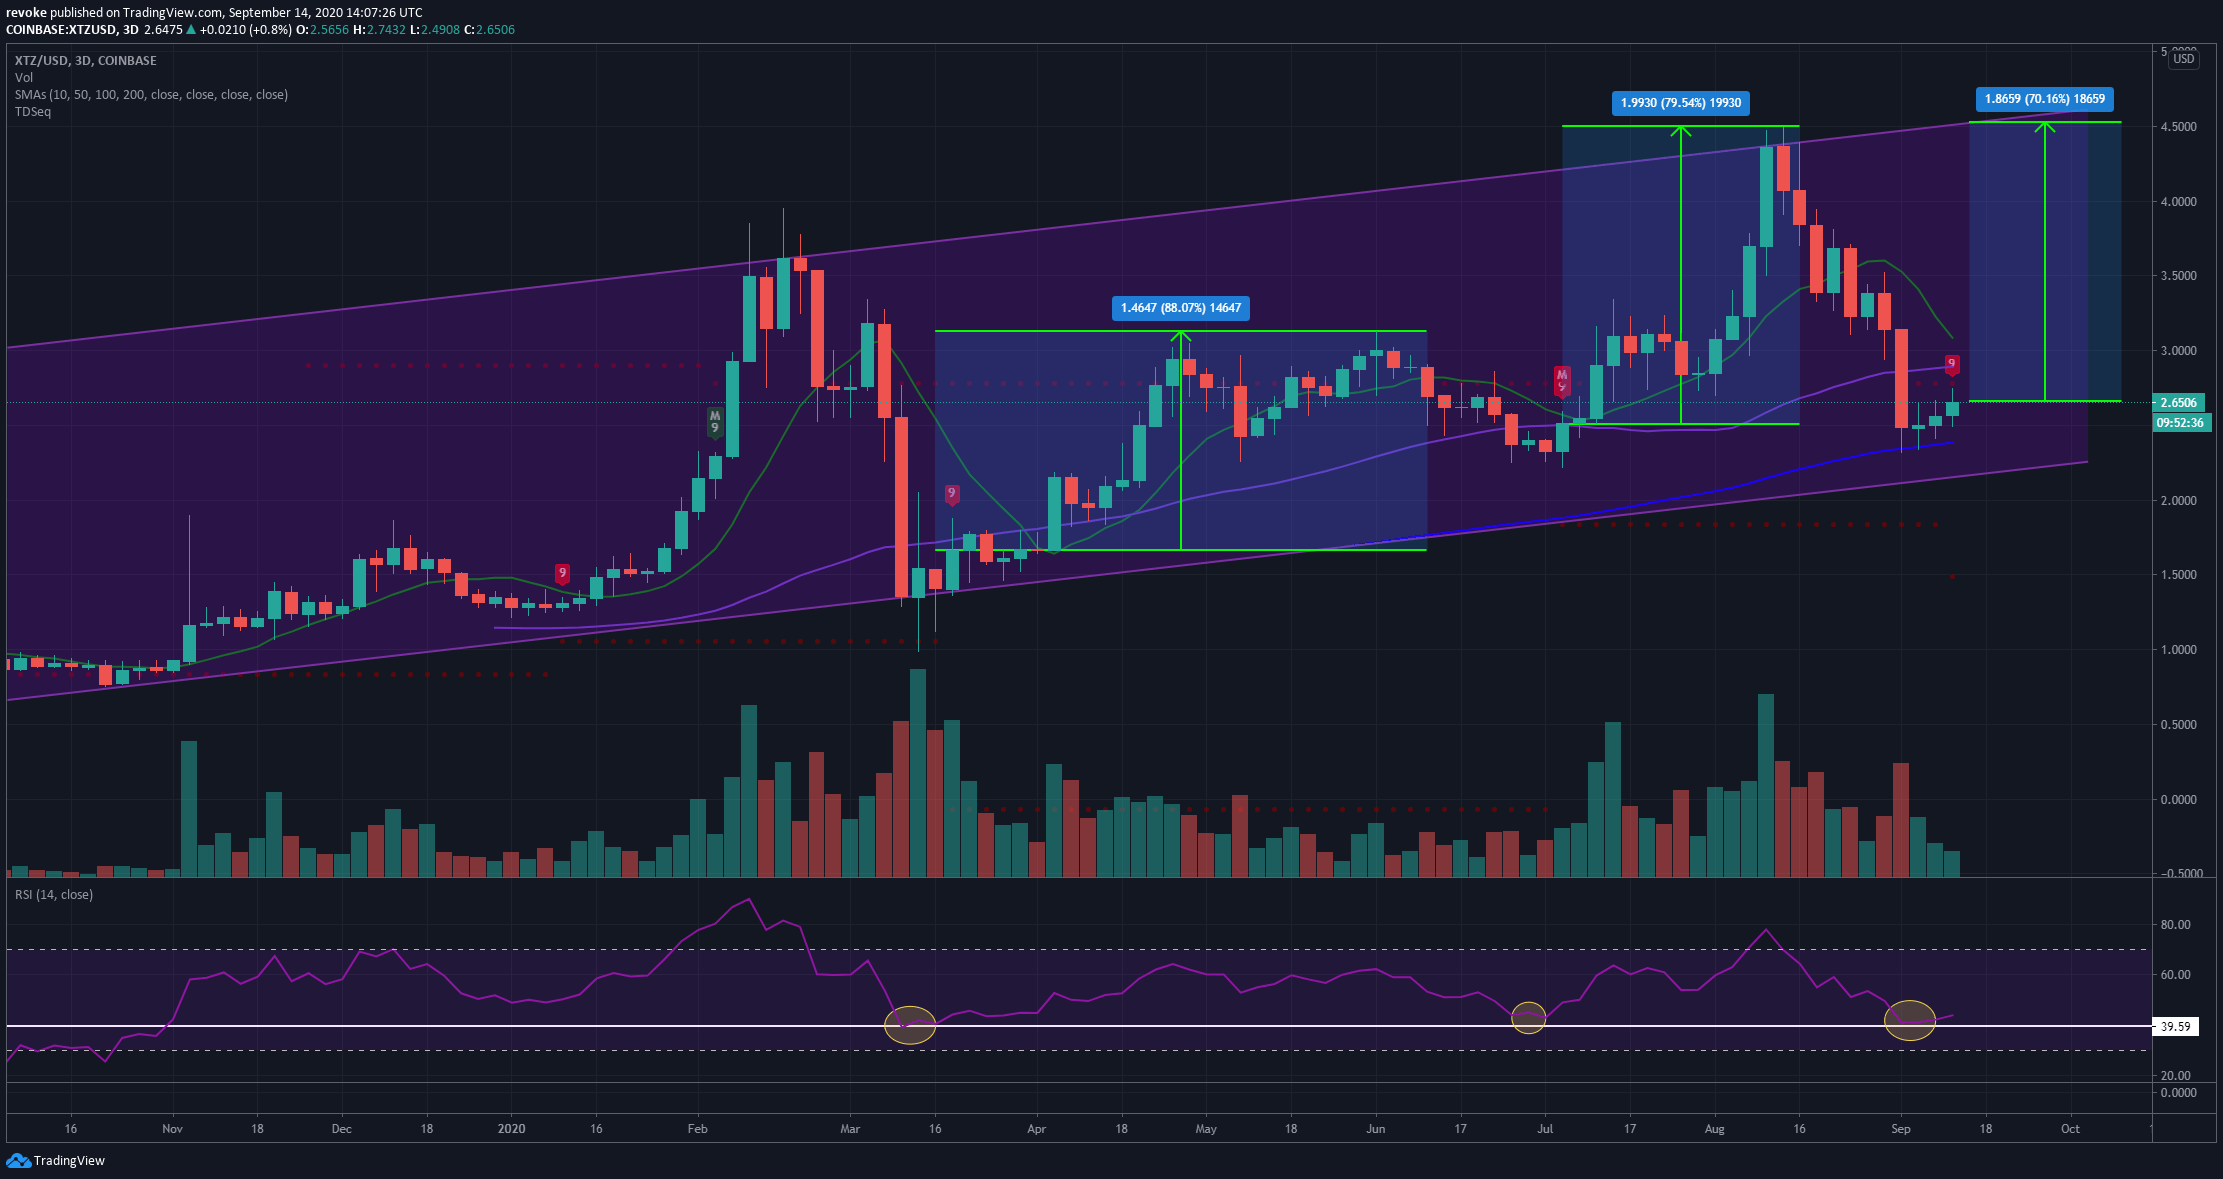
Interestingly, the RSI overextension seems to coincide with another notable buying signal from the TD sequential indicator. The first buy signal marked with a ‘9’ was created on March 19, right after the RSI touched 39. The second was July 5 and the third happened just now on September 12. The past two signals had an average of 84% return. Considering that the RSI is overextended and the TD has created another buy signal, XTZ could be aiming for $4.5 again as this would only be a 70% price increase.
XTZ/USD 4-hour chart
-637356900008470913.png)
Despite the strong buy signal, the multi-purpose platform is still facing a lot of hurdles ahead. Bulls have managed to establish several higher lows in a row, however, there is a critical resistance level at $2.64 that has created a triple top straight into a fakeout. XTZ needs to climb above this level in order to see a breakout on the daily chart.
Another significant rejection from the $2.64 resistance level could be devastating for XTZ price and bulls. While there are several higher lows created on the way up, they are not strong support levels and XTZ could easily drop to the absolute low at $2.31 again.
Author

Lorenzo Stroe
Independent Analyst
Lorenzo is an experienced Technical Analyst and Content Writer who has been working in the cryptocurrency industry since 2012. He also has a passion for trading.


