Tezos price cools off, suggesting XTZ will retrace to $5.20
- Tezos price slides for the third consecutive day, down -18% from the $8.00 value area.
- Near-term support remains -15% lower from the Thursday open.
- Divergence shows bulls are trapped, likely to trigger a sell-off.

Tezos price has made some significant gains over the past 9-weeks - gaining $281% from the July 23rd low of $2.10 to the September 14th high at $8.01. However, the current week shows increased selling pressure and significant warning signs for downside momentum.
Tezos price shows bearish weekly conditions, return to $5.20 in play
Tezos price has two massive gaps on its weekly Ichimoku chart. The first gap between Tezos price and the Kijun-Sen is excessive but within the mean parameters. However, the gap between Tezos price and the Tenkan-Sen is massive and likely demands a mean reversion move south to touch the Tenkan-Sen as support at $5.20.
The most significant development on this chart is the massive hidden bearish divergences between the weekly Ichimoku chart and the two oscillators. When comparing the peaks on the candlestick chart to the peaks on the Composite Index, there is a discrepancy: the candlestick chart has made lower highs while the Composite Index has made higher highs.
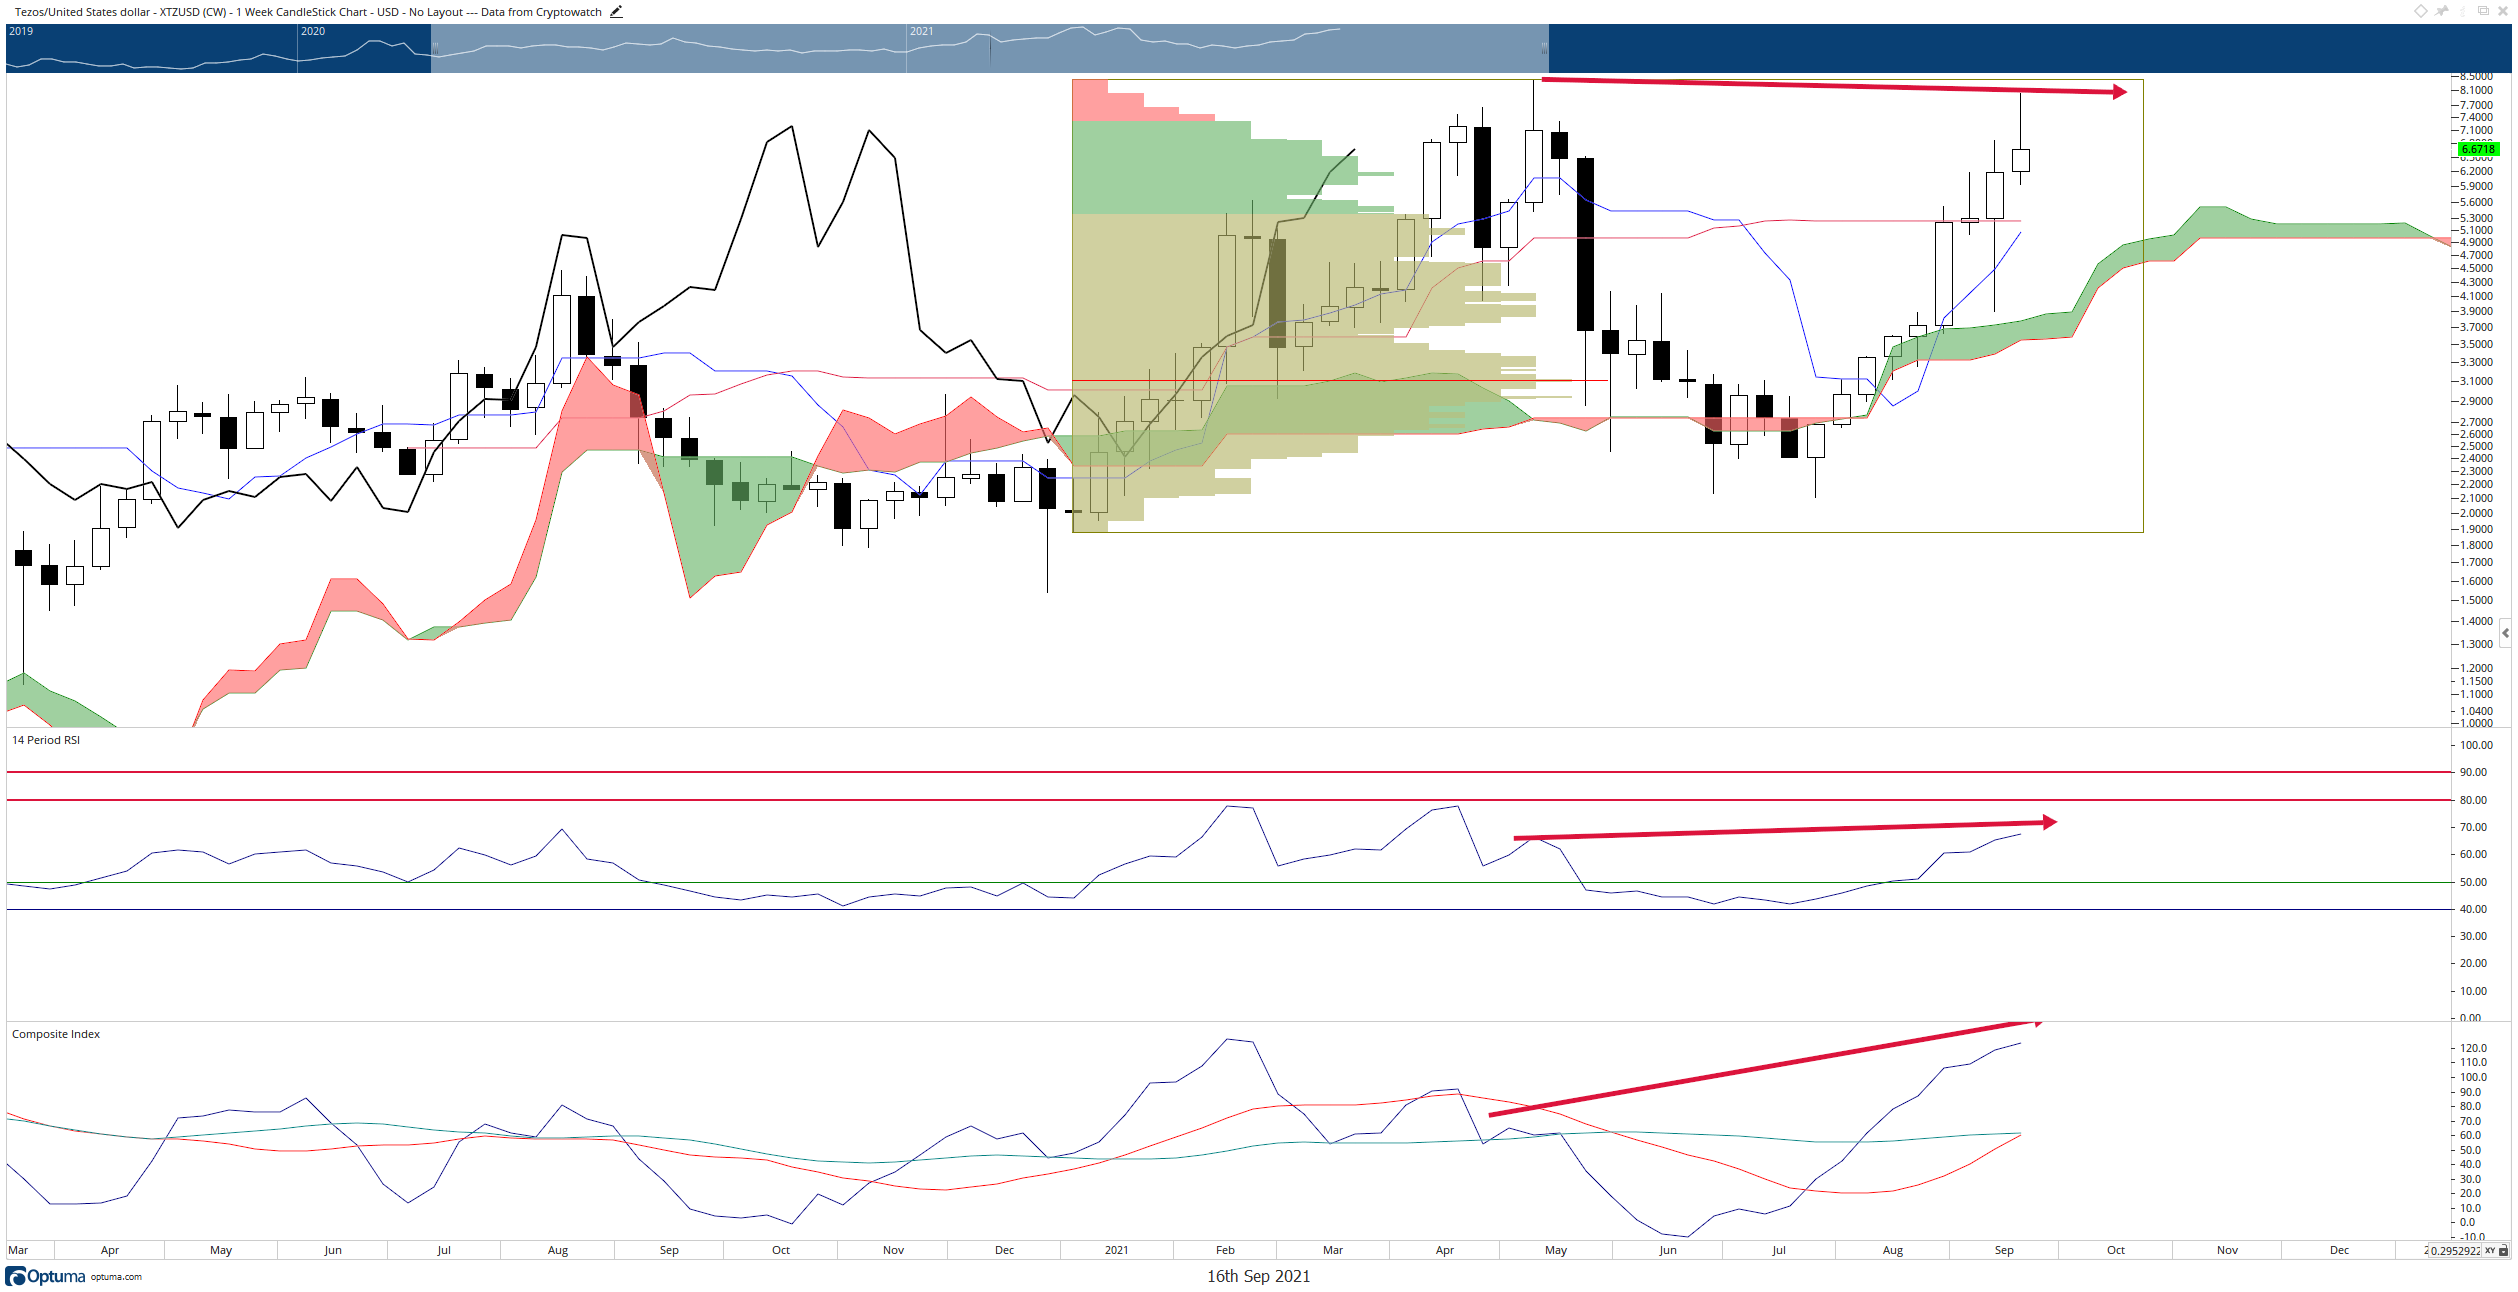
XTZ/USD Weekly Ichimoku Chart
Tezos has hidden bearish divergence on the Relative Strength Index as well – but it's where the peak of the current RSI line is that should cause concern for bulls. Don't forget: Tezos has technically not broken the bear market it initiated back in May. In a bear market, the last oversold condition in the Relative Strength Index is 65 – which is precisely where the current RSI finds itself.
Due to the massive gap between the weekly close and the Tenkan-Sen, and because of the hidden divergences present, a move to $5.20 is very likely.
The bearish scenario will be invalidated if Tezos creates new all-time highs and can maintain those new highs as support.
Author

Jonathan Morgan
Independent Analyst
Jonathan has been working as an Independent future, forex, and cryptocurrency trader and analyst for 8 years. He also has been writing for the past 5 years.


