Tezos might be setting up a bull trap, resulting in a pullback to $4.50
- Tezos price action on Friday saw a +17% spike in the late New York trade session.
- Price halted against a prior dominant uptrend angle.
- Retracement is likely as traders transition into weekend volatility and volume.

Tezos price saw a massive +17% spike at 1300 EST. From the Tuesday flash crash lows, Tezos price has gained as much as a staggering +74.1%. However, the spike NY afternoon was halted directly on a prior uptrend angle, suggesting a fakeout move higher has occurred. Additionally, the oscillators may confirm a fake top exists.
Bull trap for Tezos as traders moving into weekend trading conditions?
Tezos bulls are undoubtedly ecstatic about the most recent price moves in Tezo’s chart, especially when comparing Tezos’s price moves against the broader cryptocurrency market. However, while the reasons for the bullish momentum are many and varied, the present technical condition shows some ‘dishonesty’ in the move.
The Relative Strenght Index, Composite Index, and Optex Bands oscillators all show regular bearish divergence - a condition where price makes higher highs, but the oscillator makes lower highs. Bulls should also be aware that hidden bearish divergence exists on the weekly chart betweenTezos’s candlestick chart and the Relative Strenght Index and Composite Index.
These divergences appear as Tezos creates a new swing high with volume that will represent either the second or third single highest volume traded day for 2021. When an instrument makes new or significant swing highs/lows, major highs in volume are often a precursor to a corrective event.
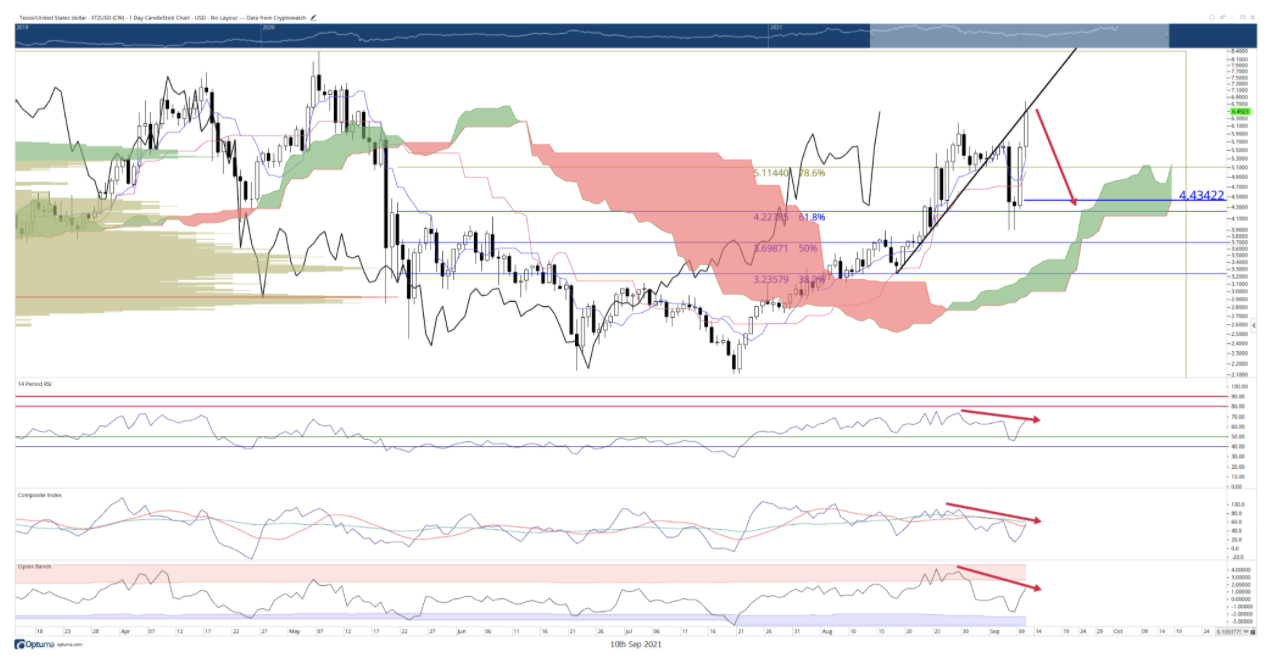
XTZ/USD Daily Chart
A pullback to the weekly Tenkan-Sen at $4.43 is a likely retracement as it shares a value area with the 61.8% Fibonacci retracement at $4.22.
Momentum is strong despite the warning signs on the daily and weekly oscillators. Bulls could probably push Tezos towards the prior all-time highs near $8.40 before facing any real selling pressure. Additionally, bears may want to wait for at least a 4-hour close below $5.86 to confirm a deeper pullback.
Author
FXStreet Team
FXStreet
Composed of a group of economic journalists and FX experts, the FXStreet content team produces and oversees all content published on FXStreet. It provides a purely journalistic approach to the Forex market.


