|

Tezos Price Analysis: XTZ may retest $2.17 before resuming a recovery to $3

  • Tezos rebounded from the technical support of $2.17.
  • The further recovery may be limited by a strong resistance area above $2.4.

Tezos (XTZ) is the 19th digital asset with a current market capitalization of $1.8 billion and an average daily trading volume of $177 million. The native token of the blockchain platform based on smart contracts technology bottomed at $1.78 on November 4 and has been gaining ground steadily ever since. XTZ stopped within a whisker of $3 on November 25 before retreating to $2.4 by the time of writing. 

The coin has gained over 3% in the past 24 hours snd 1.8% on a week-to-week basis. 

XTZ recovery stalled

As FXStreet previously reported, XTZ/USD broke below the critical support created by a lower line of a short-term ascending channel. The development worsened the short-term technical outlook and eventually resulted in XTZ/USD move towards the recent low of $2.17. 

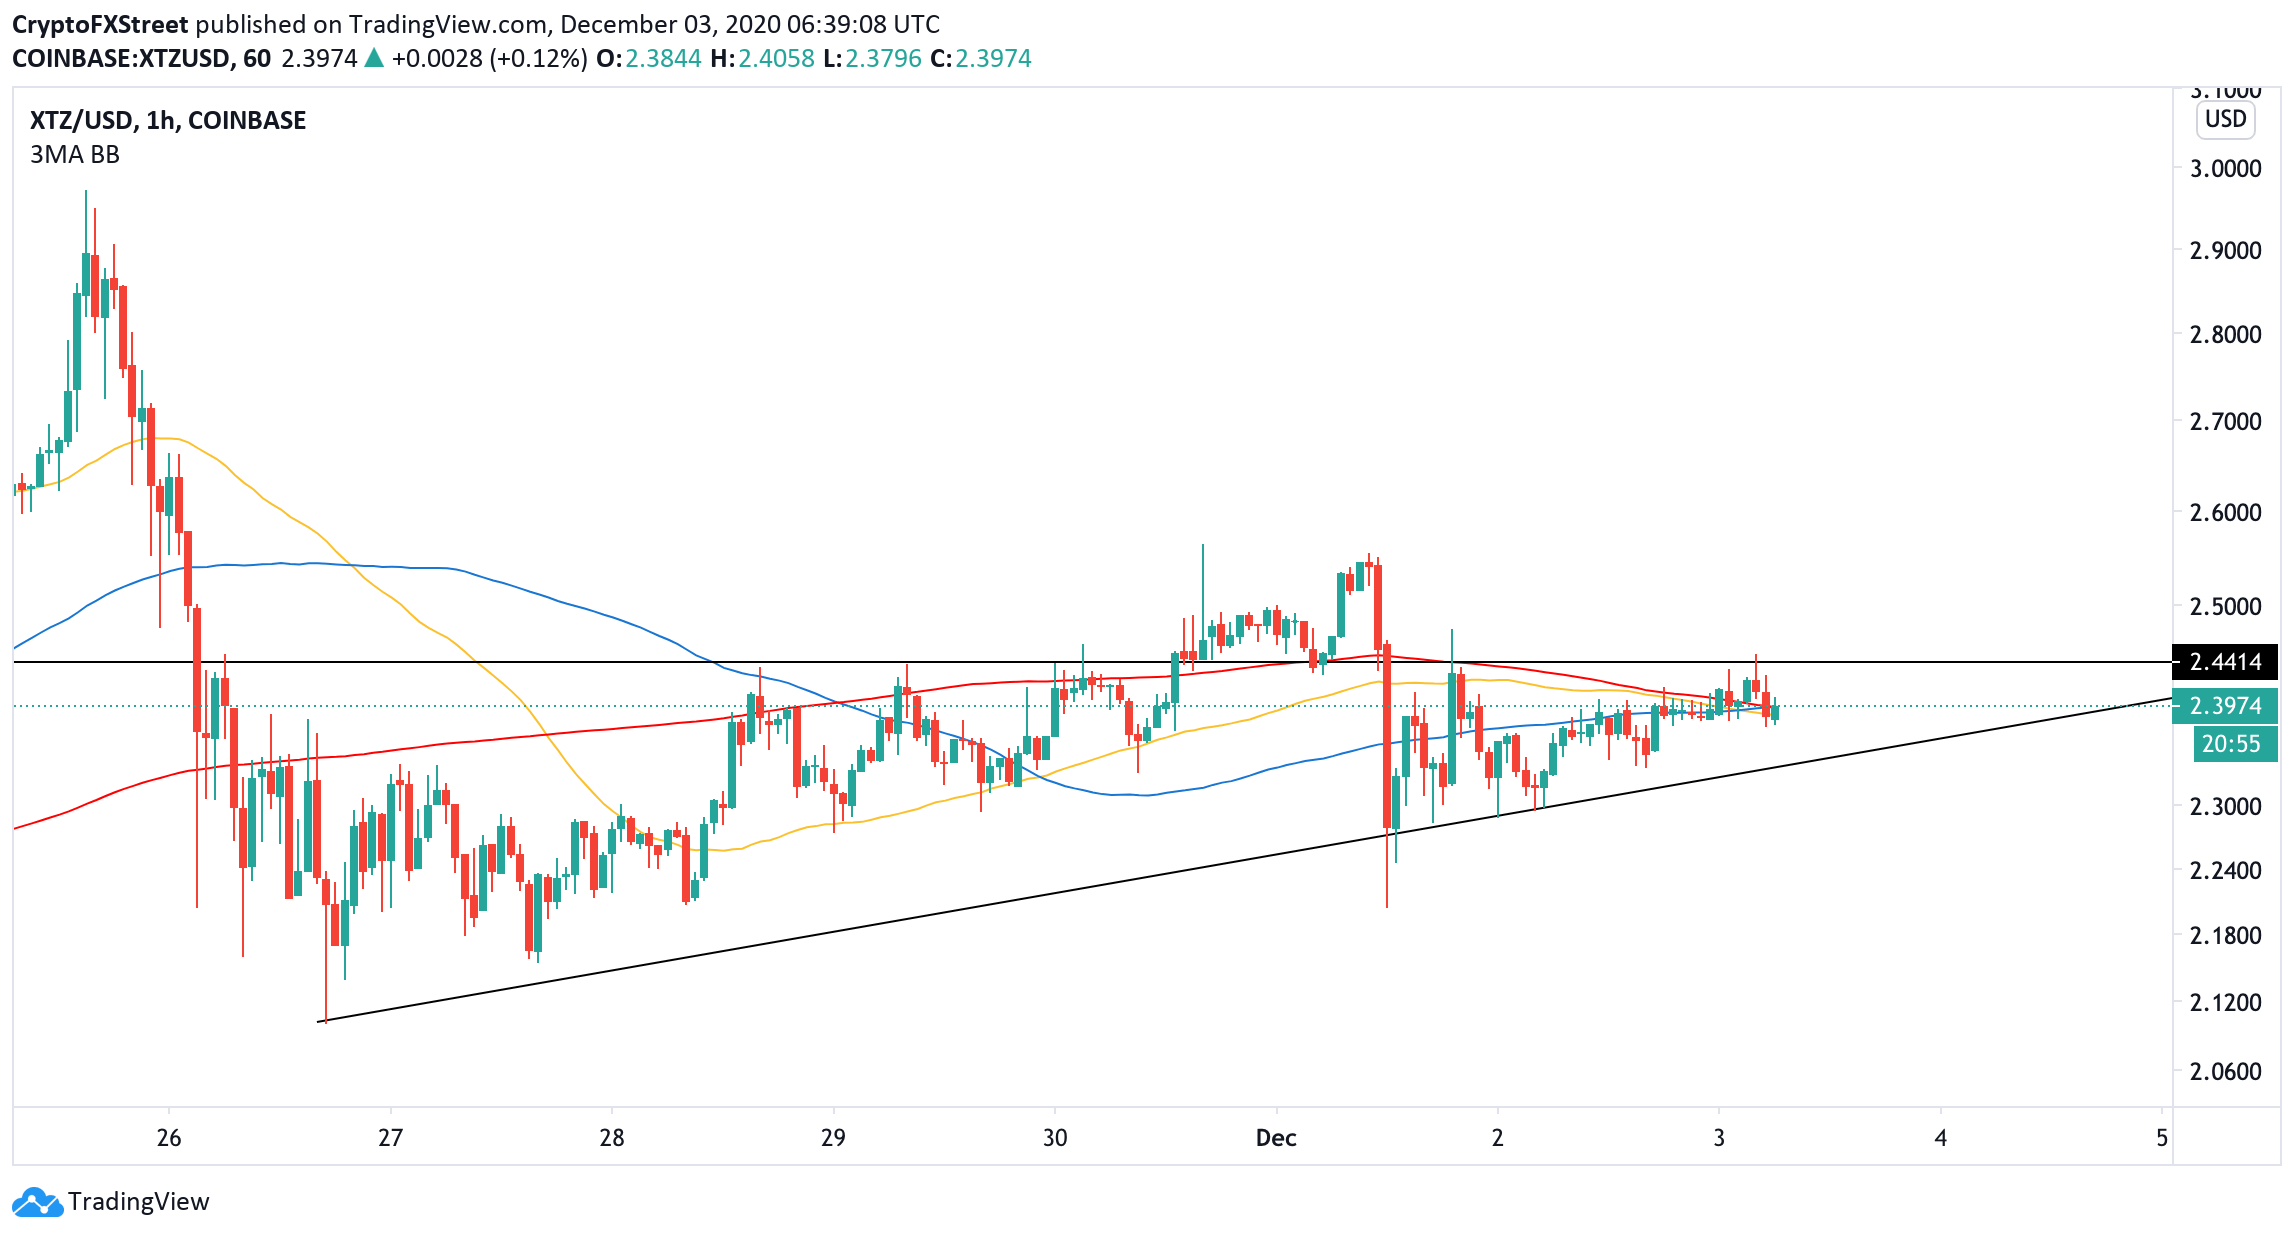
While XTZ managed to re-gain some ground, the further recovery may be limited as the price bumped into a stiff supply area of $2.4. This barrier has been verified as resistance on numerous occasions since November 28.  a sustainable move above this area is needed for the upside to gain traction with the next focus on the psychological $3.
XTZ/USD 1-hour chart

XTZ/USD 1-hour chart

On the downside, the coin is supported by the upside trendline from November 26 low at $2.3. Once it is out of the way, the sell-off will likely gain traction with the next focus on $2.17, followed by $2.
XTZ/USD daily chart

XTZ/USD daily chart

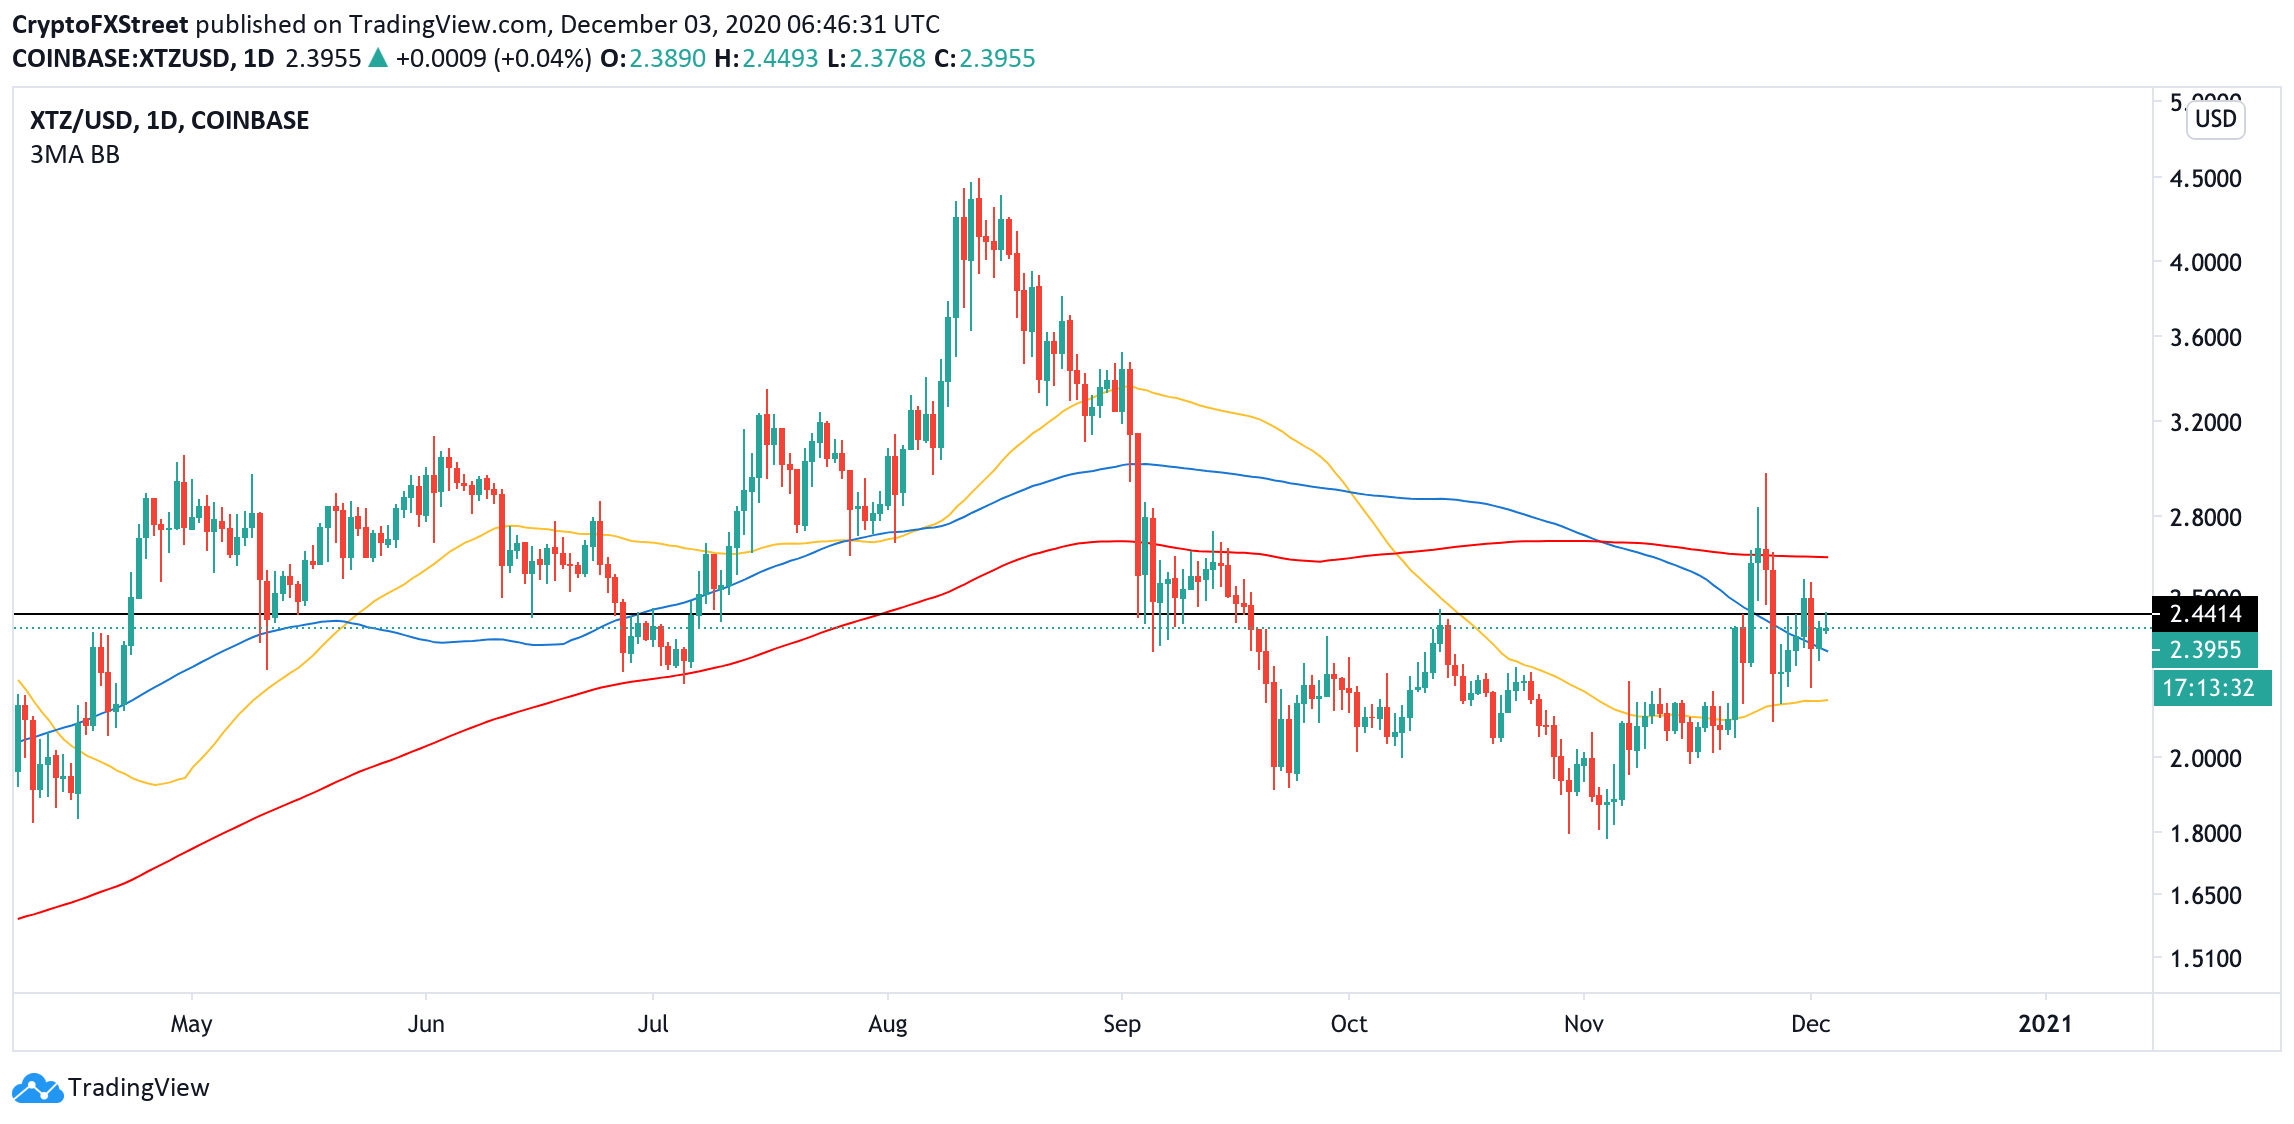
From the longer-term point of view, the above-mentioned support of $2.17 is reinforced by the daily EMA50, meaning that this area has the potential to stop the bearish assault and trigger a new upside wave with the initial target at $2.6 (daily EMA200).

Author

Tanya Abrosimova

Tanya Abrosimova

Independent Analyst

 

More from Tanya Abrosimova
Share:

Editor's Picks

XRP approaches key support as risk-off sentiment deepens
Ripple (XRP) is trading at $1.06 on Monday, maintaining its position within a broader bearish trend. The token’s technical outlook continues to deteriorate, pressured by declining retail participation. Appetite for risk assets remains lethargic, as reflected in the Fear & Greed Index, which is embedded in the Fear territory at 28.
Crypto Today: Bitcoin, Ethereum, XRP extend decline amid renewed risk-averse sentiment
The cryptocurrency market remains weak on Monday, with Bitcoin (BTC) falling toward the nearest $62,000. Ethereum (ETH) and Ripple (XRP) reflect the sell-off across altcoins, edging lower toward $1,800 and $1.05, respectively. Risk appetite remains subdued, as the Fear & Greed Index holds steady at 28, deep within Fear territory.
The Bitcoin futures yield collapse: Once over 20%, now less than Treasury notes
Once a goldmine for carry traders, Bitcoin futures have flipped, consistently underperforming plain‑vanilla U.S. Treasuries every month since February. Carry trades consistently yielded 20% or more across regulated and unregulated crypto exchanges during the 2021 bull market. The strategy involved shorting Bitcoin futures while simultaneously buying a spot exchange-traded fund (ETF).
The crypto market is moving in the opposite direction to equities
The crypto market’s market capitalisation has fallen by 1% over the past 24 hours, returning to levels last seen in mid-July. The positive momentum the market showed in the first half of last week failed to take hold. Once again, we are seeing a negative correlation with the Nasdaq 100 index, this time in the form of falling cryptocurrencies while shares rise. Could this be becoming the new norm?
Bitcoin: Bulls hold the line
Bitcoin (BTC) edges slightly lower, trading at $64,300 at the time of writing on Friday but holding firmly above a key support zone. US-listed spot Bitcoin Exchange Traded Funds (ETFs) support BTC as they continued to attract institutional flows through Thursday, pointing to the fourth consecutive week of net inflows.


