Technical Analysis: ZAP and LINK charge after ETH, how far can they run?

In recent days, Ethereum (ETH) has rallied to reclaim the $2,500 handle while targeting further gains towards the $3,000 psychological handle.
Market analysts have cited two potential bullish formation patterns which may yield more upside for ETH. This includes the double bottom pattern formed near the $1,700 range twice and then, a falling wedge formation.
Oracle coins powering Ethereum’s smart contracts, such as Chainlink (LINK), and Zap (ZAP), have also been posting some gains, and both have plenty more upside potential. Just like Ethereum, ZAP looks set for a strong rally amid a technical formation known as a “falling wedge” developing on its chart.
A falling wedge pattern forms when the price trades lower inside a range that begins wide but contracts as price declines. The trend lines are drawn above the highs and below the lows on the chart pattern, and they converge as the price slide loses momentum and buyers step in to slow the rate of decline. Before the lines converge, the price may breakout above the upper trend line leading to a bullish reversal
ZAP Technical Analysis: Bounces on the bottom line with a solid footing past $0.04
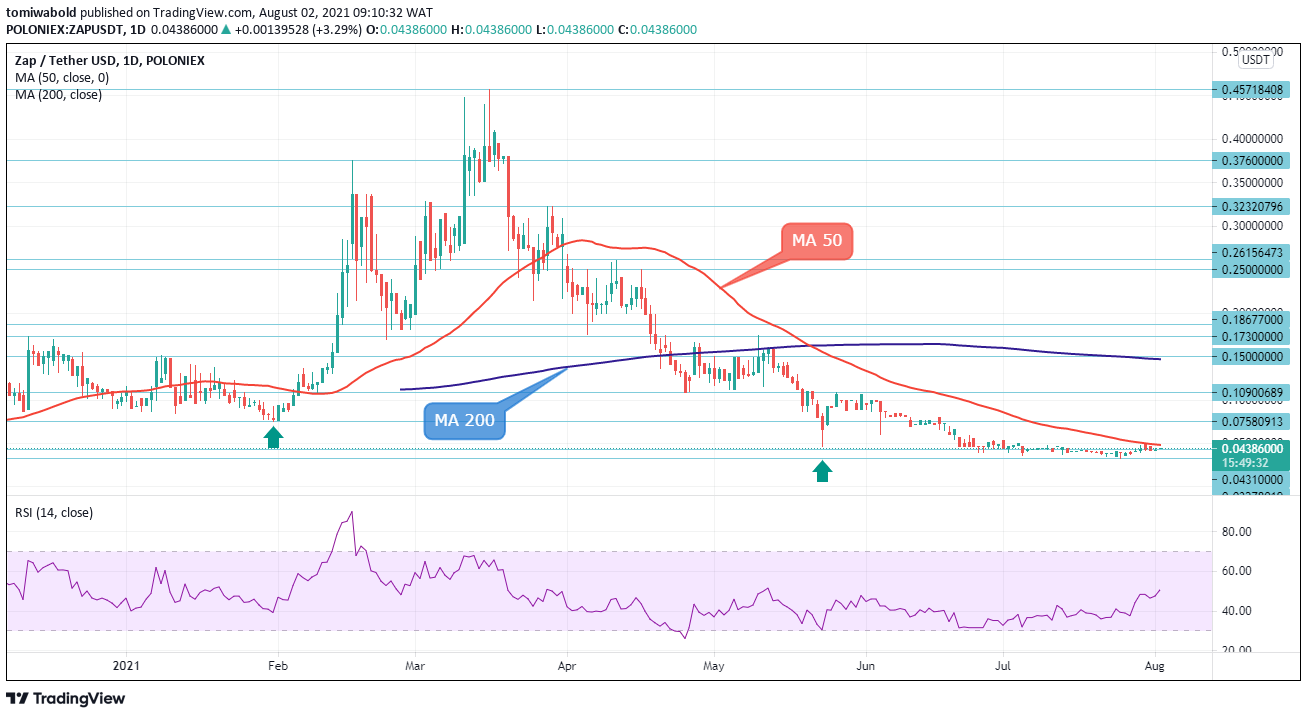
ZAP/USD Daily Chart
ZAP/USD has so far avoided breaching its bottom line as the stage sets for a strong performance in August. Major technical indicators point to continued strength from recently reached lows of $0.0327. Towards the moving average (MA 50) seen on the daily chart, price pressures are likely to increase in days and weeks, likely leading to an upward shift in bullish expectations to the $0.10 mark.
The crypto market’s continued downturn in July dragged ZAP/USD lower, however, demand for this token persists and a solid foundation for a sudden spike higher has been laid. The relative strength index is on an upward path past its midline 50 as ZAP displays a price floor above $0.0327, trading higher to flip the critical MA 50 anytime soon. Overall, the outlook remains bright.
LINK Technical Analysis: Bulls pause to take profits ahead of $24.00
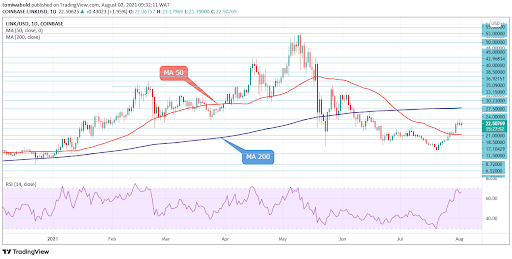
LINK/USD Daily Chart
Chainlink (LINK) eased from highs of $23.92 on August 1st, as bulls ran out of steam following the advance in the prior week. Today’s close will be significant, with Sunday's red daily candle adding to negative signals. On the downside, the support of the current consolidation area at $21.39 could serve as an immediate pivot point.
While the MA 50 could offer the main support at $18.71 to hold dips, if the bearish scenario unfolds, the LINK/USD pair may plunge to meet fresh demand at $13.45.
Alternatively, should the $21.39 base stand firm, LINK’s price could push for a close above $23.92 to reach the MA 200 at $27.74.
ETH Price Analysis: Recoups losses as fresh support builds near $2,500
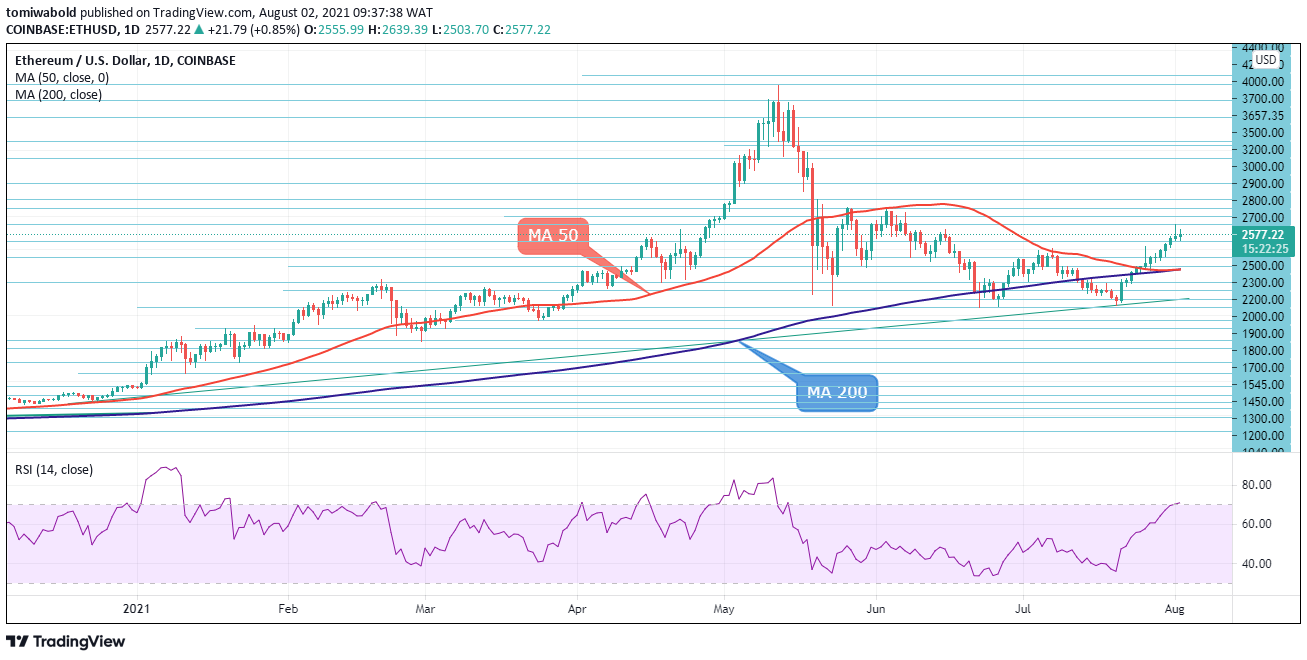
ETH/USD Daily Chart
ETH/USD is recovering from the prior day's profit-takings. The technical pullback found bids at $2,503 as fresh support builds around this region. The rising RSI is yet to confirm overbought conditions past 70 while the bullish mood remains intact as long as ETH’s price is above the demand zone near $1,720 from the daily chart.
If today closes in the green, Ethereum will mark its 12th consecutive day winning streak. Consolidation may run its course briefly as short-term bulls rebuild their stakes. Those armed with patience may wait for a clean break above the peak at $2,700. Potential bullish formation patterns could further enhance trend optimism while the crossover of the MA 50 and 200 awaits completion.
Author

Tomiwabold Olajide
FX Instructor
Tomiwabold is a forex trader and cryptocurrency analyst. A technical analyst, as well as an experienced fund manager, he has also co-authored several books on Forex trading.


