- Synthetix Network Token rebounded from support at $3.3 to deal with an uphill battle at $5.
- The bullish technical picture targets $6, while the strengthening on-chain metrics could support the breakout.
Synthetix Network Token (SNX) rallied 137% from the lows traded in November at $2.5 but hit a high at $6 last week. The market instability last week saw the token dive to $3.3 before the ongoing recovery came into the picture. A break past the resistance at $5 might elevate SNX beyond $6.
Synthetix Network Token bounces off critical support
At the time of writing, Synthetix is trading at $4.8 amid the growing bullish grip. The recovery has been validated following a spike above the 50 Simple Moving Average, 100 SMA and the 200 SMA.
If Synthetix closes the day above the confluence formed by the 100 SMA and the 200 SMA, the spike to $6 might begin to materialize. Another bullish indicator would be the golden cross pattern if the 100 SMA crosses above the 200 SMA in the same 12-hour timeframe. Similarly, the Relative Strength Index is moving towards the overbought region, emphasizing the bullish grip.
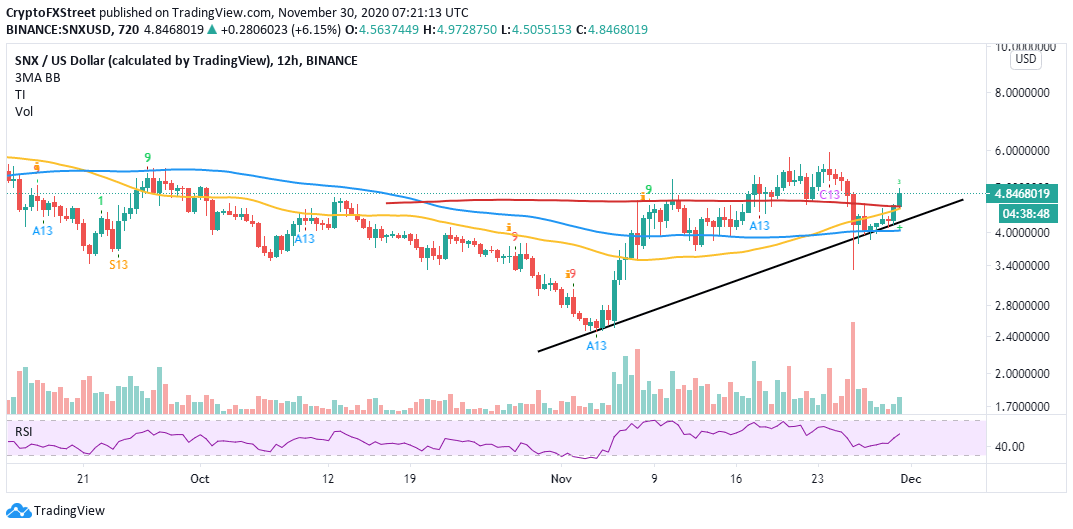
SNX/USD price chart
On-chain metrics validate the ongoing uptrend
Santiment’s holder distribution chart shows that whales have begun to buy more SNX in anticipation of near term price growth. For instance, addresses holding between 100,000 and 1 million SNX increased by two from 114 on November 27 to 116 on November 30.
On the other hand, addresses containing between 10,000 and 100,000 coins rose from 623 on November 27 to 660 on November 30, representing a 5.6% increase. In other words, the volume moved by the whales seems strong enough to keep Synthetix in the uptrend.
Synthetix Network Token holder distribution chart
The active addresses metric, which measures network activity in 24-hour periods, is beginning to look positive. Usually, growth in this metric tends to lead the price upwards. Therefore, if the spike continues, there is a likelihood of Synthetix continuing with the anticipated uptrend.
Active addresses chart
On the downside, it is worth mentioning that the bullish outlook will be invalidated if the price corrects below the 100 SMA and the 200 SMA confluence support. Besides, closing the day under the immediate hurdle at 45 might encouraged more sellers to join the market in an attempt to pull SNX to lower levels targeting $3.3 (last week’s support).
Information on these pages contains forward-looking statements that involve risks and uncertainties. Markets and instruments profiled on this page are for informational purposes only and should not in any way come across as a recommendation to buy or sell in these assets. You should do your own thorough research before making any investment decisions. FXStreet does not in any way guarantee that this information is free from mistakes, errors, or material misstatements. It also does not guarantee that this information is of a timely nature. Investing in Open Markets involves a great deal of risk, including the loss of all or a portion of your investment, as well as emotional distress. All risks, losses and costs associated with investing, including total loss of principal, are your responsibility. The views and opinions expressed in this article are those of the authors and do not necessarily reflect the official policy or position of FXStreet nor its advertisers. The author will not be held responsible for information that is found at the end of links posted on this page.
If not otherwise explicitly mentioned in the body of the article, at the time of writing, the author has no position in any stock mentioned in this article and no business relationship with any company mentioned. The author has not received compensation for writing this article, other than from FXStreet.
FXStreet and the author do not provide personalized recommendations. The author makes no representations as to the accuracy, completeness, or suitability of this information. FXStreet and the author will not be liable for any errors, omissions or any losses, injuries or damages arising from this information and its display or use. Errors and omissions excepted.
The author and FXStreet are not registered investment advisors and nothing in this article is intended to be investment advice.
Recommended Content
Editors’ Picks
Prisma price tanks 25% after nearly $9 million exploit
Prisma Finance (PRISMA) is being exploited, and the attacker has so far pulled $9 million in Ethereum from the borrowing protocol. Prisma asked vault owners to take the necessary steps to protect funds from the ongoing attack in an official tweet on X.
Meme coins gain traction after SEC’s partial win in Coinbase lawsuit: DOGE, SHIB, BRETT, POPCAT, BODEN
US SEC pocketed a partial win in its lawsuit against Coinbase, ushering a correction in crypto prices on Thursday. Despite the broad pullback, prices of meme coins like Dogecoin, Shiba Inu and Solana-based BRETT, POPCAT and BODEN increased.
Ondo moves $95 million worth of OUSG assets to BUIDL as tokenized fund attracts $245 million since debut
Ondo Finance (ONDO) announced on Wednesday that it's shifting about $95 million worth of its OUSG's underlying assets to the BlackRock USD Institutional Digital Liquidity Fund (BUIDL).
XRP price stuck below $0.65 resistance, Ripple lawsuit could suffer from Coinbase defeat
XRP price falls slightly to $0.61 on Thursday after its landmark programmatic sales ruling in July, which gave Ripple a partial victory against the US SEC, failed to reverberate in a similar legal battle between the regulator and crypto exchange Coinbase.
Bitcoin: BTC may have recovered, but is it out of the woods?
Bitcoin’s (BTC) upward momentum has shown a significant decline for the past two weeks or so. This development led to a bearish signal on the weekly and an uncertain outlook on the monthly.