SushiSwap Price Prediction: SUSHI sets out for a colossal 36% breakout
- SushiSwap has broken out of an ascending triangle pattern and is ready for a spike to $27.
- The MACD indicator has confirmed the upswing following the cross above the signal line.
- SUSHI will abandon the massive rally if the price stalls under $22, putting pressure on the x-axis.

SushiSwap is trading above $20 after breaking out of a key technical pattern. The period of consolidation in the last couple of weeks has been instrumental to the ongoing upswing. Thus, bulls seem energized for another run-up to new all-time highs.
SushiSwap begins its 36% rally to new record highs
The cryptocurrency market is relatively in the red at the time of writing. SushiSwap is among the cryptoassets recording double-digit gains. The 4-hour chart brings to light an ascending triangle pattern, giving way to the ongoing bullish momentum.
An ascending triangle is a bullish continuation pattern that generally forms within a generally up-trending market. It is formed by two trendlines where one links a series of higher lows and connects the relatively equal peaks. The pattern illustrates a period of consolidation before the uptrend continues.
It is worth mentioning that triangle patterns have exact targets following breakouts at the x-axis and are measure from the highest to lowest points of the pattern. The upswing tends to be rapid and must be accurately timed. For instance, SushiSwap is looking forward to a 36% upswing to a new record high.
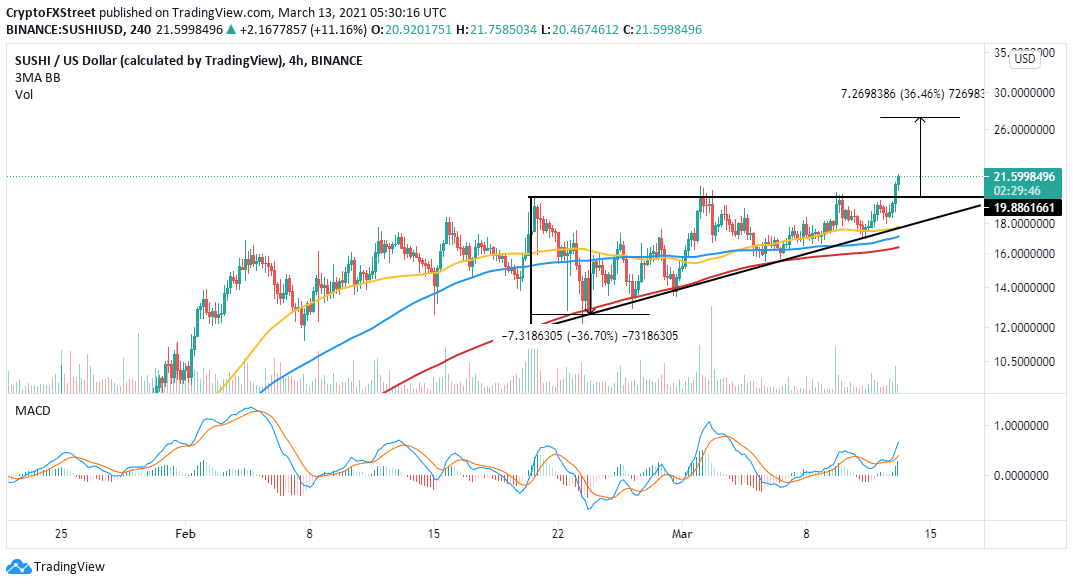
SUSHI/USD 4-hour chart
The uptrend has been validated by the Moving Average Convergence (MACD) cross above the signal line. Note that the MACD sends out a bullish signal crossing above the signal line, thereby validating the uptrend.
Looking at the other side of the fence
SushiSwap has hit a barrier at $22 after breaking out of an ascending triangle pattern. Price action above past this zone is key to continuing with the bullish leg toward $27. However, a correction may come into the picture. Support at the x-axis must remain intact; otherwise, broken losses may extend to the 50 Simple Moving Average on the 4-hour chart.
Author

John Isige
FXStreet
John Isige is a seasoned cryptocurrency journalist and markets analyst committed to delivering high-quality, actionable insights tailored to traders, investors, and crypto enthusiasts. He enjoys deep dives into emerging Web3 tren


