Stellar (XLM) Q4 report hints at 120% gains as XRP price tops $2.50
- XRP and XLM prices showed resilience amid intense market volatility on Tuesday, holding the $2.50 and $0.30 levels respectively.
- Stellar’s Q4 Report: XLM chain hosts $458M in tokenized assets as the team pushes for dominance in Real World Assets (RWA).
- XLM’s Upside Potential: Strong correlation with XRP and technical indicators suggest XLM could surge if $0.30 support remains solid.

Ripple (XRP) and Stellar (XLM) prices show resilience amid intense market volatility on Tuesday. The Q4 2024 report issued by the Stellar team reveals critical data points that could spark considerable long-term XLM gains.
Stellar Foundation Q4 2024 Performance Posts Optimistic Outlook
Ripple (XRP) and Stellar (XLM) held firm amid Tuesday’s intense volatility, fueled by fiscal and macroeconomic risks posed by the Trump adminstration receent tariffs policies.
Notably, XLM and XRP have exhibited strong price correlation since inception, largely due to their shared origins—as Stellar’s founder, Jed McCaleb, also co-founded XRP.
While the broader crypto market experienced sharp swings over renewed trade war concerns, Stellar’s Q4 2024 report, unveiled at its media event on February 4, highlighted key fundamentals that could drive long-term growth.
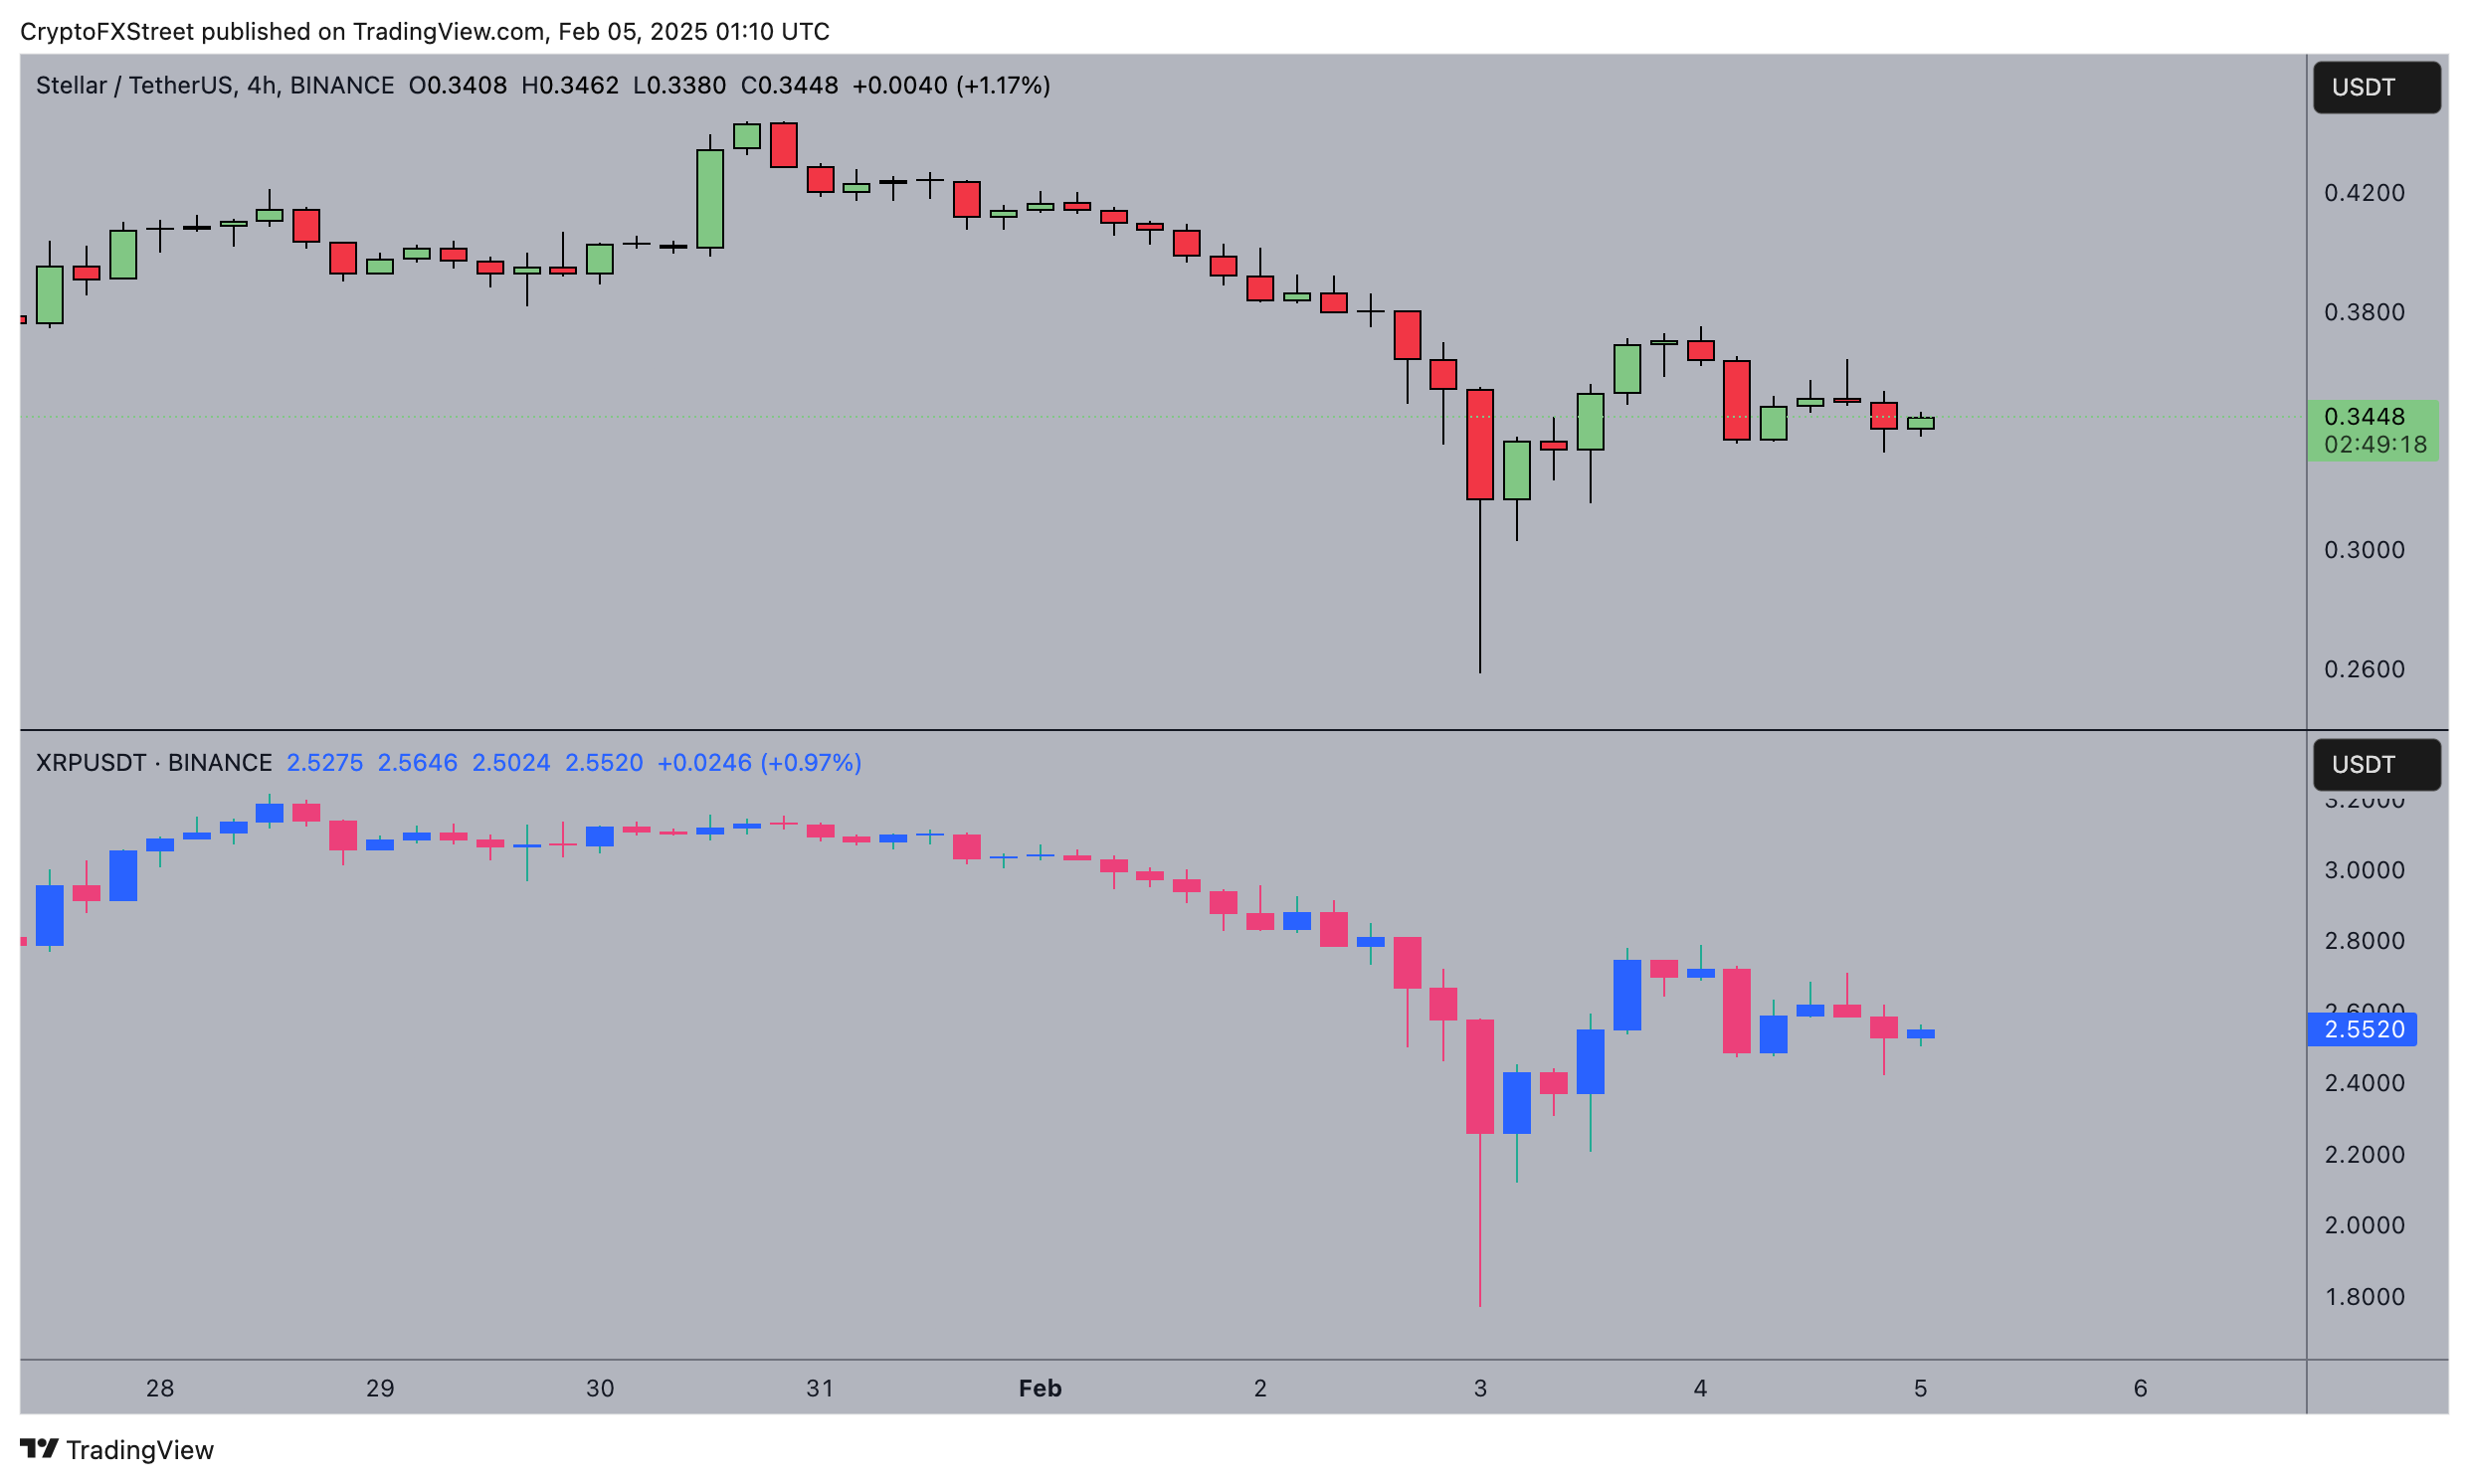
Stellar (XLM) vs Ripple (XRP) 4-hourly chart, Feb 5, 2025 | Source: TradingView
During the Stellar Development Foundation’s Quarter in Review: Q4 2024 event, the team highlighted rapid growth in key network metrics.
The report revealed that Stellar now boasts 9 million total addresses, reinforcing its expanding adoption.
The network also processed a staggering $4.1 billion in RWA payments volume in Q4 alone, underscoring its increasing relevance in tokenized real-world assets.
However, due to the intense market focus on US trade policies, the report initially flew under the radar.
On Tuesday, President Trump’s decision to pause tariffs on Mexico and Canada briefly fueled a 10% rally in XRP and XLM during US morning trading.
However, Beijing’s swift response—announcing retaliatory tariffs against key US imports—led to renewed market uncertainty, causing a sharp downturn in commodities and risk assets.
Despite this macro-driven volatility, key data points in Stellar’s Q4 report highlight a long-term bullish outlook for XLM price.
-
1. Stellar ranks 3rd in Total transactions processed
Stellar emerged as the third-largest blockchain by total transactions processed in Q4, showcasing its growing network activity.
Transaction volume is a critical indicator of network health, as higher usage often translates into increased demand for the native asset, XLM.
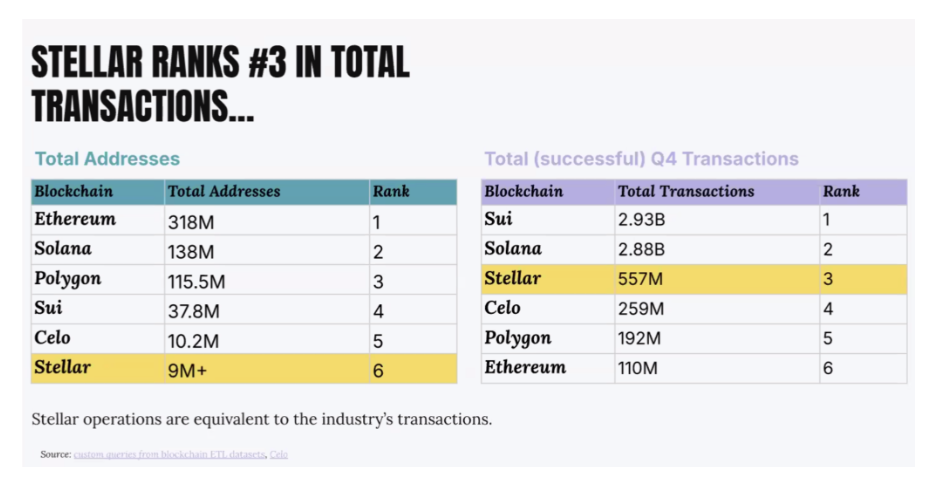
XLM Total Transactions | Source: Stellar Q4 Report
A comparative analysis of Stellar’s Q4 transaction count against rival Layer-1 blockchains highlights its competitive position.
While Ethereum (ETH) continues to dominate with smart contract executions, with 318 million addresse, Stellar’s high transaction throughput, 508 total active nodes, and an average ledger close time of 5.93 seconds give it a significant efficiency advantage.
This has helped Stellar attract 9 million active addresses, placing it 5th among the select blockchain networks/
From a price-action perspective, Stellar’s consistent growth in transaction volume sets a strong foundation for future price appreciation.
If the trend continues, XLM could see increasing institutional and retail adoption, pushing prices higher.
-
2. Stellar enters top 4 in RWA market dominance with $458M in tokenized assets
The Q4 report also confirmed that Stellar currently ranks #4 in total RWA market capitalization, with $458 million worth of tokenized assets on its blockchain.
The rapid expansion of the RWA sector has been a key driver for institutional crypto adoption, as projects seek to tokenize traditional assets such as bonds, equities, and real estate.
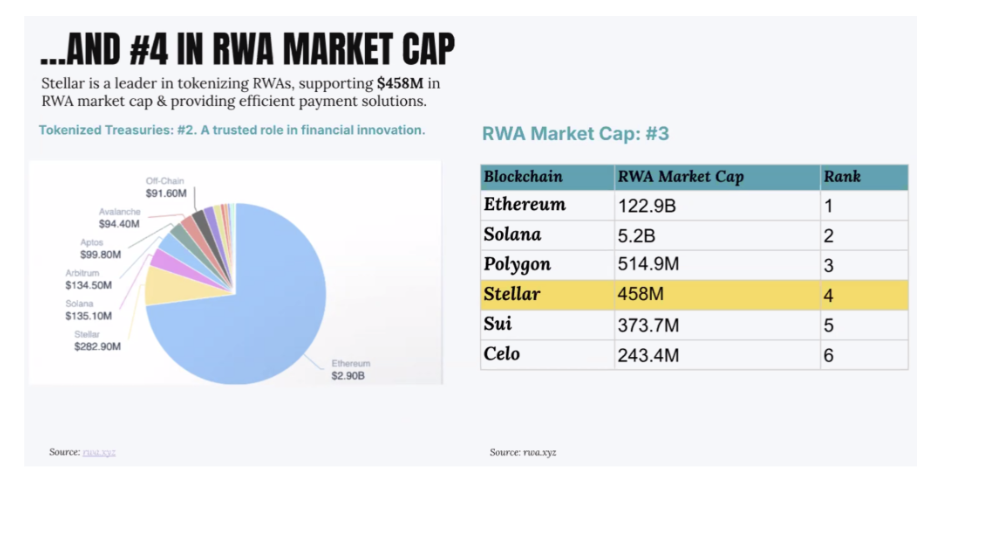
XLM Real Word Asset (RWA) market share | Source: Stellar Q4 Report
With AI and RWA expected to be dominant crypto narratives in 2025, Stellar’s positioning within this space could yield substantial upside for XLM.
Analysts suggest that increased market share in RWA tokenization could drive a significant re-rating of XLM’s value.
If Stellar moves up the rankings and surpasses its competitors, the influx of institutional capital could push XLM prices upwards.
-
3. Stellar ranks #1 in Transaction fees efficiency
Another standout metric from the Q4 report is Stellar’s #1 ranking in average transaction fees globally.
Low transaction fees remain a critical factor in blockchain scalability and adoption, particularly for enterprises and payment providers looking for cost-effective solutions.
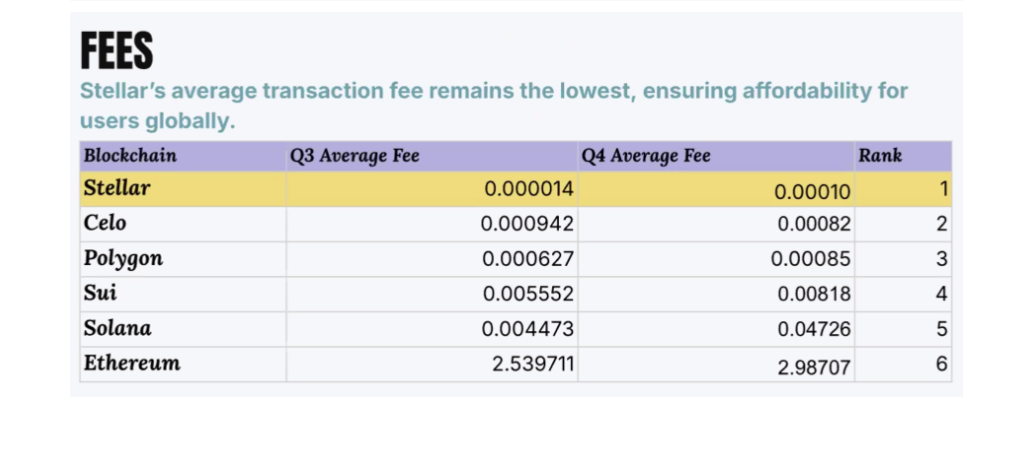
The chart above shows that Stellar transactions cost reduced from $0.0000014 in Q3 to reach $0.000010 in Q4 despite peak market activity around Trump's re-election.
Compared to Ethereum’s rising gas fees, Stellar’s fee structure offers a major advantage for businesses and users conducting frequent on-chain transactions.
The network’s low-fee environment, coupled with its high throughput and increasing RWA integration, strengthens the case for long-term adoption.
As institutional investors and enterprises continue seeking cost-efficient blockchain solutions, Stellar’s transaction fees efficiency could drive further demand for XLM.
Stellar Price Forecast: Falling Wedge Pattern hints 120% breakout
If Stellar maintains its competitive edge as depicted in the Q4 report and market sentiment stabilizes, XLM and XRP prices appear positioned for major upside in the mid-to-long term.
Validating this outlook, the falling wedge pattern on the XLM price forecast chart signals a potential 120% breakout, targeting the $0.75–$0.80 range in the mid-term.
This bullish reversal pattern typically forms after a prolonged downtrend, indicating waning selling pressure and an impending breakout.
The breakout confirmation will require a decisive move above the upper trendline resistance near $0.40, aligning with prior liquidity zones.
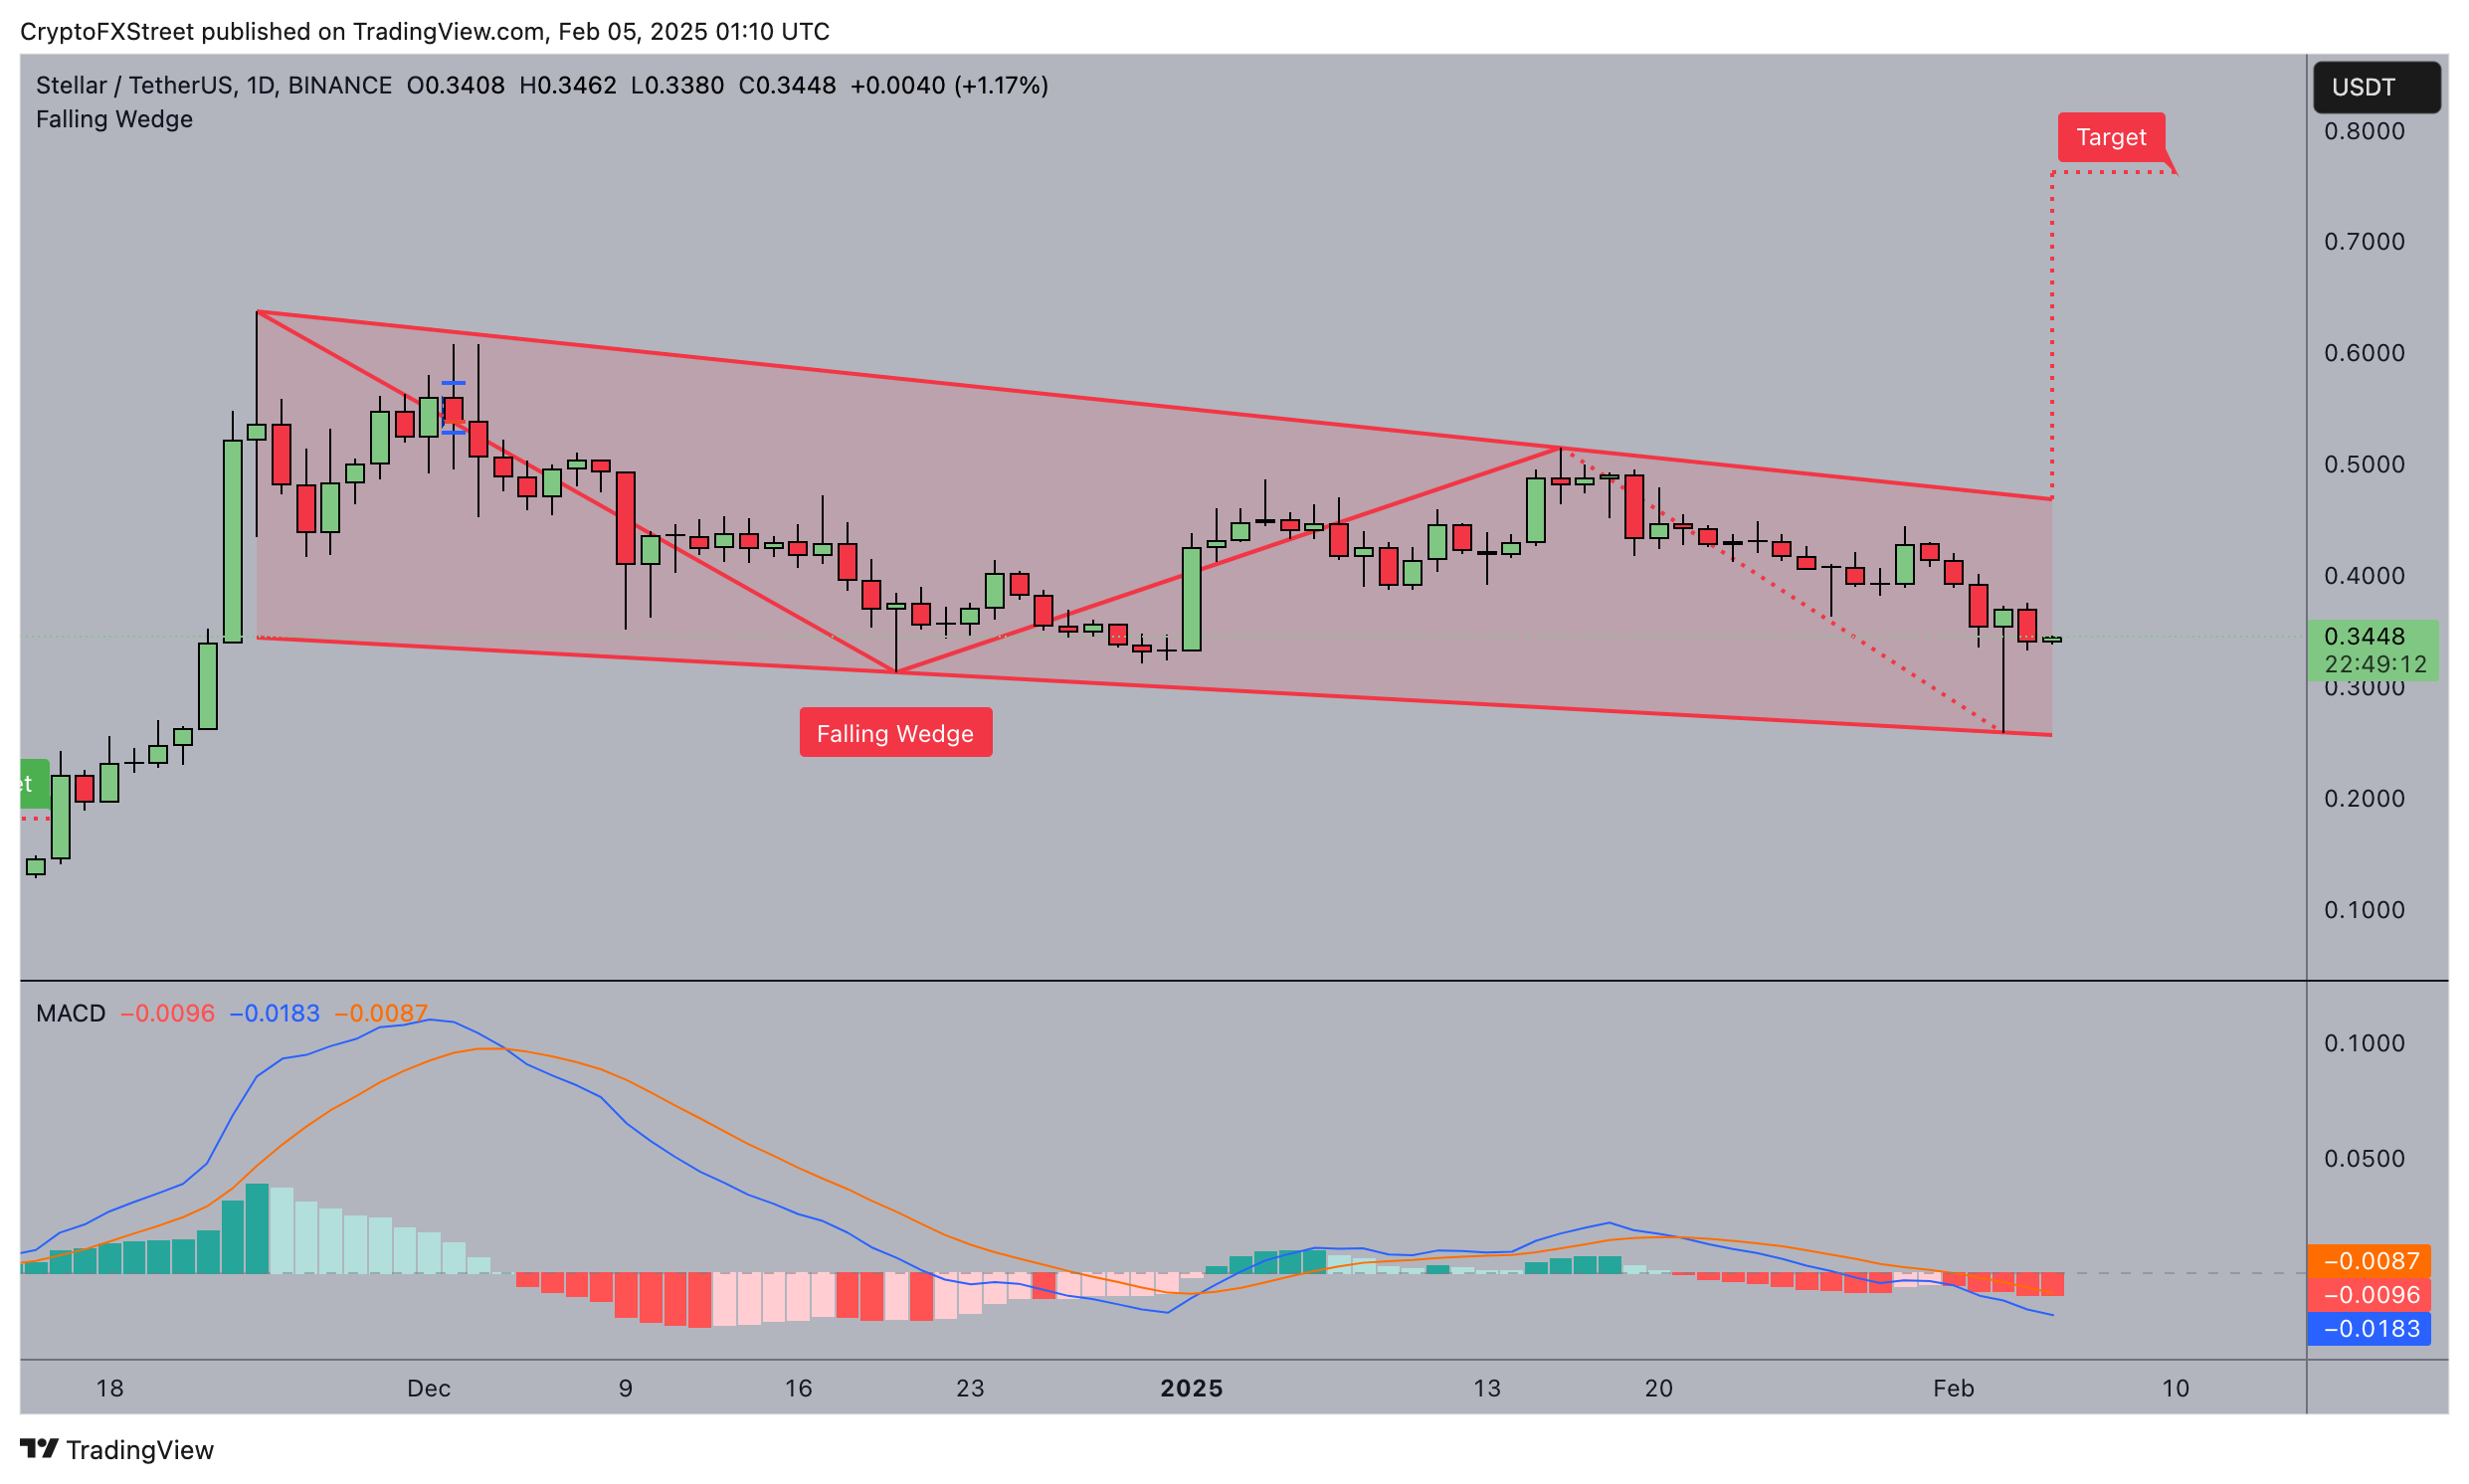
Stellar (XLM) Price Forecast
Momentum indicators further support this bullish case.
The MACD histogram is printing shallow red bars, suggesting weakening bearish momentum, while the MACD line is poised for a potential bullish crossover.
This scenario, combined with increasing trading volume, could amplify upward momentum toward the projected target.
Conversely, failure to reclaim the $0.40 resistance could expose XLM to further consolidation or a bearish fake out, potentially retesting support near $0.30.
However, despite the visible growth trajectory in Stellar's fundamental indicators, XLM’ short term price prospects still largely depends on the broader markets stability.
Author

Ibrahim Ajibade
FXStreet
Ibrahim Ajibade is an accomplished Crypto markets Reporter who began his career in commercial banking. He holds a BSc, Economics, from University of Ibadan.


