Stellar market update: XLM/USD down 31% from the recent high

XLM/USD has extended the correction from strongly overbought levels.
Strong support at $0.0638 might slow down the bears.
Stellar topped at $0.0963 on September 18 and lost 31% since that time to trade at $0.0659 at the time of writing. However, despite a sharp sell-off, the coin is still over 13% higher on a week-on-week basis. Stellar now takes the 10th position in the global cryptocurrency market rating with the total market value of $1.3 billion. Stellar’s average daily trading volume retreated to $175 million from over $500 million registered during the previous week.
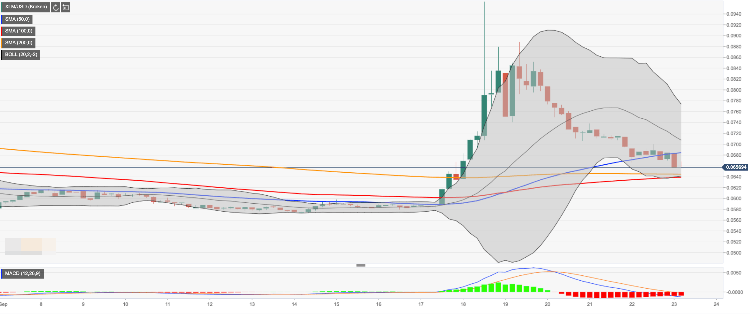
Stellar's technical picture
XLM/USD has settled in the area below SMA50 (Simple Moving Average) on a four-hour chart ($0.0685). We will need to see a sustainable move above this handle for the upside to gain traction and take the price towards psychological $0.0700 strengthened by the middle line of four-hour Bollinger Band. This barrier now serves as a resistance that might cap the recovery. However, if it is broken, the upside momentum is likely to gain traction with the next focus on $0.0783 created by the upper line of the Bollinger Band on a daily chart.
On the downside, the price may continue moving to the South with the nearest support spotted on $0.0638 This barrier is created by a confluence of strong technical indicators including the middle line of the Bollinger Band on a daily chart, the lower line of four-hour Bollinger Band, SMA100 and SMA200 on a four-hour chart. Once it is out of the way, the upside is likely to gain traction with the next focus on critical $0.0600 followed by the lower border of the recent consolidation channel.
XLM/USD, the four-hour chart
Author

Tanya Abrosimova
Independent Analyst


