Stacks Price Forecast: STX soars 20% as BTC surpasses $88,000
- Stacks extends its gains by 9% on Tuesday, following a 10% rally the previous day.
- On-chain data paints a bullish picture as STX open interest and trading volume are rising.
- The technical outlook suggests a continuation of the rally, targeting the $0.84 level.

Stacks (STX) price is extending its gains by 9%, trading around $0.76 at the time of writing on Tuesday, following a 10% rally the previous day. On-chain data paints a bullish picture, as STX open interest and trading volume are rising. The technical outlook suggests a continuation of the rally, targeting the $0.84 level.
Stacks on-chain metrics show a positive bias
Stacks, a layer-2 scaling solution for Bitcoin (BTC), has soared more than 19% so far this week as BTC surpasses the $88,000 mark. According to Coinglass’s data, the Open Interest (OI) in STX at exchanges rose from $33.28 million on Saturday to $62.13 million on Tuesday, the highest level since February 18. An increasing OI represents new or additional money entering the market and new buying, which suggests a rally ahead in the STX price.
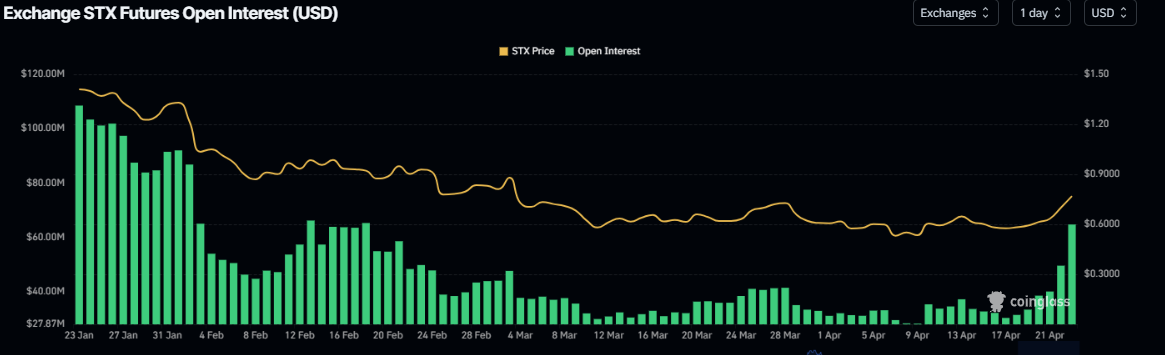
STX open interest chart. Source: Coinglass
Another aspect bolstering the platform’s bullish outlook is a recent surge in trading interest and liquidity in the STX network. Artemis’ daily trading volume data for STX has risen from $34.8 million on Saturday to $241.40 million on Tuesday, the highest daily volume year-to-date (YTD).
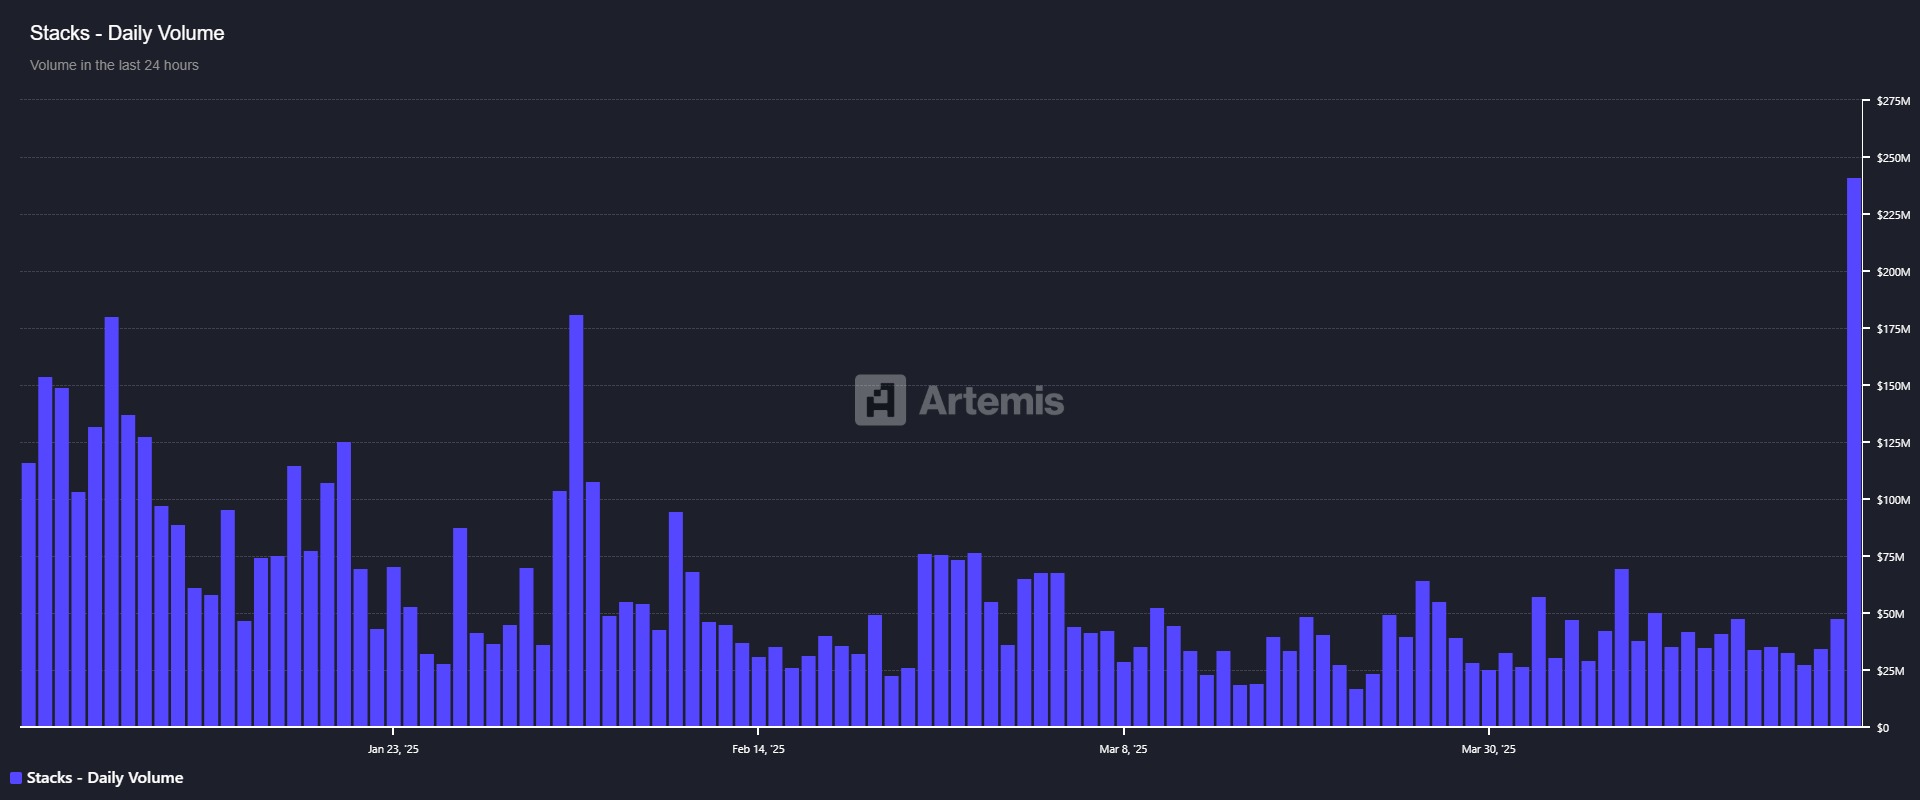
STX daily volume chart. Source: Artemis
Stacks Price Forecast: STX bulls aiming for the $0.84 mark
Stacks price broke above the descending trendline (drawn by joining multiple highs since early February) on Sunday. STX rallied 10.74%, closing above the 50-day Exponential Moving Average (EMA) at $0.68 the next day. At the time of writing on Tuesday, it continues to trade higher by nearly 9% at $0.76.
If STX continues its upward momentum, it could extend the rally to retest its next resistance level at $0.84.
The Relative Strength Index (RSI) on the daily chart reads 67, pointing upward toward its overbought territory of 70, indicating bullish momentum. The RSI has not yet reached the overbought levels, and there might still be room for further upside. However, traders should be cautious if the RSI rejects and falls below its overbought level of 70, suggesting weakness in momentum. Moreover, the Moving Average Convergence Divergence (MACD) also exhibited a bullish crossover last week, signaling a buying opportunity and continuation of the upward trend.
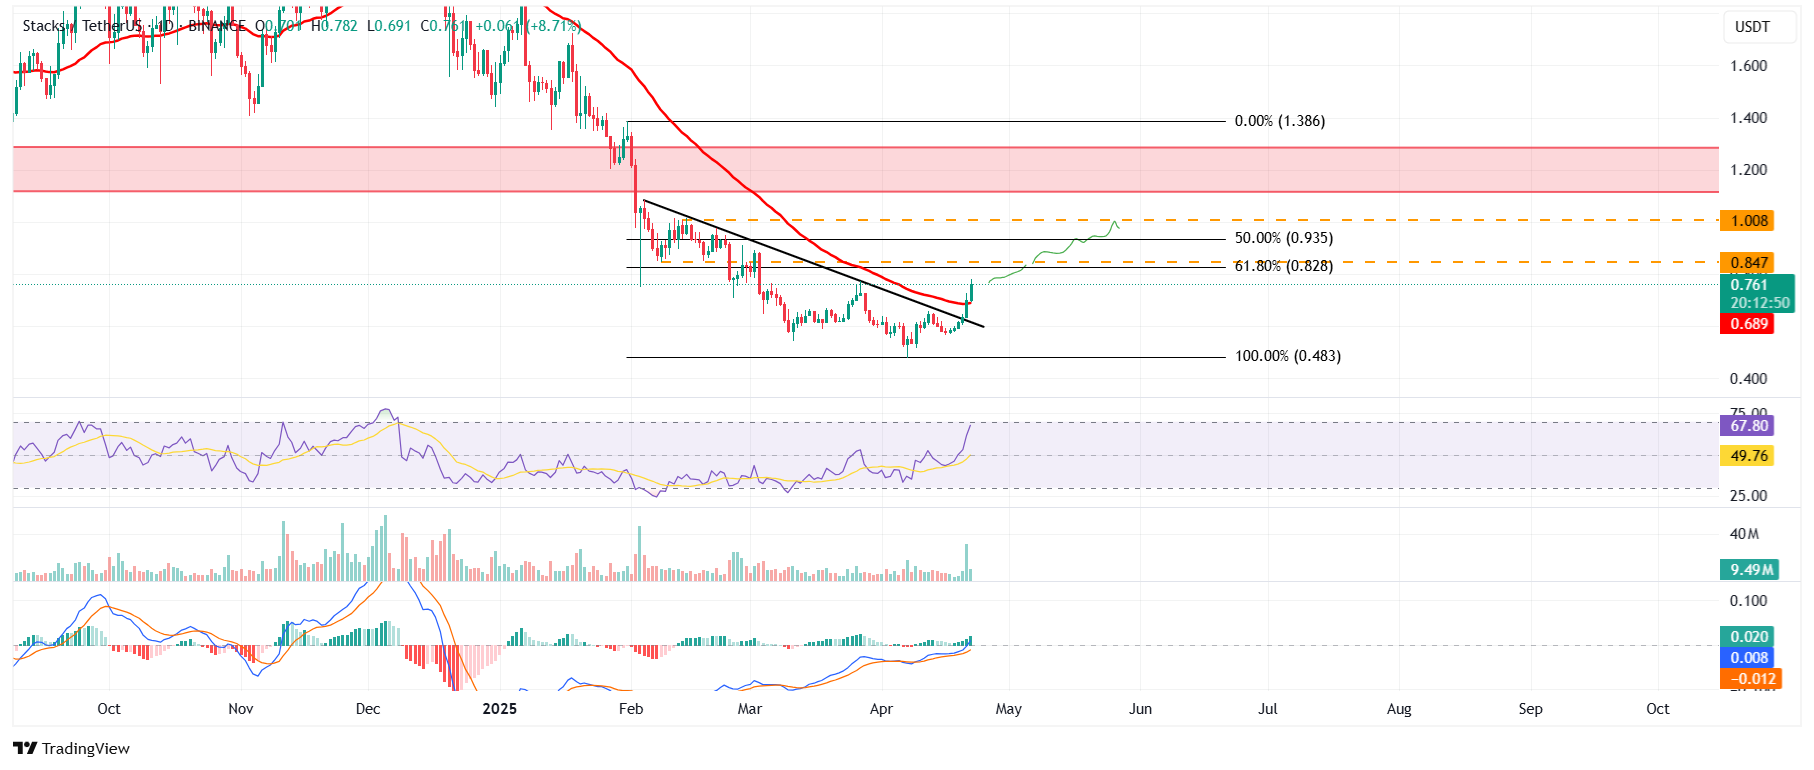
STX/USDT daily chart
However, if STX faces a correction, it could extend the decline to retest its support level at $0.68, the 50-day EMA.
Author

Manish Chhetri
FXStreet
Manish Chhetri is a crypto specialist with over four years of experience in the cryptocurrency industry.



