South Korea leads Asia in crypto media traffic but KAIA on-chain activity drops 90%

Outset Data Pulse continues to map the global crypto mediascape. Building on our recent Asia-wide Q2 analysis, this report zooms in on South Korea – the region’s most influential and behaviorally unique market – to examine how media attention, on-chain activity, and CEX flows shaped the KAIA ecosystem in the second quarter of 2025.
South Korea remains one of the most influential and analytically important crypto markets in Asia. In our Asia Q2 2025 media report, we outlined two defining regional dynamics:
- Crypto-specific outlets were regaining visibility across Asia, supported by direct traffic loyalty and rising AI-driven discovery.
- South Korea alone generated nearly 60% of all crypto-native media traffic in the region, far surpassing every other market in scale and consistency.
While the report examined regional media consumption, AI referral trends, and mainstream vs. crypto-native dynamics, the question facing South Korea required deeper investigation: How does Korea’s unusually strong and stable media attention translate into real on-chain participation and trading behavior – and what does this reveal about Korean Web3 users?
Q2 2025 provided an ideal natural experiment to analyze this correlation. Korean crypto media engagement remained strong throughout the quarter – yet KAIA’s blockchain activity showed one of the steepest boom-and-cooling cycles of any L1. Meanwhile, Korean CEX behavior reacted on a noticeable delay, creating a staggered pattern that is highly characteristic of Korean speculative cycles.
This report traces Korea’s Q2 dynamics across three interconnected layers:
- Media attention – What Koreans read, browse, and return to;
- On-chain activity – What they actually do once inside an ecosystem;
- CEX flows – How they trade and respond to emerging narratives.
By observing how these layers move together or diverge, we uncover the behavioral mechanics behind Korea’s crypto engagement – and what it means for KAIA’s long-term ecosystem health.
Methodology and data foundations
To capture the full Korean crypto engagement cycle, we integrated three independent datasets:
1. South Korean crypto-native media data (Similarweb)
We collected traffic metrics for 25 Korean outlets and also engagement metrics for the most visible outlets:
- Total monthly and quarterly traffic
- Direct, search, referral, paid, AI-driven, and social traffic
- Visit duration, pages per visit, bounce rate
- Device distribution
Note: Monthly data was interpolated into weekly values for cross-comparison with on-chain and CEX timelines.
2. On-chain data (KAIA ecosystem)
All KAIA data comes from Dune Analytics’ Kaia Foundation Official Dashboard. Metrics used:
- Weekly active users (new and returning)
- Weekly transaction count
- Monthly new user cohorts
- Short-term retention rates: Months 1–3 (meaningful for Q2 cohorts)
- Active contracts (new and returning)
3. CEX flow data
CEX data was sourced from Dune Analytics and covers five major exchanges:
- Upbit
- Bithumb
- Korbit
- Coinone
- GOPAX
Metrics include:
- CEX-to-user transfers
- User-to-CEX transfers
- Unique depositors
- Unique withdrawers
- Total weekly CEX transaction volumes
This dataset captures how Korean traders responded to ecosystem events and narratives.
Why KAIA represents Korean on-chain behavior
KAIA is the most Korea-centric L1, which was formed by merging the Klaytn blockchain and Finschia blockchain, integrating KakaoTalk and LINE user bases (over 250 million users combined). This makes KAIA a methodologically valid and representative proxy for Korean on-chain engagement.
Weekly normalization
To compare media, on-chain, and CEX timelines, all metrics were normalized to a 0-1 index, enabling:
- Lead-lag detection
- Comparative amplitude
- Divergence analysis
The formula used: Normalized value = (Value – Min) / (Max – Min)
Korea’s crypto media ecosystem stays strong and habit-driven
South Korea remained Asia’s largest crypto media market in Q2 2025, generating 57.03M visits across major Korean thematic outlets.
A month-by-month breakdown shows:
- April: 18.60M
- May: 19.80M (monthly peak)
- June: 18.63M
This stable pattern confirms that Korean interest in crypto news remained consistently high throughout the quarter.
Korea’s crypto media engagement shows strong loyalty, forum-driven circulation, and selective AI exposure
Korea’s crypto information ecosystem is not only the largest in Asia – it is also one of the most behaviorally distinctive. The leading platforms exhibit clear patterns in how traffic originates, circulates, and deepens, providing a detailed picture of how Korean users discover and consume crypto content.
A close analysis of six influential Korean platforms – Coinpan, CoinReaders, Blockmedia, Bloomingbit, TokenPost, and Coinness – reveals several defining dynamics.
Note: Although Coinpan and Coinness are not conventional crypto news outlets, both are included due to their exceptional influence in Korea’s crypto attention landscape.
- Coinpan operates as a large-scale community forum that shapes narrative flow and discovery.
- Coinness functions as a real-time newsfeed and alert platform with habit-driven usage patterns.
1. Direct traffic and strong brand loyalty define the Korean crypto audience
Mirroring our broader Asia Q2 findings – where 54% of visits to crypto-native outlets were direct – Korea shows an even stronger pattern. Across major platforms, direct traffic is exceptionally high, indicating that users intentionally return to the same few sources for daily updates:
- Coinpan – 65% direct
- CoinReaders – 58% direct
- Blockmedia – 60% direct
- Coinness – 73% direct
This is a strong sign of habit-forming, loyal readership: users go directly to their preferred crypto information hubs rather than relying on search or social channels. It reflects a tightly consolidated attention economy.
2. Referral ecosystems are overwhelmingly forum-driven – a uniquely Korean structure
Unlike most markets where referral traffic comes from X, Telegram, or aggregators, Korea’s crypto media is fed heavily by large general-interest forums.
Coinpan’s top referrers:
- FM Korea – 43.85%
- Namu Wiki – 15.05%
- DCInside – 10.23%
- Perplexity AI – 9.68%
- Lekohoo – 4.93%
Blockmedia’s top referrers:
- SomeWiz – 28.31%
- Naver – 14.07%
- Perplexity AI – 12.86%
- 82Alda – 8.67%
- FM Korea – 8.53%
TokenPost’s top referrers:
- Naver – 17.84%
- Ruliweb BBS – 17.41%
- SomeWiz – 15.51%
- Ppomppu – 12.21%
- Clien – 7.02%
Coinness’ top referrers:
- AntTalk – 52.48%
- FM Korea – 10.13%
- MediaCategory – 6.41%
- Naver – 6.23%
- DCInside – 5.75%
Across outlets, the pattern is unmistakable:
Korean crypto attention propagates through community forums, not social media.
This is structurally different from Western or LATAM markets and is a defining feature of Korea’s crypto mediascape.
3. AI-driven referral traffic is emerging – but highly localized
Only two platforms show measurable AI-driven referral traffic:
- Blockmedia – 23.86% AI referrals (Perplexity)
- Coinpan – 9.68% AI referrals (Perplexity)
All other major outlets show 0% AI referral in Q2.
It means that:
- AI discoverability is rising, but not uniformly.
- It is strongest among outlets producing frequent, short-form, high-velocity updates that AI systems index quickly.
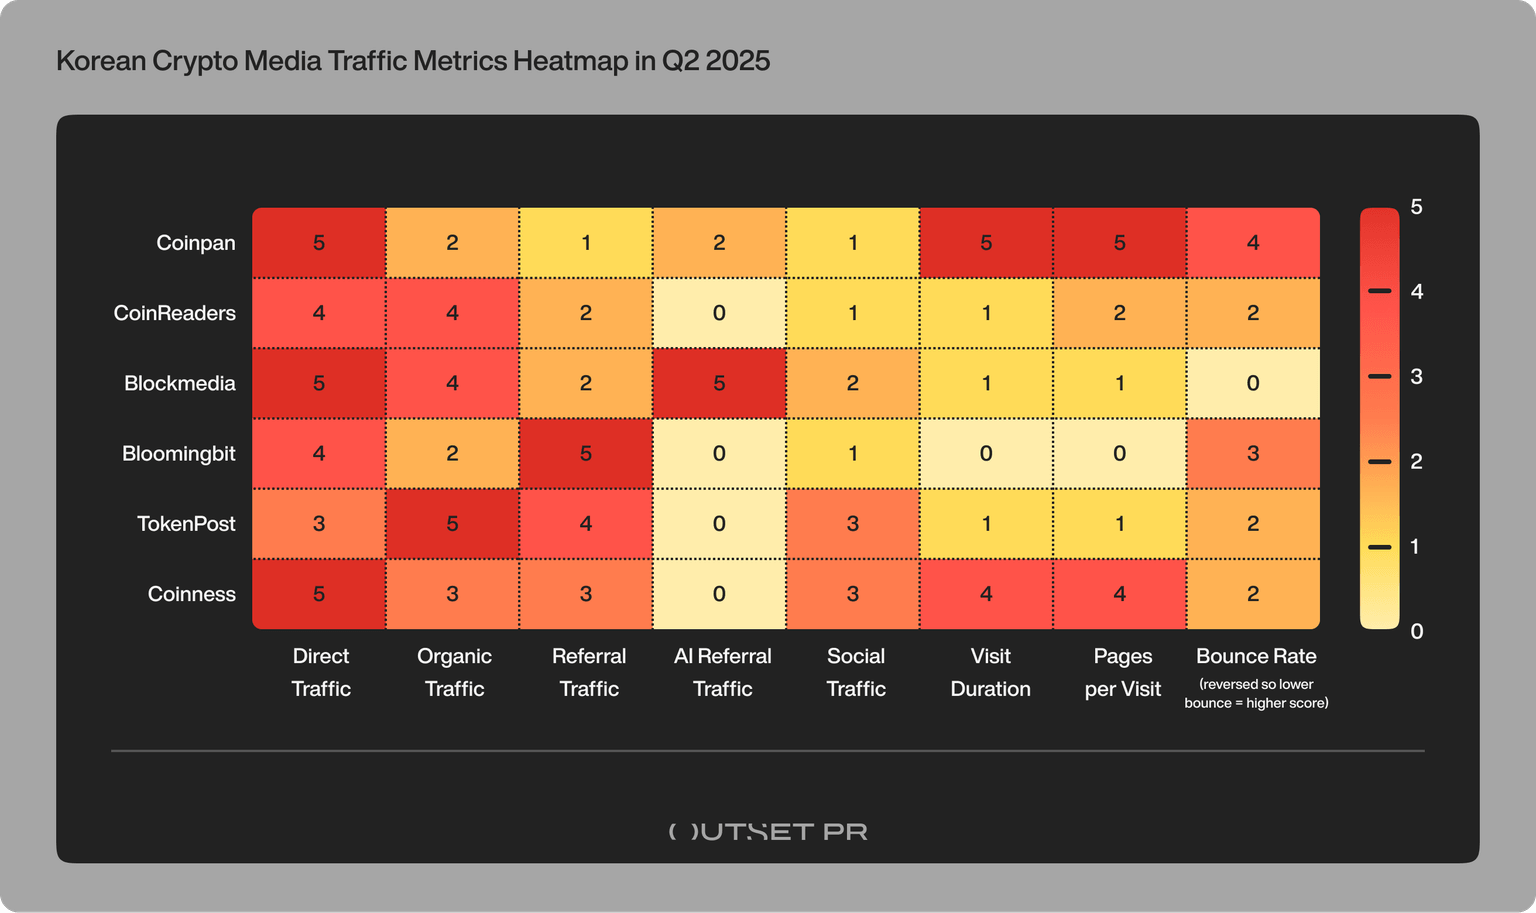
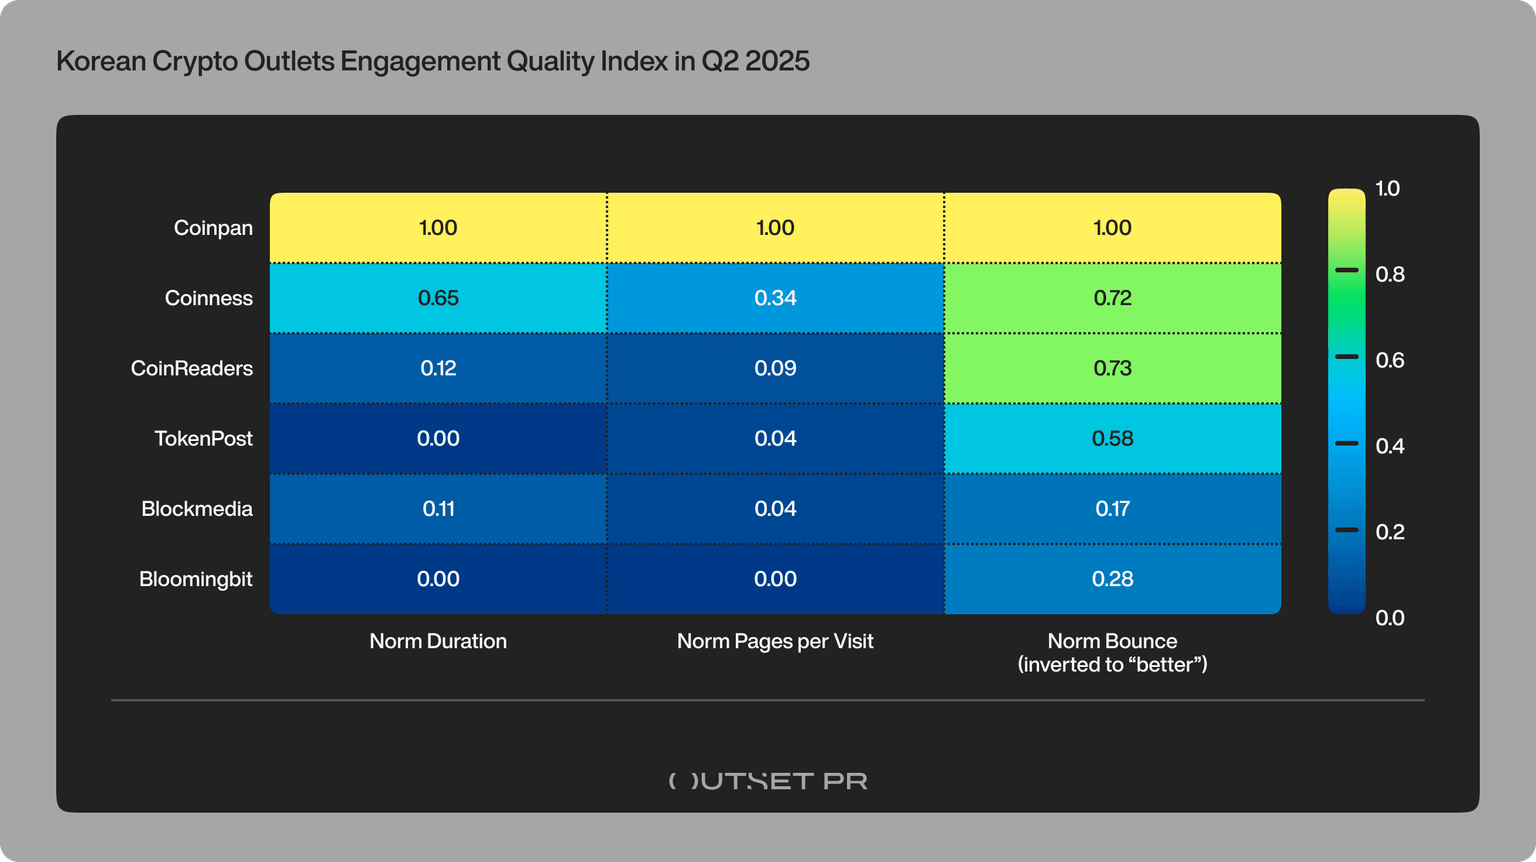
4. Engagement depth varies dramatically across platforms
Korean outlets and forums show a wide range of depth and loyalty:
Coinpan stands out as the only platform demonstrating deep, community-driven engagement, with readers spending 6.19 minutes on-site, viewing 8.78 pages per session, and bouncing only 24% of the time – the strongest loyalty signal in the entire dataset.
A second tier reflects habitual news scanning: Coinness posts moderate engagement with 4.01 minutes, 4.19 pages, and a 44.24% bounce rate, while TokenPost shows shorter, more transactional interactions at 0.43 minutes, 1.59 pages, and a 50.96% bounce.
Finally, light headline scanning characterizes platforms like Blockmedia and Bloomingbit, where users spend 1.11 minutes and 0.54 minutes, view 1.53 and 1.38 pages, and bounce at 68.84%and 64%, respectively.
These differences show that:
Some platforms function as deep community spaces, while others serve fast, transactional information needs.
5. Social traffic remains narrow and platform-specific
Across the six platforms, the majority of social referral traffic comes from:
- YouTube
- X
Secondary channels (Instagram, Reddit, Telegram, Facebook) appear but remain marginal.
This reflects Korea’s broader digital ecosystem, where forums and direct visits dominate the discovery process over social media.
KAIA on-chain activity shows a boom-and-cool cycle
Meanwhile, KAIA’s on-chain behavior followed a very different trajectory – a classic “boom-and-cool” pattern shaped by incentives, not sustained ecosystem growth.
A historic April onboarding wave
KAIA entered Q2 with what was arguably one of the largest short-term retail influxes in the Asian L1 landscape. In April alone:
- 17.27M new users were added;
- Weekly transactions peaked at 53.58M;
- Active wallets surged past 12M in early April;
- Active contracts remained stable at roughly 1,250-1,350, indicating that activity concentrated heavily on a small number of mission-related contracts.
This combination – mass onboarding, high-density transactional flow, but limited contract diversity – suggests a surge driven overwhelmingly by rewards, missions, and campaign mechanics, rather than by organic exploration or app-level utility. KAIA briefly became one of Asia’s busiest chains by raw transaction count, but the underlying activity quality was fragile.
A rapid cooldown as incentives faded
Once major missions concluded and reward intensity dropped, usage fell just as quickly as it rose:
- New users declined from 17.27M in April to 8.49M in May and then to 2.09M in June;
- Weekly transactions collapsed from 53.58M to 16.46M (May 26) and then to 4.52M (June 30);
- Active contract counts stayed broadly unchanged throughout, reinforcing that engagement was not spreading into the broader developer ecosystem.
Therefore, KAIA’s Q2 trajectory illustrates a high-amplitude but short-duration usage cycle – effective at bringing people in, but not at keeping them active.
KAIA community signals also reflect an incentive-led growth cycle
KAIA’s communication strategy on X throughout Q2 aligns closely with the rise and fall of its on-chain metrics. The narrative shifted month by month in ways that both reflect – and help explain – the observed data.
April: Incentive-driven messaging fuels the spike
KAIA’s April posts focused almost entirely on campaigns, missions, and giveaways, including:
- “Kaia Stablecoin Summer” teasers
- Yapper Leaderboard competitions
- Mini Dapp promotions and AMAs
- High-yield farming and reward announcements
This messaging attracted over 17M new users and sparked record transaction counts. The communication strategy amplified the reward loop, helping drive the short-lived boom.
May: Stablecoin integrations sustain interest but not usage
In May, KAIA’s announcements shifted to ecosystem expansion:
- Integration of Tether (USDT)
- Support from Bitget and Bitfinex
- SafePal introduction
- Continued Portal and campaign updates
These events kept Korean media attention high, even though on-chain usage continued to fall. Narrative momentum stayed strong – but user activity did not.
June: Utility and ecosystem building messages emerge
By June, KAIA focused on long-term positioning:
- RWA narratives (particularly, real-world yield)
- Mini Dapp usage highlights
- OpenAD Protocol partnership
- Taipei community and builder events
These higher-quality signals helped strengthen perception – but by this stage, the user base had already contracted significantly, and on-chain metrics were at quarterly lows.
Takeaway
The alignment between on-chain metrics and KAIA’s public messaging reveals a clear ecosystem pattern:
- April: Incentives drive massive but surface-level adoption.
- May: Strong narrative keeps media interest high even as usage falls.
- June: Ecosystem-focused messaging cannot reverse declining activity.
Together, these dynamics reinforce a central conclusion:
Q2 activity on KAIA was campaign-led and attention-rich, but not organically sustained – highlighting the gap between visibility and long-term engagement in South Korea’s Web3 environment.
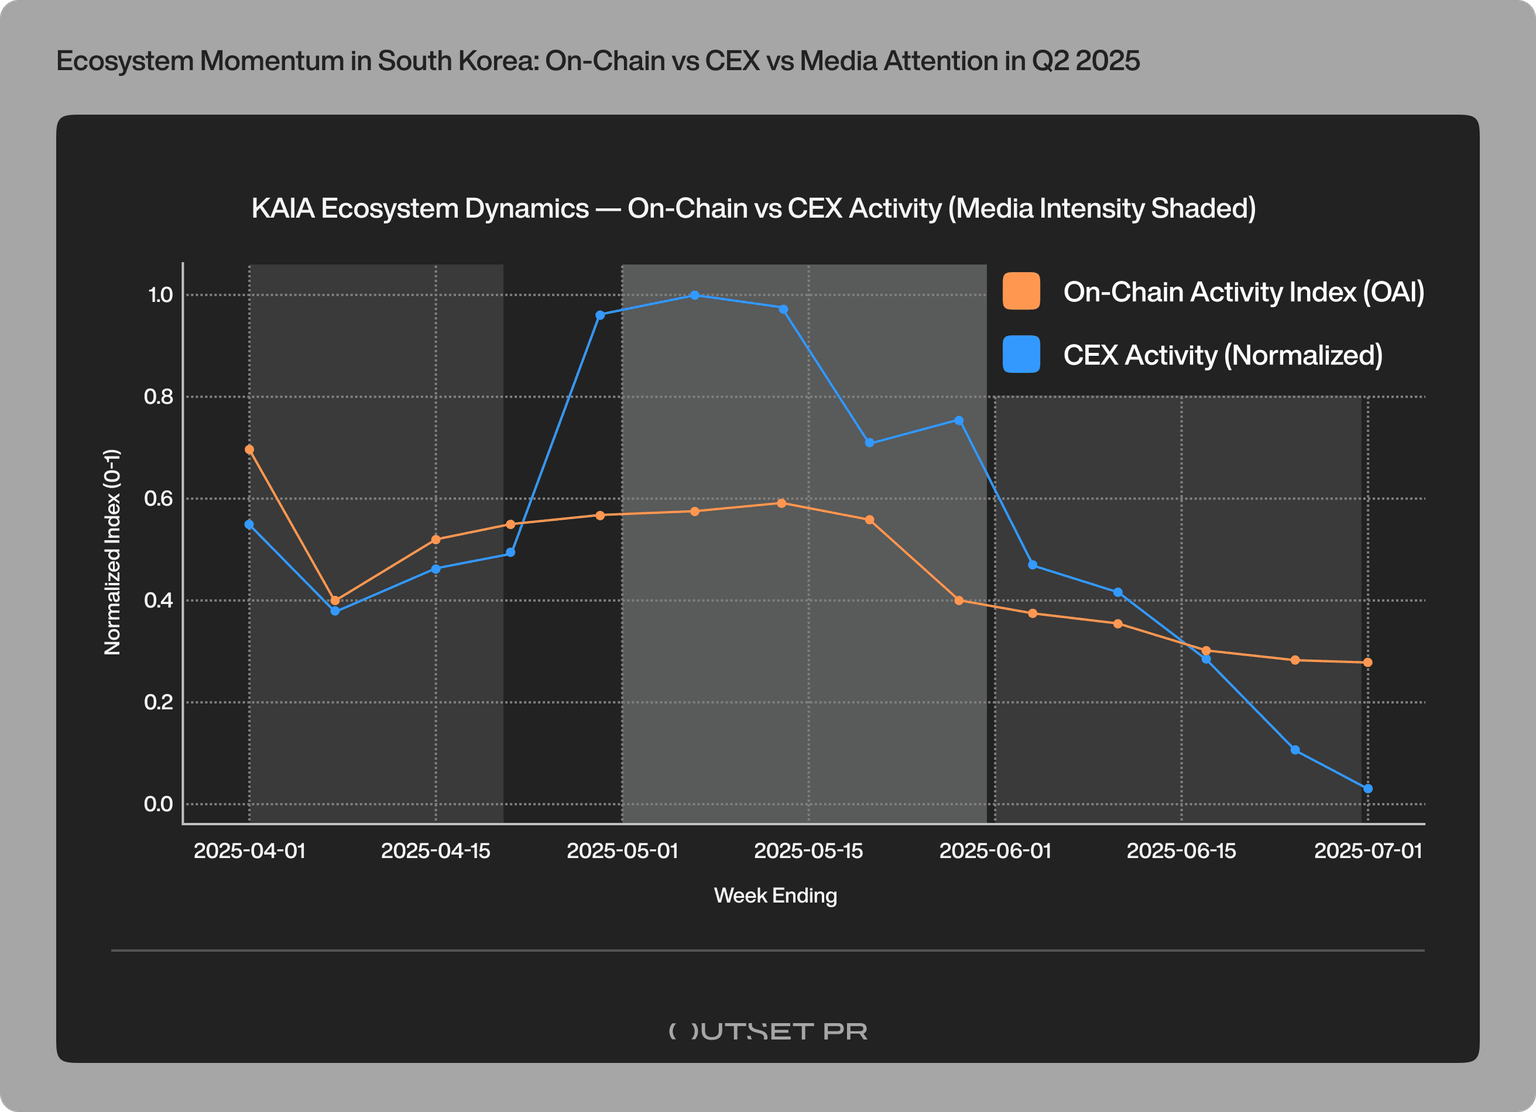
CEX activity reflects the lagging indicator of ecosystem momentum
To complete the ecosystem picture, we analyzed weekly transaction flows between Korean users and the major domestic exchanges: Upbit, Bithumb, Coinone, Korbit, and GOPAX. We found that CEX activity peaked several weeks after KAIA’s April surge.
Early April – KAIA’s on-chain peak, but CEX activity remained muted
Weekly data confirms a clear timing lag. On April 7, CEXs recorded 7,910 transfers to users and 1,145 user-to-exchange transactions, alongside 794 unique deposits and 1,917 unique withdrawals.
A week later, on April 14, the numbers remained broadly consistent: 6,682 CEX-to-user transfers, 896 user-to-CEX transactions, 671 unique deposits, and 1,673 unique withdrawals.
In short, no immediate surge occurred on exchanges despite the massive on-chain spike.
Peak comes much later — early to mid May
CEX flows jump sharply 4-5 weeks after KAIA’s early April peak. On May 5, exchanges processed 11,199 transfers to users and 1,145 user-to-exchange transactions, with 746 unique deposits and 2,269 unique withdrawals.
By May 12, the figures were nearly identical: 11,353 CEX-to-user transfers, 1,052 user-to-CEX transactions, 742 unique deposits, and 2,522 unique withdrawals – the highest CEX activity of Q2.
As such, exchange behavior lagged on-chain behavior, driven by speculation rather than utility usage. Traders were not participating during the on-chain peak. Instead, they entered after media narratives intensified (stablecoin integration announcements, exchange listings, KAIA campaigns).
Decline into June – but more stable than on-chain metrics
While KAIA’s on-chain activity collapsed, CEX flows declined gradually. On June 2, there were 7,847 exchange-to-users transfers and 780 user-to-exchange transactions. By June 16, those numbers had eased to 5,349 CEX-to-user transfers and 823 user-to-CEX transactions. The trend continued into June 30, with 4,041 transfers to users and 913 transactions to exchanges.
The pattern shows CEX activity remained consistently active, reflecting:
- Continued stablecoin integrations (USDT listings)
- Bitget and Bitfinex adopting USDT on KAIA
- Ongoing trader interest
- Momentum from KAIA community announcements
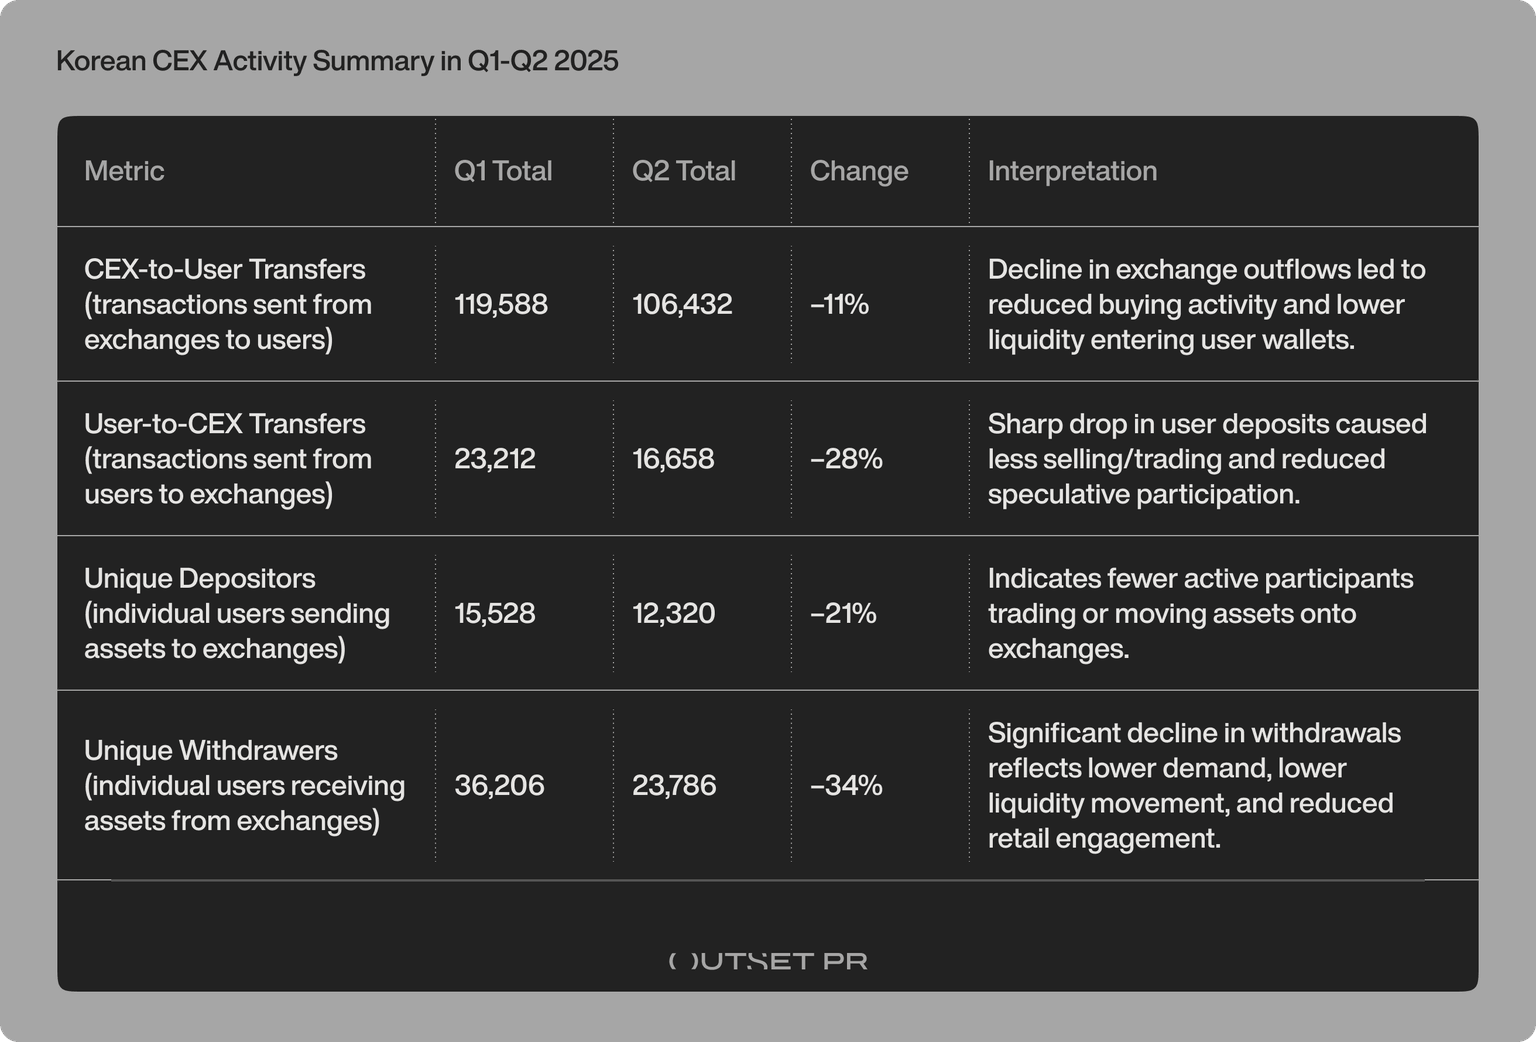
This drop across all user-facing metrics indicates that the entire Korean trading base cooled in Q2, aligning with the post-incentive decline seen on-chain.
Takeaway
The CEX data confirms that Korean exchange users did not drive the KAIA surge – they responded after it. This reinforces the broader conclusion:
Q2 momentum in Korea was narrative-driven and incentive-amplified – not sustained by organic on-chain usage or long-term demand.
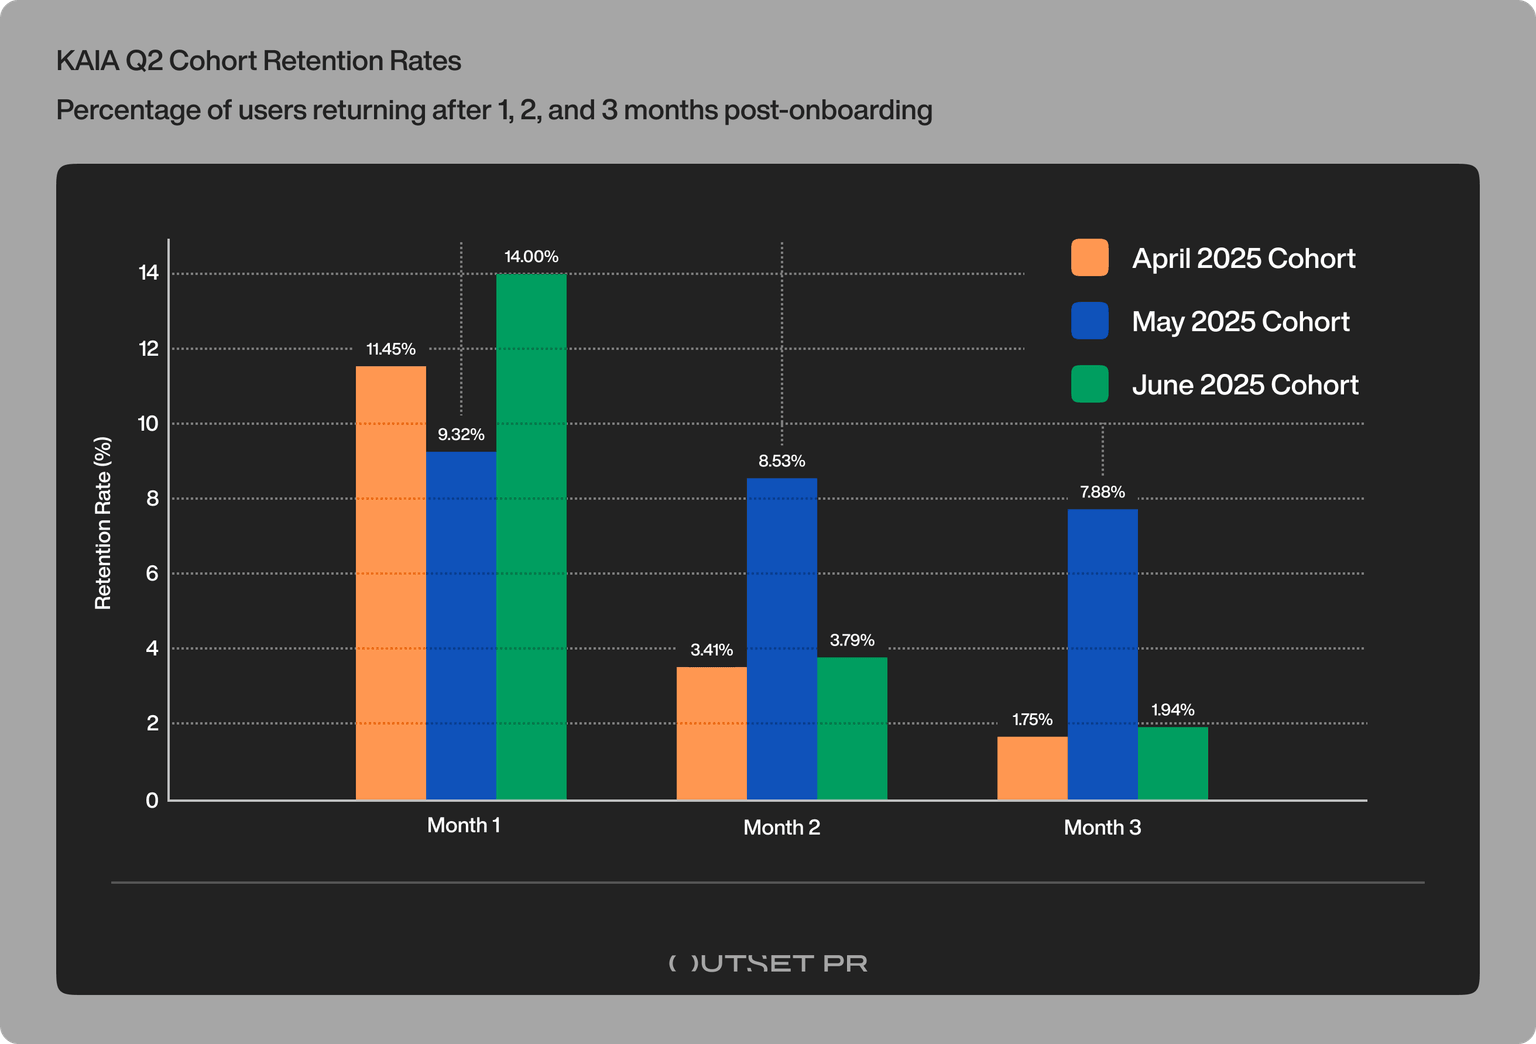
On-chain retention shows extremely low user stickiness across Q2 cohorts
Retention is one of the most important indicators of ecosystem health because it measures how many newly onboarded users continue returning in subsequent months. In a monthly cohort model, such as the one used in KAIA’s Dune dashboard, retention is tracked as follows:
- Month 1 retention = % of users who sign up in a given month and return the following month
- Month 2 retention = % who return two months later
- Month 3 retention = % who remain active after three months
This structure allows us to evaluate not just how many users arrived, but how many stayed, providing a clear signal of whether growth was driven by real utility or by short-term hype.
Across April, May, and June 2025 cohorts, retention rates show a consistent pattern: high-volume onboarding followed by immediate and dramatic churn.
April 2025 cohort (17.27M users)
The April onboarding wave was historic – but not durable. Retention fell from 11.45% to 3.41% and then to 1.75% within three months. More than 98% of users disappeared by Month 3.
May 2025 cohort (8.49M users)
Unusually stable retention (9.32% to 8.53% and then to 7.88%) suggests users were still engaged with campaign mechanics rather than core utility.
June 2025 cohort (2.09M users)
Short-term reactivation was stronger (14%), but retention collapsed by Month 3 (1.94%), exactly matching the pattern of campaign-driven ecosystems.
Why retention explains the entire Q2 collapse
Low retention correlates directly with:
- the crash in weekly active users
- the drop in transaction count
- the decline in new users
- the lagging CEX flows
- the disconnect between high media traffic and low on-chain activity
Retention is the missing link – the structural reason KAIA’s explosive Q2 activity could not sustain itself.
Takeaway
KAIA’s Q2 retention metrics show that the ecosystem achieved massive exposure and onboarding, but almost no long-term habit formation.
This reveals a fundamental challenge for Korean Web3 adoption:
The market is highly attentive (as seen in media traffic) but not yet ready to convert attention into sustained on-chain behavior without strong utility and incentives.
Conclusion
South Korea remains one of the most influential Web3 markets globally, but Q2 2025 revealed a widening gap between:
- Attention vs. engagement
- Narrative vs. utility
- Growth vs. retention
KAIA’s explosive visibility at the start of the second quarter demonstrates significant market reach. But the steep decline afterward highlights the need for a more sustainable, utility-led ecosystem model. If KAIA strengthens retention mechanics, builds deeper user journeys, and leverages high-engagement Korean media effectively, it can convert its broad awareness into long-term, defensible adoption.
A full dataset covering all media examined – including traffic composition, engagement signals, and referral dynamics across Asia – can be found in our earlier Q2 regional report.
Outlook and recommendations for KAIA and Korean Web3 teams
KAIA and broader Korean Web3 projects may benefit from considering several strategic adjustments that build on the patterns observed in Q2:
- Explore a shift toward user retention. While large onboarding waves can raise visibility, long-term value often comes from strengthening the mechanisms that keep users active and engaged over time.
- Focus on expanding utility-driven experiences. Mini Dapps, stablecoin payments, creator tools, and liquid staking are areas where deeper, more consistent usage could emerge if developed thoughtfully.
- Take a balanced approach to incentives. Missions and campaigns can be powerful acquisition tools, but ecosystems may see more durable participation when incentives are complemented by meaningful utility and user journeys.
- Collaborate with high-engagement Korean media. Platforms with strong direct traffic and longer session durations – such as Coinpan and CoinReaders – may offer more stable narrative grounding and better alignment with Korea’s behavior-driven attention patterns.
- Strengthen pathways between CEX activity and on-chain usage. Since exchange flows often lag and don’t always convert to on-chain behavior, improving UX, simplifying transitions, and aligning incentives may help users move more naturally into the ecosystem.
- Experiment with emerging AI-driven discovery channels. AI aggregators are starting to appear as notable referral sources and may grow into an important layer of content distribution and user acquisition.
Appendix A: Formula and calculation methodology
1. Normalizing all metrics (0-1 scale)
To compare media, on-chain, and CEX metrics on the same visual scale, each raw metric is converted into a normalized value between 0 and 1.
The formula is:
Normalized value = (Observed value – Minimum value) ÷ (Maximum value – Minimum value)
This ensures that:
- The lowest value in the period becomes 0;
- The highest value becomes 1;
- All other values fall proportionally between them.
This method prevents large raw-number differences (e.g., millions of transactions vs. thousands of CEX transfers) from distorting the chart.
2. On-Chain Activity Index (OAI)
The On-Chain Activity Index combines several blockchain activity signals into a single measurement.
The signals are weighted based on their relevance to user activity:
- User activity (new + returning addresses): 55% weight
- Transaction count (total weekly transactions): 35% weight
- Contract activity (new + returning smart contracts): 10% weight
The formula is:
OAI(t) = 0.55 × Normalized User Activity(t) + 0.35 × Normalized Transaction Count(t) + 0.10 × Normalized Contract Activity(t)
After the weighted score is calculated, the OAI is normalized again between 0 and 1 to ensure comparability over time.
3. CEX Activity Index (normalized average)
CEX activity reflects liquidity flow between users and Korean exchanges (Upbit, Bithumb, Korbit, Coinone, GOPAX).
Four categories are used:
- CEX-to-user transfers
- User-to-CEX transfers
- Unique depositors
- Unique withdrawers
Each category is normalized individually using the same 0-1 scaling method.
The combined CEX Activity Index is simply the average of the four normalized values:
CEX Index(t) = (X₁(t) + X₂(t) + X₃(t) + X₄(t)) ÷ 4
Where each X₁-X₄ is a normalized metric for that week
4. Media Shading (qualitative, not numeric)
Media traffic is not converted into a line.
Instead:
- April shading = base intensity
- May shading = brightest (peak traffic)
- June shading = base intensity
This method visually shows context without forcing incomparable numbers (website visits vs. on-chain data) into a single scale.
Author

Mike Ermolaev
Independent Analyst
Mike Ermolaev is the founder of Outset PR. The agency helps tech companies, especially blockchain and Web3 projects, get the desired recognition thanks to its wealth of media connections.


