Solana price upside looks tempting, but SOL weekly chart screams bull trap
- Solana price had a solid recovery after the sell-off in major cryptocurrencies.
- Although SOL broke a crucial bearish trend line, the upside looks very limited.
- A drop lower could show $22.66 as the downside target at the 78.6% Fibonacci level.

Solana price has had a good recovery toward $36, but support is getting weaker as forces from above are putting a significant cap on any further upside potential.
Solana price has too much resistance at $37
Market participants have left the sell-off that went through the cryptocurrency space behind us. Most of the major cryptocurrencies recovered some of their losses, and altcoins enjoyed a tailwind to recover as well. However, that tailwind seems to be fading now.
A look at Solana price shows that the technicals do not paint a pretty picture for buyers who came too late to the party.
Solana price was partially able to take out multiple weeks of a descending trendline as seen on its weekly chart below. But Today, SOL does not seem to be staying above that trendline suggesting that a weekly close above it is not possible anymore for this week.
SOL hit the ceiling at $37, where sellers were waiting to take over from the buyers. Around that area, we have the 55-week Simple Moving Average (SMA), the previous monthly pivot, and a 50% Fibonacci level acting as resistance. This means Solana price has three solid reasons for a place where sellers would come in to short.
On the downside, Solana price does not have much in the way until the first real support at $22.66, which is the 78.6% Fibonacci level.
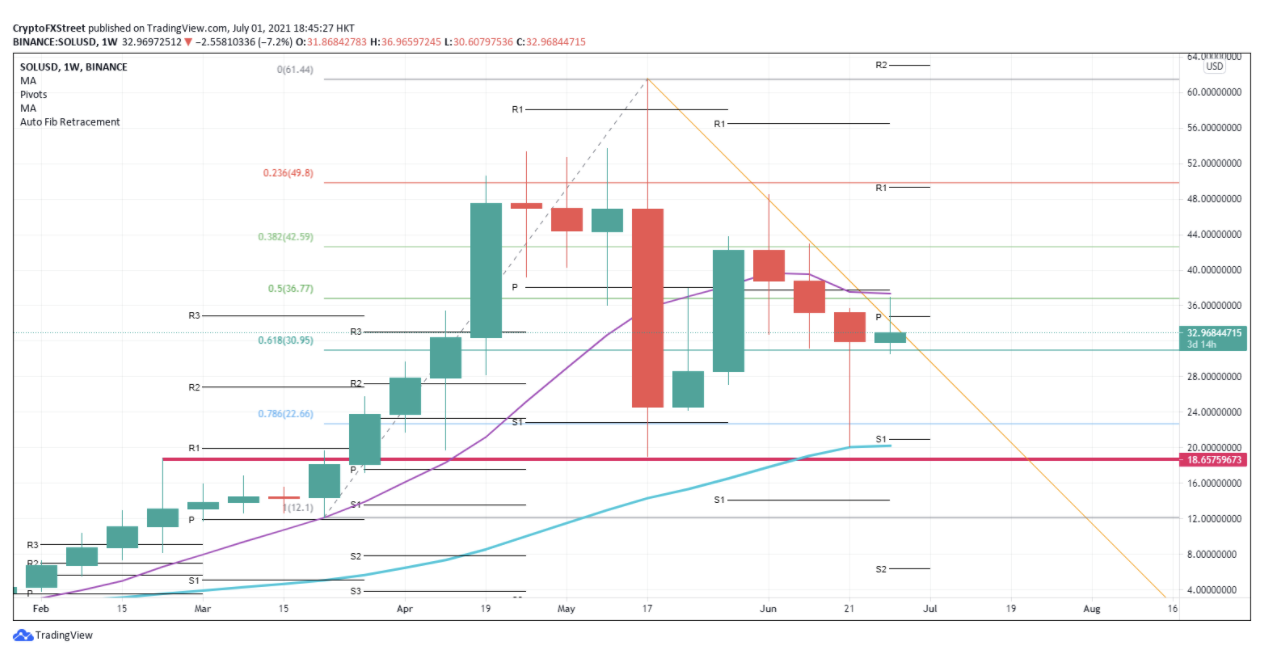
SOL/USD weekly chart
Solana price is currently limited to the upside and seems more congenial to a break lower toward $22.66. Just below this barrier of support, SOL has the monthly first support at $21 together with the 200-week SMA, which may represent a crucial place for buyers to come in.
If Solana price succeeds in closing this week above the trend line, expect more upside when SOL takes out the monthly pivot and the 55-week SMA. The following price target would be $43 toward the upside at the 38.2% Fibonacci level.
Author

Filip Lagaart
FXStreet
Filip Lagaart is a former sales/trader with over 15 years of financial markets expertise under its belt.


