Solana price provides a horror scenario for bulls, and it is not even Halloween yet
- Solana price action lost over 12% these past four trading days.
- SOL price is at risk of dropping below a very bearish force that could add even more downside.
- Pressure will mount on $26 before it cracks and sees SOL price printing $18.66.

Solana (SOL) price action is yet again on the back foot this week after what promised to be a very bullish week. All stars were aligned as the initial numbers from the US earnings season proved quite good despite the market turmoil. Unfortunately, the tailwind of equities was no match for the sharp decline that slipped below important support and, within a few days, faced yet another key level.
SOL price set to face a big dilemma
Solana price action is set to tank massively on the back of the technical forces currently pushing price action up or down within a certain limited range. The best example is to go back a little on the chart towards the beginning of October, when Solana price action broke through the red descending trend line and even looked to be preparing for a pop higher.
SOL price, however, never saw its rally take off and instead just ran into the wall of the 55-day Simple Moving Average (SMA). As that same 55-day SMA is trading downwards, the push was inevitable to the downside in SOL price action which broke through $30.21. The big dilemma bulls are facing is that they need to step in now or go for the bounce off the next big support at $26. If bulls let it go too far, however, the risk increases that SOL price action will drop to $18.66 and lose over 25% of its value.
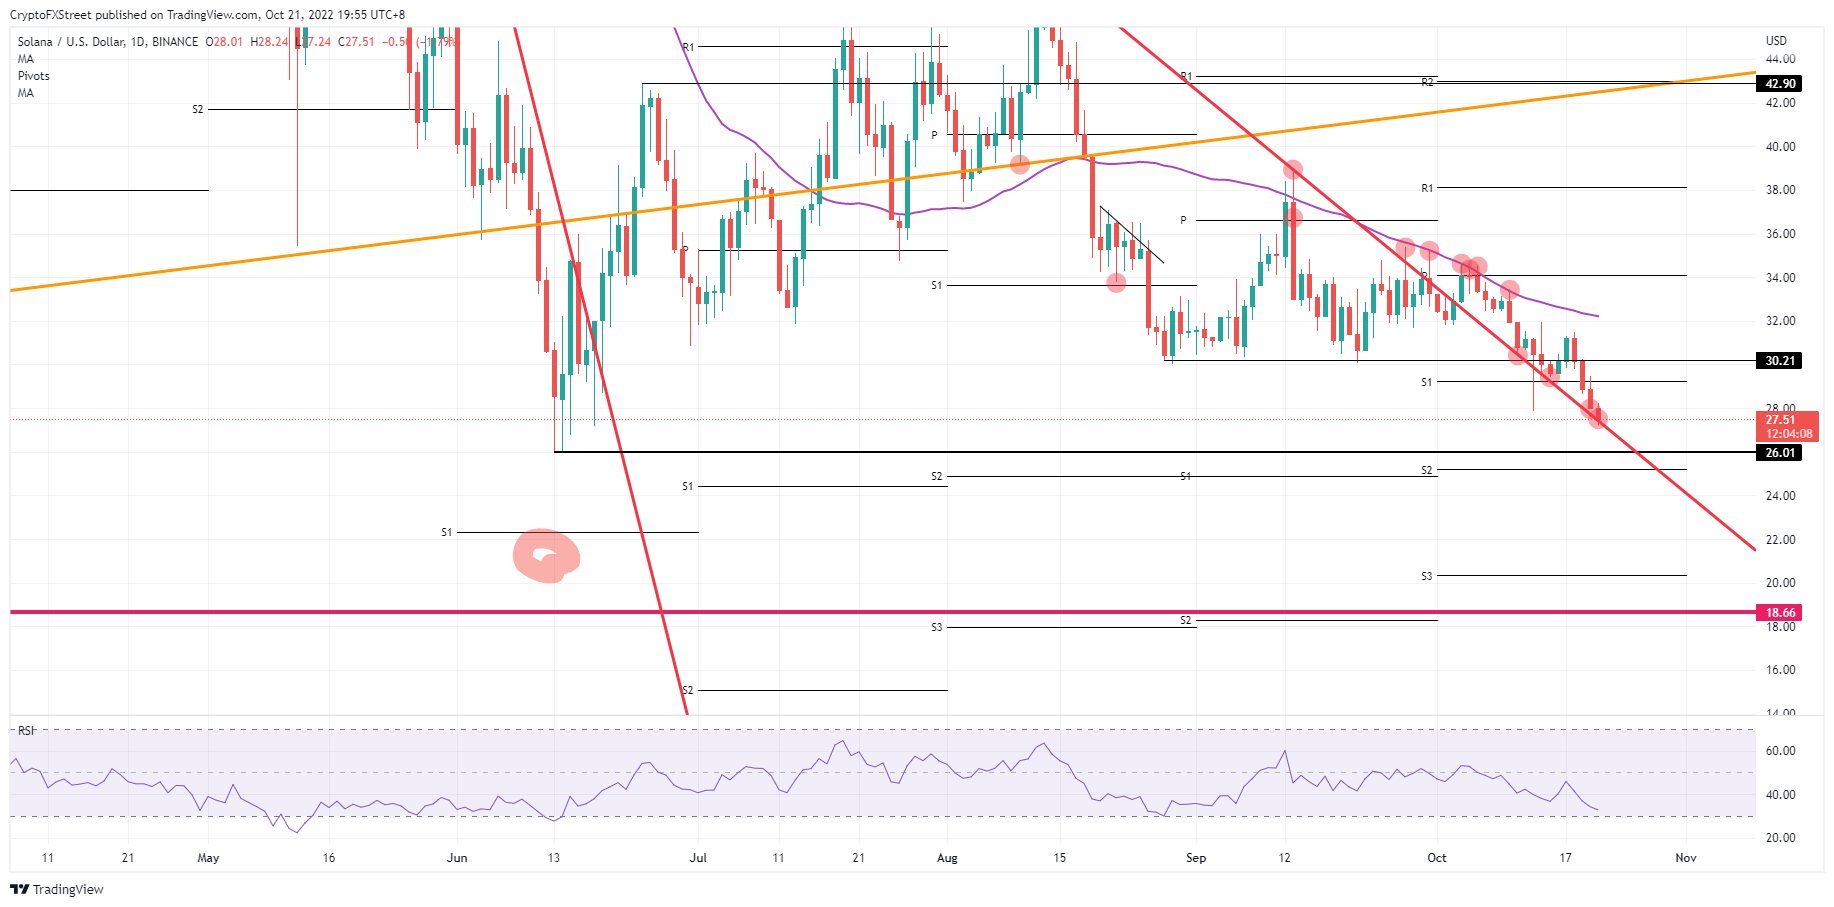
SOL/USD Daily chart
As mentioned above, bulls have the choice of stepping in and trying to trade the bounce off the red descending trend line, as waiting could lead to bearish forces increasing if price action slips below it. That would mean that bulls start buying, defending the current low, and if successful see price action ramp up to $32, which is back to the 55-day SMA. With that move completed it also means the level at $30.21 gets reclaimed again.
Author

Filip Lagaart
FXStreet
Filip Lagaart is a former sales/trader with over 15 years of financial markets expertise under its belt.


