Solana Price Forecast: SOL slips below support as sell pressure builds
- Solana price closes below its daily support level at $184.13, signaling weakness in price action.
- On-chain data show SOL’s Spot Taker CVD is negative, reflecting sell-side dominance.
- Technical analysis suggests weakness in momentum indicators, indicating a potential short-term correction.

Solana (SOL) trades in red below $183 at the time of writing on Tuesday after closing below its key support level the previous day. The bearish case for SOL is further reinforced by Spot Taker Cumulative Volume Delta (CVD) turning negative, indicating a shift toward sell-side dominance. The technical analysis shows weakening momentum, raising concerns about a potential short-term correction.
Solana bears take control of momentum
CryptoQuant data, as shown in the graph below, highlights selling pressure on Solana. The Taker CVD (Cumulative Volume Delta) for SOL turned negative last week, and the value has been steadily decreasing since then. This indicator measures the cumulative difference between market buy and sell volumes over three months. When the 90-day CVD is positive and increasing, it suggests the Taker Buy Dominant Phase, while a negative and decreasing value indicates the Taker Sell Dominant Phase.
 (1)-1753760460586-1753760460598.png)
SOL Spot Taker CVD chart. Source: CryptoQuant
Another aspect that bolsters the platform’s bearish outlook is a recent decline in traders’ interest and liquidity on the SOL chain. Artemis Terminal data indicate that SOL Chain's decentralized exchange (DEX) trading volume has been steadily declining since early July.
-1753760483292-1753760483293.jpeg)
SOL DEX volume chart. Source: Artemis Terminal
Solana Price Forecast: Bears taking control of the momentum
Solana price faced rejection around its February 14 high of $205.34 on Wednesday and declined by 10.29%. However, SOL consolidated around its daily level of $184.13 over the next three days and closed below it on Monday. At the time of writing on Tuesday, it trades at around $181.43.
If SOL continues its pullback, it could extend toward its 50-day Exponential Moving Average (EMA) at $167.12.
The Relative Strength Index (RSI) on the daily chart reads 55, pointing downwards, having fallen sharply from its overbought levels last week, indicating a fading of bullish momentum. Moreover, the Moving Average Convergence Divergence (MACD) also showed a bearish crossover on Monday, giving sell signals and indicating a downward trend ahead.
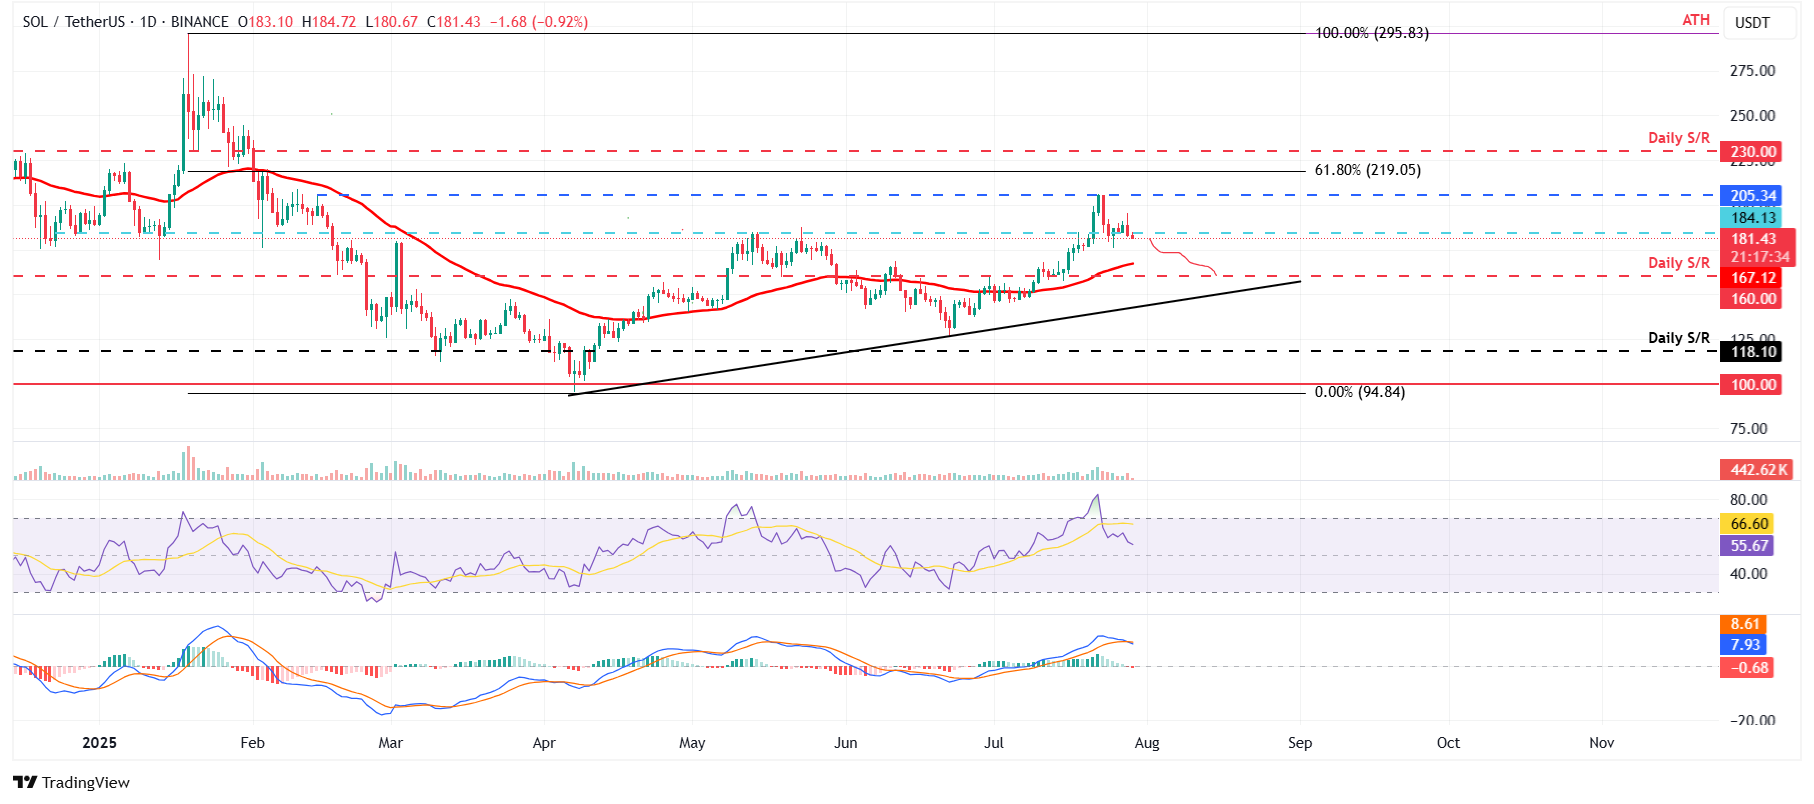
SOL/USDT daily chart
If SOL recovers and closes above the daily resistance at $184.13, it could extend the recovery toward the next resistance at $205.34.
Author

Manish Chhetri
FXStreet
Manish Chhetri is a crypto specialist with over four years of experience in the cryptocurrency industry.


