Solana Price Forecast: SOL hits key resistance ahead of Bitwise, Grayscale Solana ETFs launch
- Solana trades above $200 with over 1% intraday gains, aiming to surpass a supply zone.
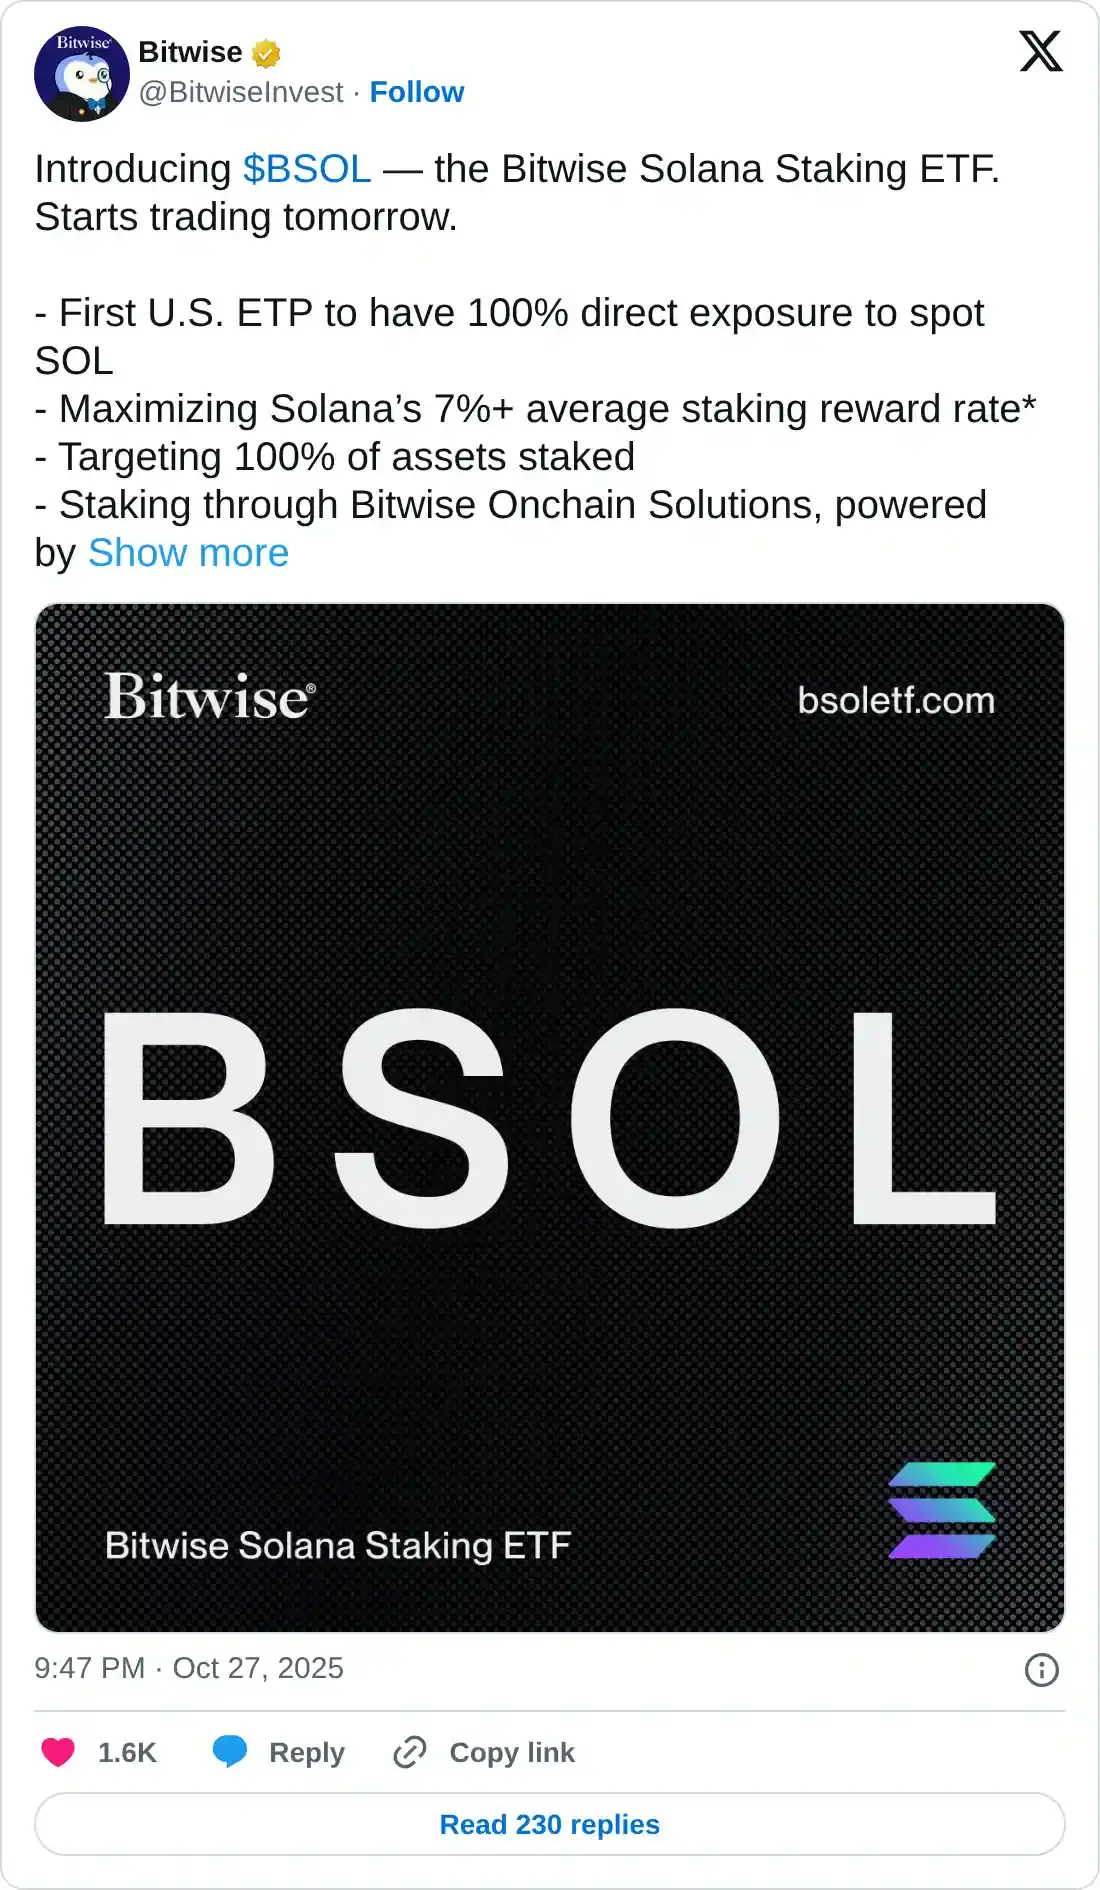
- The Bitwise Solana Staking ETF will launch on Wednesday, with staking powered by Helius Labs.
- Retail demand for Solana remains muted, suggesting a risk-averse sentiment among traders.

Solana (SOL) price edges higher by over 1% at press time on Tuesday, recovering on the announcement of Bitwise Solana Staking Exchange Traded Fund (ETF) launching on Wednesday. The technical outlook for Solana indicates multiple overhead resistances that could flip the short-term recovery, given the lack of retail support.
Solana staking ETF to be launched amid US government shutdown, interest remains low
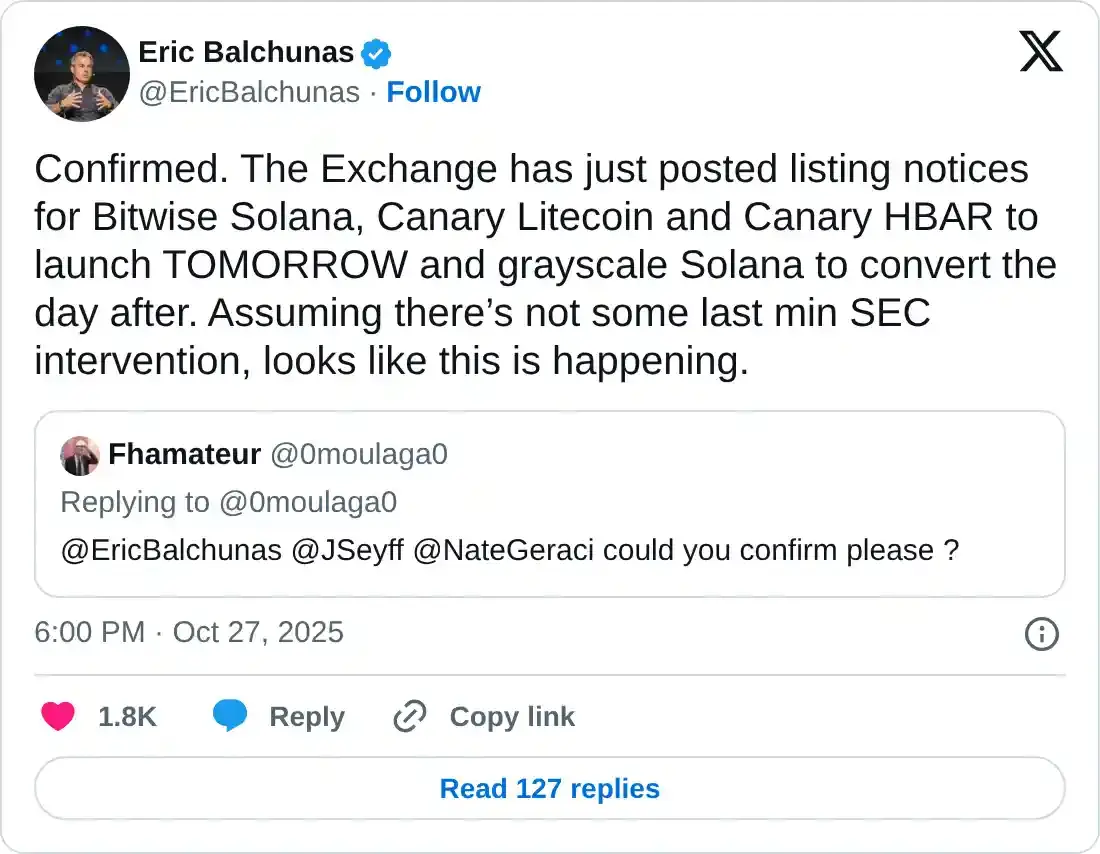
Eric Balchunas, Bloomberg ETF analyst, shared the launch of the Bitwise Solana Staking ETF (BSOL) on Tuesday, followed by the Grayscale Solana Trust (GSOL) converting into an ETF on Wednesday.
The Bitwise SOL staking ETF will capitalize on Solana’s average staking reward rate of 7%, while providing a fee waiver for a limited time. On the other hand, Grayscale holds over $105 million in Solana, which will be converted into an ETF.
Despite the announcement, the retail interest in Solana remains muted, underpinned by the broader market volatility. CoinGlass data shows that the Solana futures Open Interest (OI) is at $9.75 billion, up from $9.71 billion on Monday, and has remained largely flat below $10 billion since the October 10 correction. A stagnancy in futures OI indicates that traders are risk-averse, opting for a wait-and-see approach.
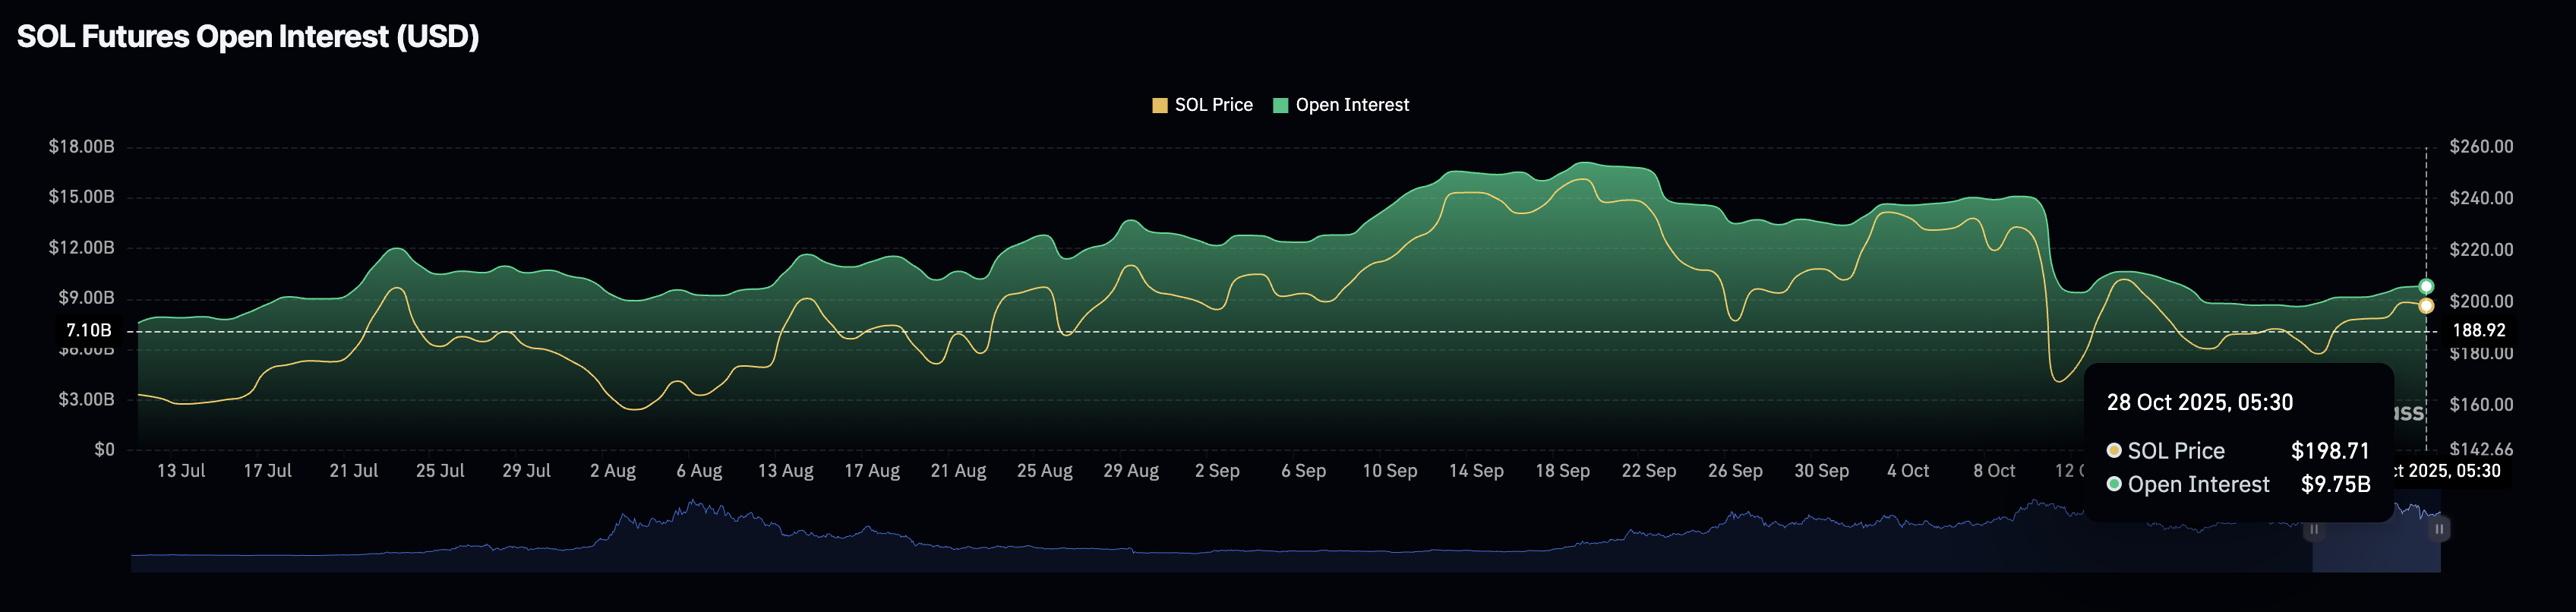
Solana futures Open Interest. Source: CoinGlass
Technical outlook: Will Solana extend its recovery above $200?
Solana trades above the $200 psychological level and the 200-period Exponential Moving Average on the 4-hour price chart. At the time of writing, SOL approaches a crucial supply zone spanning from $204 to $208.
A decisive close above this zone could encounter resistance at the $237 and $253 levels, marked by the October 6 and September 18 peaks.
However, as Solana’s recovery stalls near the $204-$208 supply zone, the technical indicators on the 4-hour chart suggest an underlying shift in momentum. The Moving Average Convergence Divergence (MACD) risks crossing below the signal line, which would signal a bearish turn in momentum.
Still, the Relative Strength Index (RSI) at 62 holds steady between the overbought boundary and the halfway line, suggesting that buying pressure remains strong.
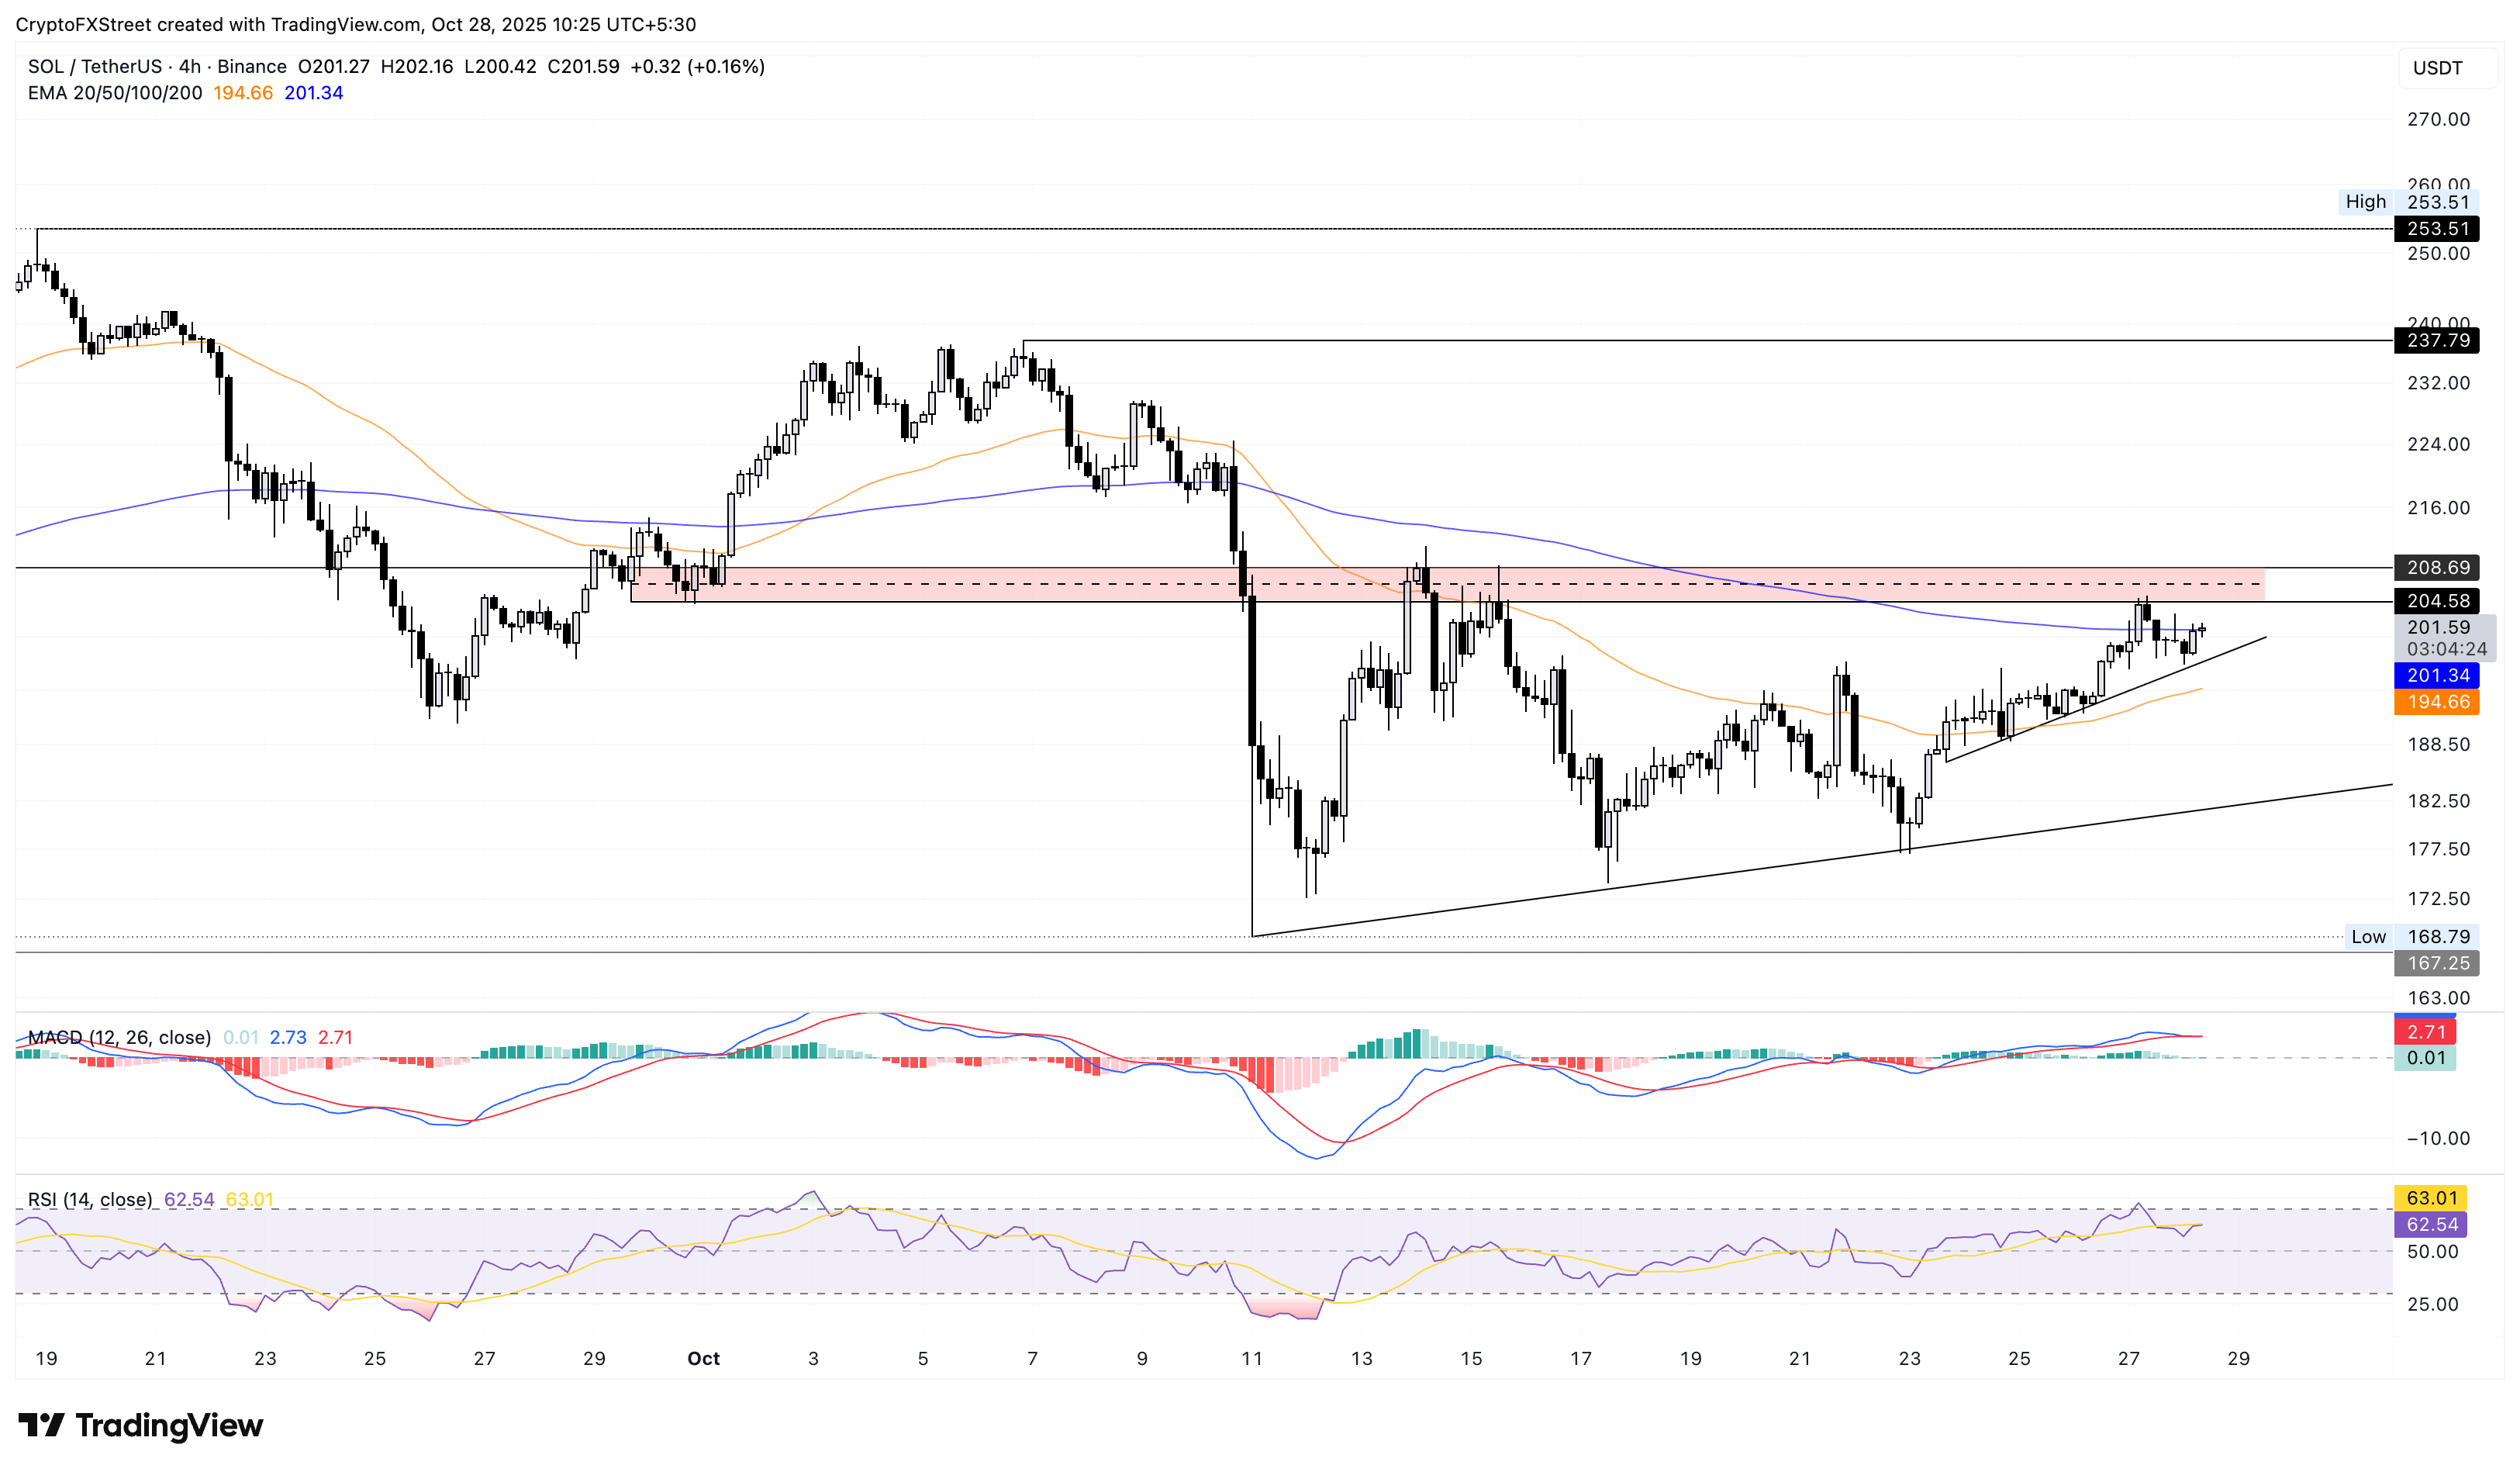
SOL/USDT daily price chart.
If Solana flips to the downside from $204, the key support levels below the 200-period EMA at $201 are the 50-period EMA at $194, followed by a support trendline formed by connecting the October 11 and October 23 lows, near $182.
Author

Vishal Dixit
FXStreet
Vishal Dixit holds a B.Sc. in Chemistry from Wilson College but found his true calling in the world of crypto.