Solana Price Forecast: SOL bulls eye $250 breakout, but declining on-chain activity could delay move
- Solana reclaims support above $220 as traders increase risk exposure and buy the dip on Wednesday.
- Solana's DeFi TVL declines by over 3% in the past 24 hours, signaling a lack of investor conviction in the uptrend.
- Solana's blockchain experiences a decline in active addresses and transactions amid a drop in on-chain activity.

Solana (SOL) offers subtle bullish signals, trading above $220 on Wednesday. The short-term outlook for the smart contracts token mirrors that of the broader cryptocurrency market, which is generally recovering after the correction experienced on Tuesday.
Bulls appear intent on pushing for gains toward the $250 resistance amid the 'Uptober' narrative and optimism for the approval of related Exchange Traded Funds (ETFs) by the US Securities and Exchange Commission (SEC). However, a steady decline in on-chain activity warrants caution among investors, as it may be challenging to sustain accrued gains.
Assessing Solana's on-chain activity
Solana's Decentralized Finance (DeFi) Total Value Locked (TVL) has decreased by over 3% in the past 24 hours, reflecting the short-term bearish sentiment in the ecosystem.
TVL, which represents the notional value of all coins held in smart contracts on the protocol, averaged $12.48 million on Wednesday from $12.91 billion on Tuesday. Investors transfer their assets from staking smart contracts when intending to trade or sell. A steady decline in TVL would indicate that investors are losing confidence in the ecosystem, encompassing a bearish signal.
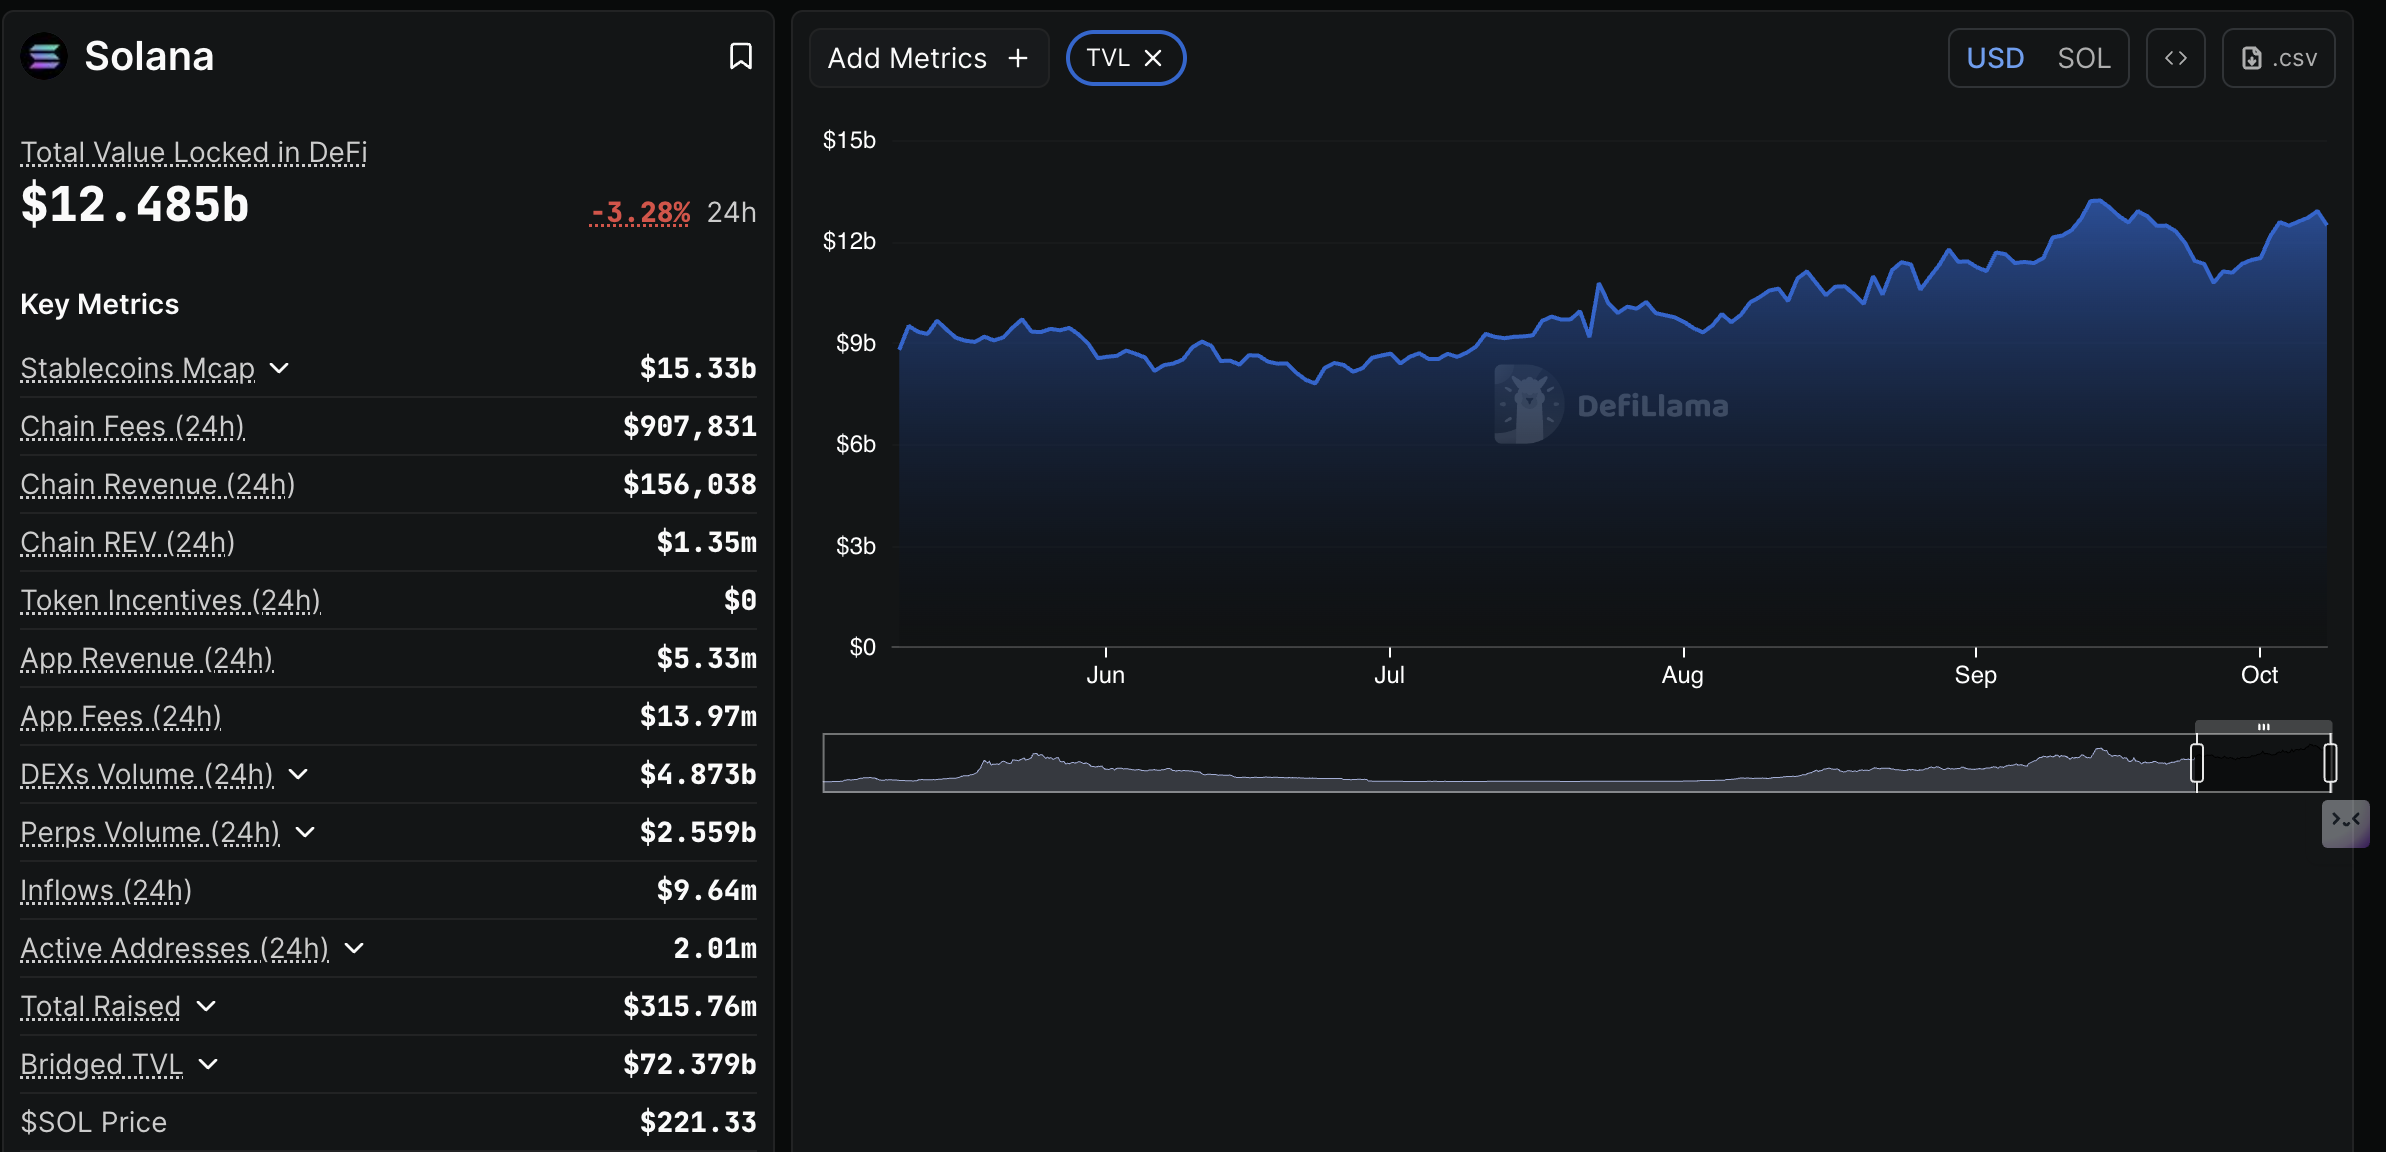
Solana DeFi TVL | Source: DefiLlama
A steady decline in the number of active addresses on the Solana blockchain since late May expands the bearish outlook. DefiLlama's weekly data shows that addresses actively transacting by sending or receiving assets on the protocol stand at 6.2 million, marking a significant drop from the 33.33 million recorded for the week between May 19 and May 25. Such a significant drop implies reduced user engagement and a decline in demand for SOL.
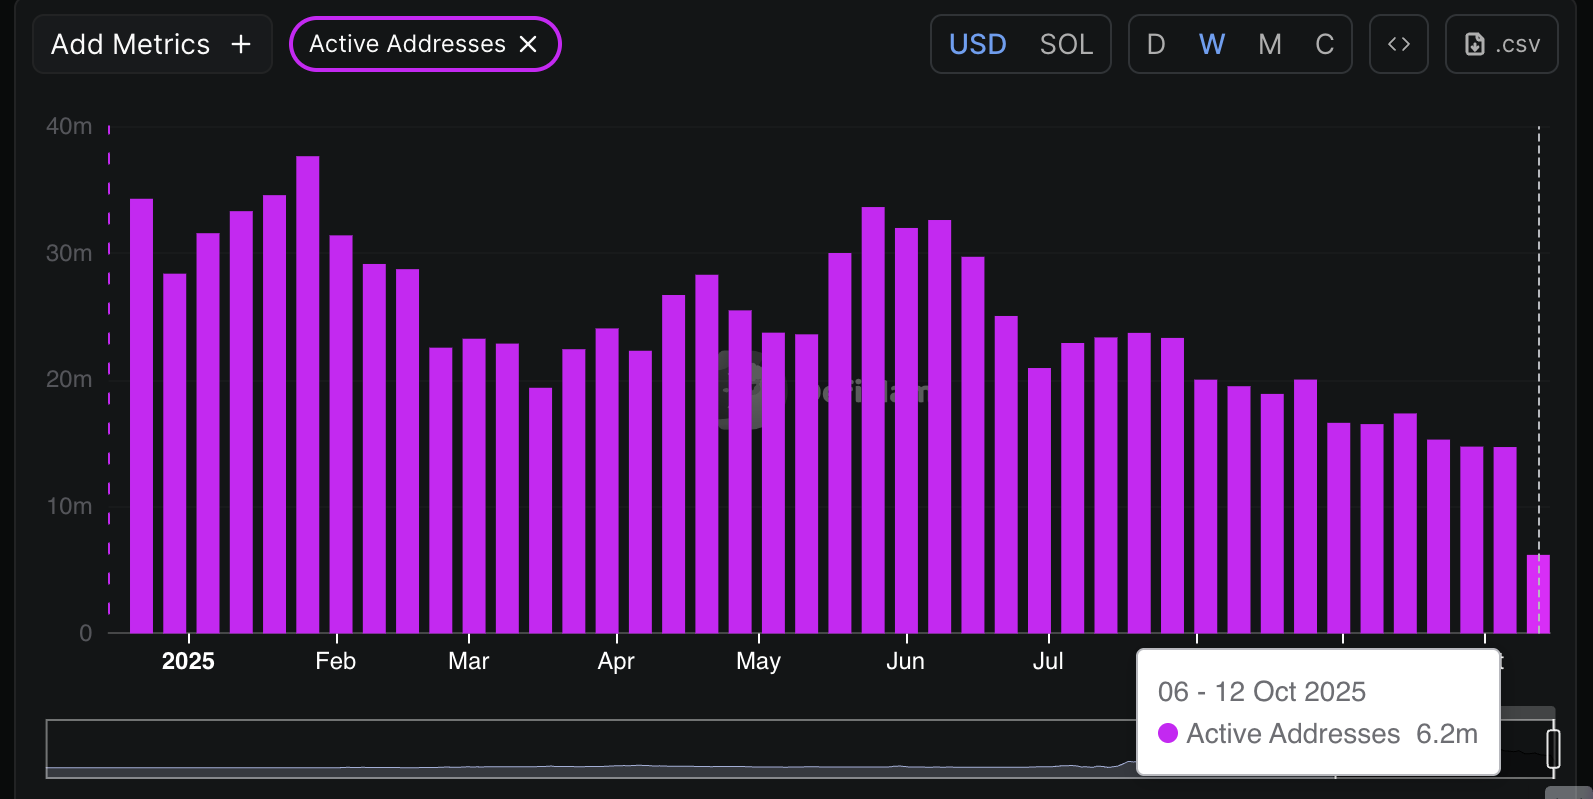
Solana Active Addresses metric | Source: DefiLlama
The number of transactions on the Solana blockchain has declined in recent weeks. According to DefiLlama's weekly chart below, transactions on the network stand at 173.72 million so far for the week between October 6 and October 12, representing a steady drop from the 613.14 million recorded for the week between July 21 and July 27.
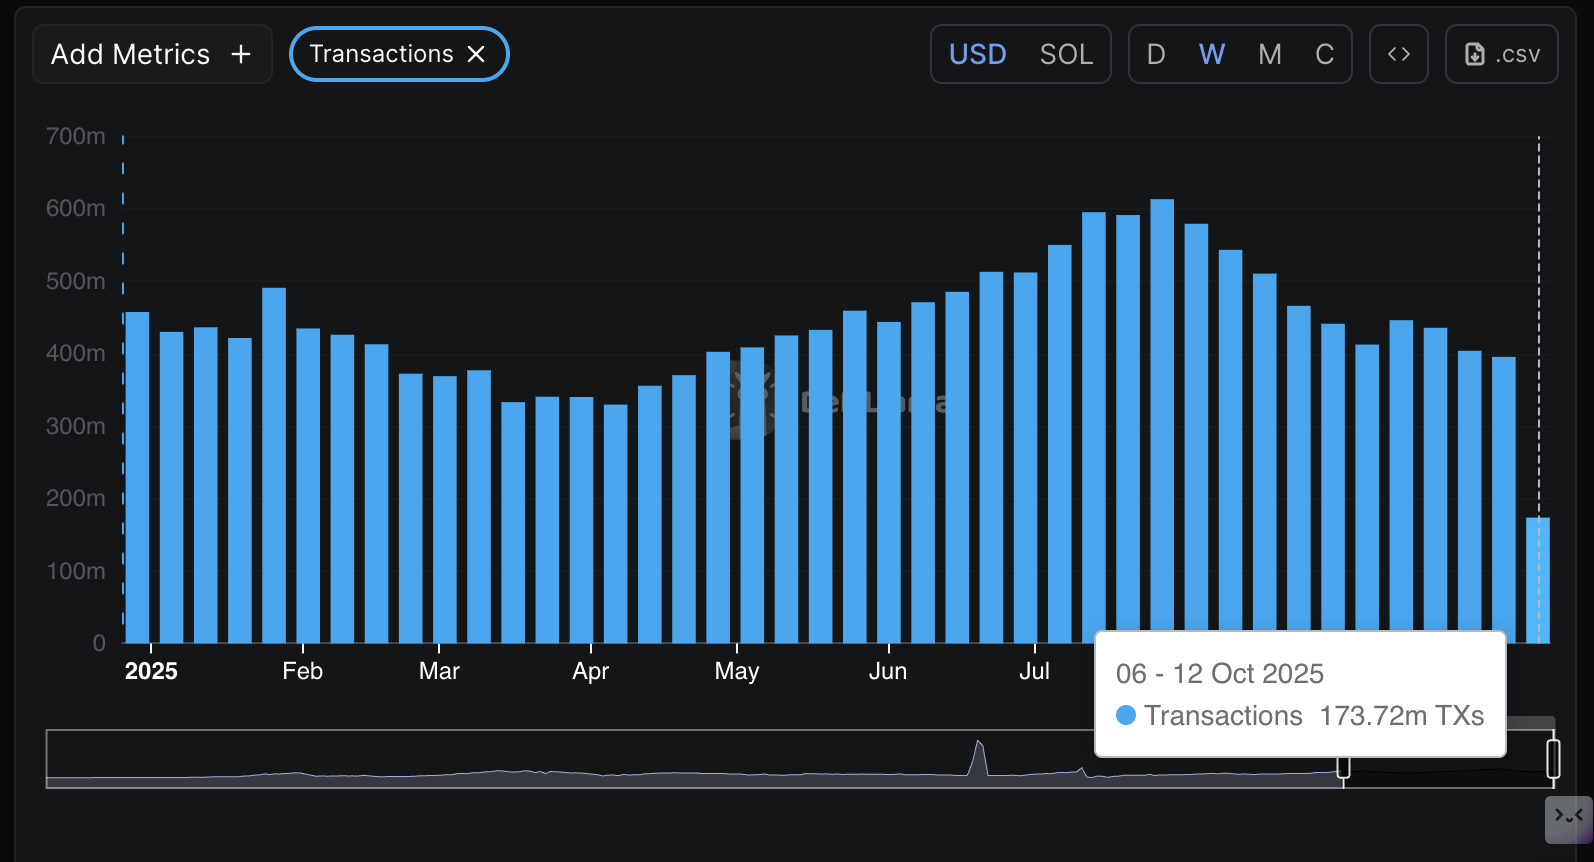
Solana Transactions metric | Source: DefiLlama
With on-chain activity dwindling by the week, bulls could face difficulty sustaining the uptrend. Therefore, investors may want to prepare for instances of high volatility, where the Solana price breaks out but then trims its gains due to a lack of on-chain support.
Technical outlook: Can Solana defend its short-term support?
Solana is trading between the 200-period Exponential Moving Average (EMA) support at $218 and the 100-period EMA resistance at $222 on the 4-hour chart at the time of writing on Wednesday.
The Relative Strength Index (RSI), which has rebounded to 42 after declining to 35 earlier in the day, underpins intraday bullish momentum. However, its return above the midline would reinforce the bullish grip, increasing the chances of SOL breaking above the 100-period ($222) and 50-period EMA ($224) resistances.
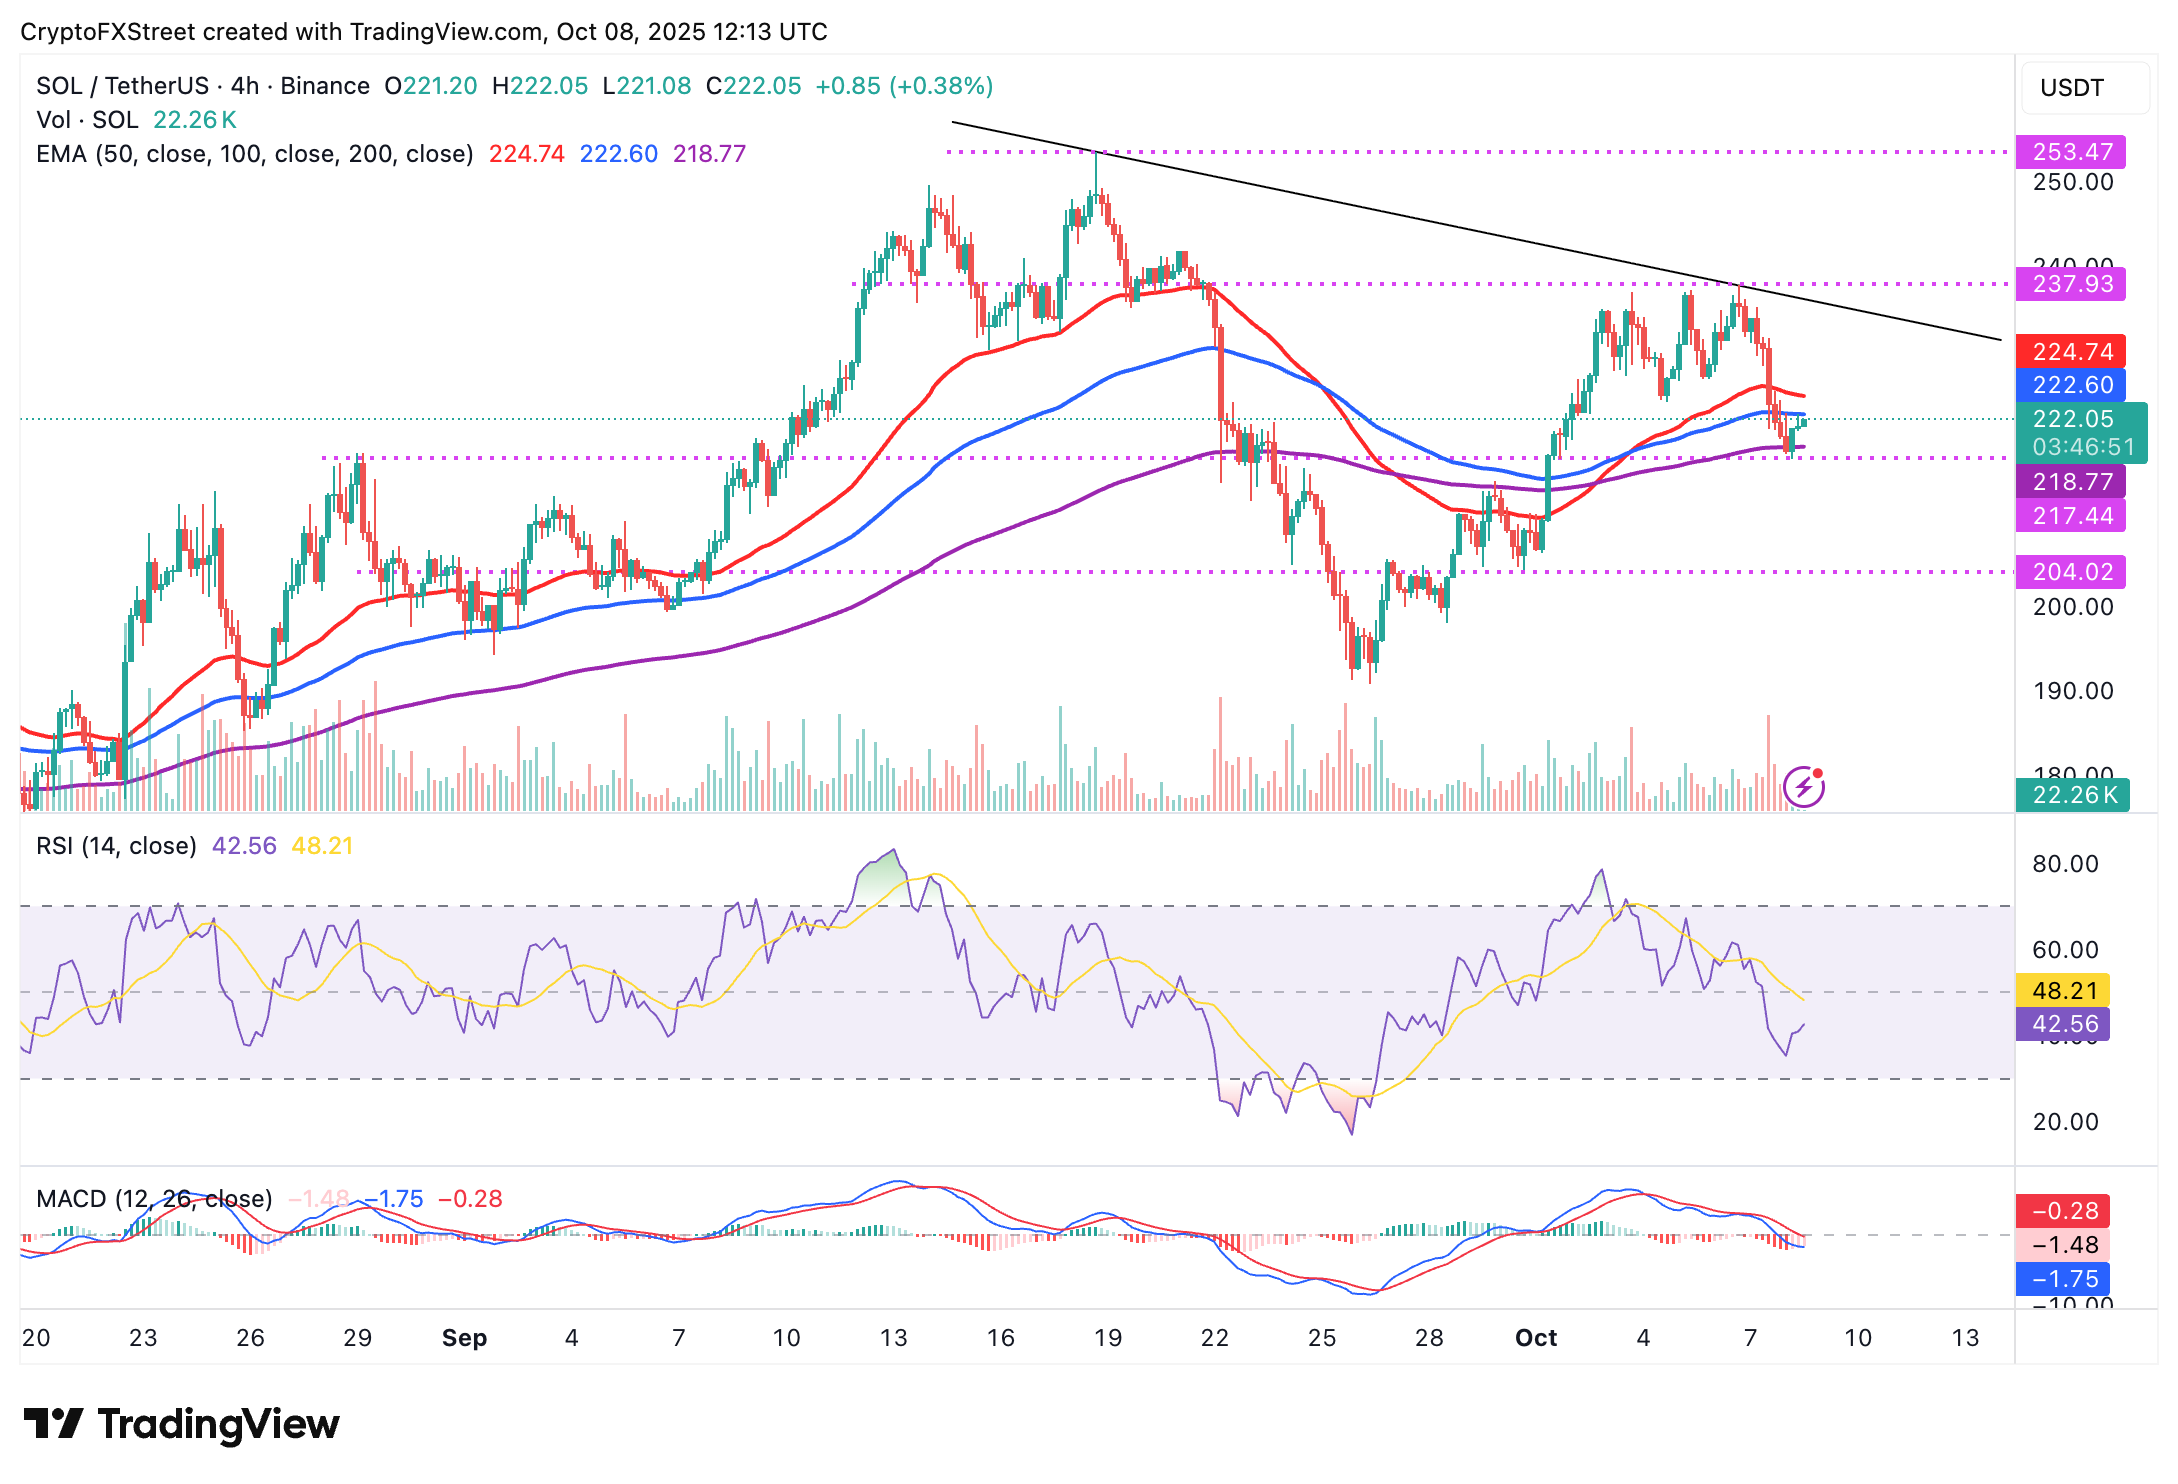
SOL/USDT 4-hour chart
Traders will also look out for recovery above the general descending trendline on the same 4-hour chart to validate the bullish potential toward the $250 psychological resistance. Still, it is too early to rule out the possibility of further losses below the 200-period EMA support at $218, with the demand zone at $204 standing out as a tentative level of support.
Cryptocurrency metrics FAQs
The developer or creator of each cryptocurrency decides on the total number of tokens that can be minted or issued. Only a certain number of these assets can be minted by mining, staking or other mechanisms. This is defined by the algorithm of the underlying blockchain technology. On the other hand, circulating supply can also be decreased via actions such as burning tokens, or mistakenly sending assets to addresses of other incompatible blockchains.
Market capitalization is the result of multiplying the circulating supply of a certain asset by the asset’s current market value.
Trading volume refers to the total number of tokens for a specific asset that has been transacted or exchanged between buyers and sellers within set trading hours, for example, 24 hours. It is used to gauge market sentiment, this metric combines all volumes on centralized exchanges and decentralized exchanges. Increasing trading volume often denotes the demand for a certain asset as more people are buying and selling the cryptocurrency.
Funding rates are a concept designed to encourage traders to take positions and ensure perpetual contract prices match spot markets. It defines a mechanism by exchanges to ensure that future prices and index prices periodic payments regularly converge. When the funding rate is positive, the price of the perpetual contract is higher than the mark price. This means traders who are bullish and have opened long positions pay traders who are in short positions. On the other hand, a negative funding rate means perpetual prices are below the mark price, and hence traders with short positions pay traders who have opened long positions.
Author

John Isige
FXStreet
John Isige is a seasoned cryptocurrency journalist and markets analyst committed to delivering high-quality, actionable insights tailored to traders, investors, and crypto enthusiasts. He enjoys deep dives into emerging Web3 tren


